


In a constantly changing field like digital marketing, it’s easy to get overwhelmed with all the new strategies involved with improving the user experience like paid search efforts, CRO, or SEO that ultimately help with your A/B testing to increase conversions, but more importantly, increase revenue.
There are so many ways to do A/B testing in ad platforms, on landing pages, blog posts, and even on your website.
From new smart bidding strategies, research-backed campaign structures, new advertising platforms entering the space, new ad/landing page copy, landing page formats, and CTAs, etc..
But how would you know which strategy should be implemented first?
And from there, how would you measure results to see if your strategy is actually working and having a positive impact on your bottom line?
The best way to do this is through an A/B testing framework, a valuable ruleset all marketers should be familiar with. But if done incorrectly could give you wrong insights for your marketing strategy.
Get brand new marketing strategies straight to your inbox. 23,739 people already are!
This is why now more than ever, marketers need to understand the A/B testing process and how to do it effectively.
What is A/B Testing?
A/B testing (also referred to as split testing) is a testing method that gives you valuable information about how your target audience behaves.
You’re basically comparing two versions of the same thing with variances to them - whether that be a campaign bidding strategy, email, text in an ad, or landing page headline to determine which version your target audience reacts better to.
Marketers could use A/B testing to improve anything from micro-metrics like click-through-rates, traffic volumes to your homepage, and time-on-site to the bigger picture metrics like conversion rates and revenue. Even the smallest improvements can have an impact.
A study conducted by Campaign Monitor shows that only 61% of marketers use A/B testing to improve their marketing performance.
Those that do A/B test (and have their tests set up correctly) have shown an improvement in performance 25% of the time.
In order to start setting up your first A/B test, it’ll be important to understand the different parts of an A/B test.
A/B testing relies heavily on statistics and data collected from champions and challengers.
Marketers collect this data which could give them information about the audience they’re marketing to in order to make more informed marketing decisions.
Champion
A champion is the marketing asset you currently have running, also known as your “control”.
This is the controlled variant that you would test any theories you’d have against. You could think of this as “version A”. Typically you’d only want to test one element at a time against your champion. An example of potential elements you could test would be like a headline within an ad, the call-to-action text on a button on your landing page form, a different button color or even a different hero image on your landing page.
The reason you should only test one thing at a time is because you want to know what specific change that you made gave you the end result - good or bad.
Was it the updated hero image? The call-to-action text change? If you were to update both of these things in the same A/B test variant, how would you know which change gave you the result?
Challenger
Challenger variants are what I alluded to earlier - this is the “hypothesis” or variant of the same marketing asset that you’d want to test against your champion variant.
For an A/B split test, you’d only want to test one variable at a time, so you know with the most certainty that this one change to your marketing asset is what produced the result you were testing for. You could think of this as “version b”.
This is why it’s called A/B testing.
It’s important to understand and set up variant tests correctly as it leads to marketing insights that would influence the rest of your marketing campaigns and impact your business overall.
What Variables Should You Test First?
To answer this question marketers must first do their research. There are other kinds of testing in addition to just the A/B test such as multivariate testing and split URL testing.
Multivariate Testing
In contrast to A/B testing, multivariate testing tests multiple sections and combinations of a webpage against each other within a single test. Unlike A/B testing you aren’t just testing one variable at a time.
An example would be something like changing a hero image, a CTA button, the main headline and even the main color palette of a webpage all at once, within the same challenger variant.
With this method you could see which combination of changes had an impact on performance rather than a single variable.
Split URL Testing
Very similar to A/B testing with a key distinct difference - each variant is hosted on a different URL.
So if that’s the only difference, why would you ever use this method over A/B testing?
A/B testing should be used when there are only front-end changes while split URL testing is used when a redesign is implemented on a webpage to avoid making huge fundamental design changes to the original control.
For most business owners, time is of the essence which means every test should be conducted thoughtfully and set up as accurately as possible.
This just goes to show how important it is to pick the right variable to test first.
It’s also important to understand the difference between quantitative and qualitative data. Quantitative data is typically expressed as numbers. So metrics like conversion rate, click-through rate, impressions, clicks, and conversion volume would be considered quantitative.
In contrast, qualitative data is measured through observations, interviews or surveys - a great example of this would be a pop-up website poll that records users’ answers to questions that the polls ask to get a better understanding of why users’ aren’t interested in your product or service.
There are many tools a marketer can use to get an idea of what A/B tests would be most beneficial to test first.
Here are a couple of my favorites along with some examples.
Pop-up Polls
You could use any other polling software for this, but I typically use Hotjar. Hotjar polls are pop-up widgets from Hotjar you could install on your webpage via javascript.
You could apply settings to ask users a question about their experience, the reason for leaving your site, or anything else. Then you could provide multiple answers the user could click on within the widget and collect that insight.
I love applying Hotjar polls to landing pages because it gives you a more accurate view of what users are thinking when they go through your funnel. Questions like “why aren’t users converting on my page?” are typically answered with theory and speculation. Hotjar polls give you feedback from actual visitors
Here’s an example of feedback I received from visitors by implementing this poll on a page that offered a free trial. We wanted to understand why users were not signing up based on the landing page they were given in hopes to improve the conversion rate. We received the feedback below:
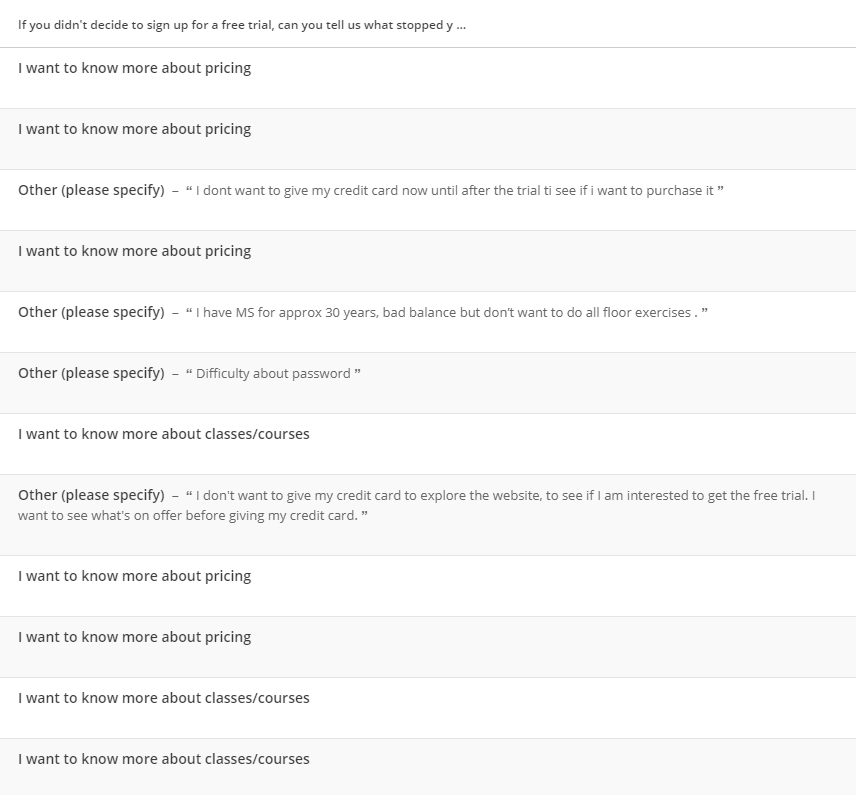
Now that’s a lot of insight from users you could use to decide what to use in your A/B testing process. At first glance, I’m seeing a good amount of visitors who want to know more about pricing.
A great A/B test would be to implement messaging on the CTA that lets the user know that they could receive pricing information if they filled out their information.
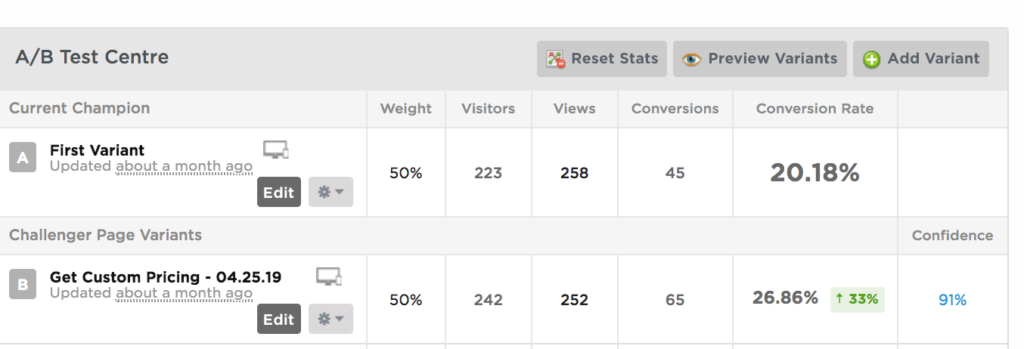
By adding the pricing copy to the landing page variant above we were able to increase the conversion volume by 44% and increase the conversion rate by 33% with a 91% confidence level.
Hotjar Heatmaps
Hotjar heatmaps are another great way to track visitor behavior on your landing page, implemented via javascript as well. With heatmaps, you could understand things like how far a user scrolls, what they click on, and even segment by device.
For this example, I wanted to understand how to increase my client’s booking volume. Understanding what users are clicking on really helped me understand what I should be excluding:
 Hotjar Heatmap - 7.53% of clicks shown on the login button[/caption]
As you can see, a good amount of clicks, or 7.53%, came from the login button as well as the buttons on the top right-hand corner of the homepage. From this alone, you could perform a test to remove the login button entirely from the landing page and even exclude an audience for users who are already members.
Call Recordings
Call recordings are quite an underestimated tool for A/B testing research. Here at KlientBoost we use CallRail which records a visitors’ call that you could then listen to at a later time.
For one of my landing page tracking numbers I was able to listen to a call recording of a customer inquiring about what my client offered. This client was a lawyer advertising in the New York area. It sounded like all they read was our landing page headline, which was “Highly Rated Personal Injury Lawyer In New York”. The customer was asking if my client offered “free advice” and if they had to pay for anything just by speaking with them on the phone.
This was huge because the call-to-action button we had on our landing page was “get your free consultation”.
What if we were to change the call-to-action button to “get free advice” instead? It could potentially be much less threatening and more digestible for customers in that area, which could lead to higher conversion rates.
I launched this exact test for this same client that I’m referring to above, here’s the small change I applied to the call-to-action button.


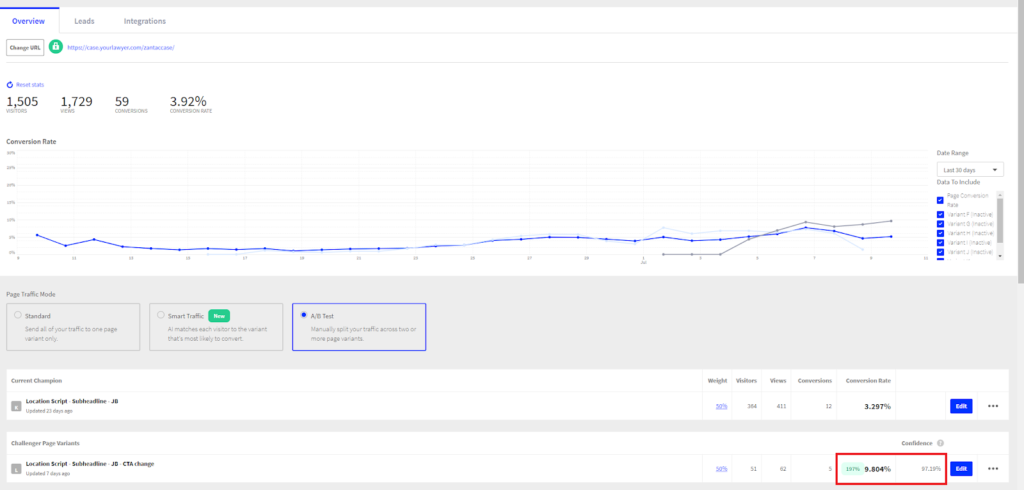
Pictured above is the overall conversion rate (when a user submits a form since we’re using a multi-step form on this landing page).
Could you have experimented with this on your own without the CallRail recordings? Perhaps.
But the recordings definitely made it easier to identify what the customer’s friction point was. By utilizing this information I was able to construct a very thoughtful A/B test on the call-to-action button backed by the data I had available, increasing the conversion rate by 197% with a 97.19% confidence level.
Using Search Term Data
Search terms are the actual searches that users type into Google’s search engine to trigger your ad.
Once they type in their search and click your ad, the exact search terms that they type into the search engine will be available for you to see within the Google Ads interface.
These search terms could be another great research tool for headline testing ideas. Any account that runs search campaigns can give you this valuable data, and if you have conversion data even better.
For me, I like to look at search terms in the past 30 days that have converted at least once excluding branded terms. The reason I typically exclude brand terms is because I want to incorporate the non-brand search queries into my copy to make it more relevant to the searchers’ intent.
Then, I like to sort by conversion volume to see if there’s a good amount of impressions for this search term, which shows demand for that search.
One of my clients offers outdoor paver and living solution installation, and below you’ll find a couple of useful queries:
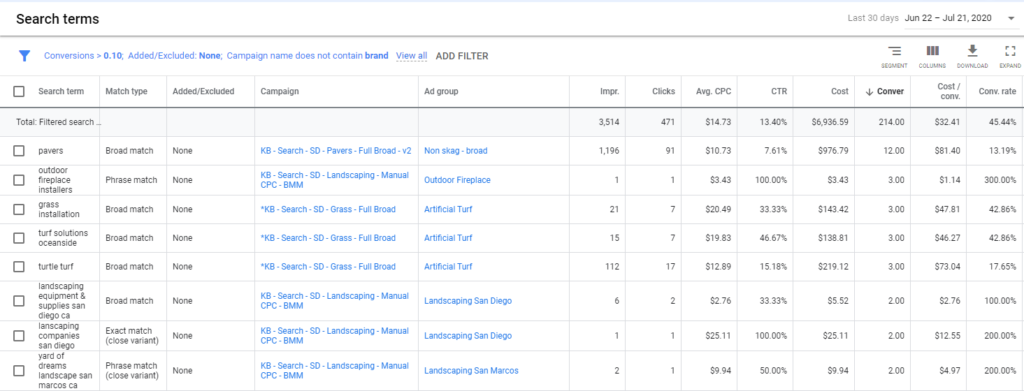
From just this, I’ve already thought of a couple of variant tests.
One test I could run after seeing this search term report would be a location-based ad headline like “Best Turf Solutions In Oceanside” or even “#1 Landscaping Company in San Diego” in order to improve CTR.
For this test I took advantage of ad customizers which you could read more about here. In a nutshell you could dynamically change the headline within an ad based on the users’ search location.
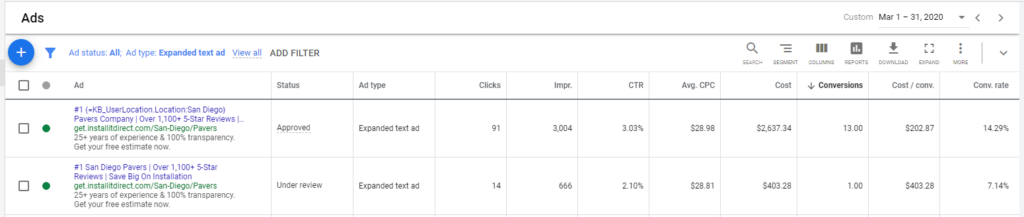
Below you’ll see how I applied this finding to an ad customizer within an expanded text ad this March. Specifically, I changed the headline to “#1 {user’s search location} Pavers Company”.
Notice how both the CTR (93% confidence) and even conversion rate (83% confidence) is up significantly just by adding the users’ search location to the headline, making the ad specific to them.
Facebook Ad Social Proof
Social proof within our ads is another element within marketing that is often overlooked, but it gives us a direct link to our customers and their understanding of our product offering.
For one of my streaming clients, we were in the middle of a growth streak expanding into other industries and needed some ideas on how we could expand our product offering to more than just the gaming industry.
In the middle of a pandemic of March 2020, it wasn’t that hard to grow our current audience but expanding to industries outside of gaming has been one of this client’s goals for quite some time.
Looking at the Facebook post comments we were able to get some great ideas on what ad creative/landing page we could test against our legacy page.
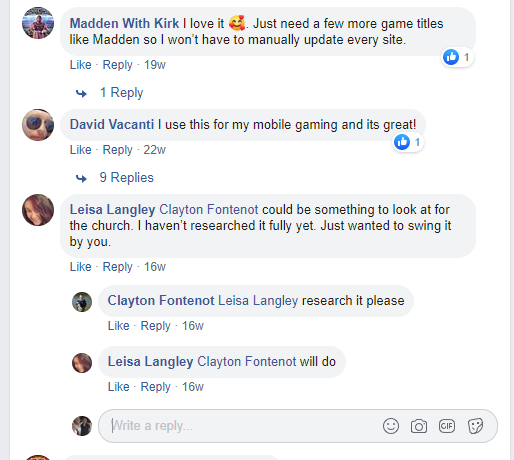
This definitely showed us demand for this streaming software within the church industry, so we decided to launch creatives tailored to users looking to implement our streaming software for their church services.
As a result, we were able to cut the CPA in half and more than double the ROAS for this client. ROAS stands for return on advertising spend.
For example, if you spent $2,000 on ads within a single month and your revenue (aka return) for that same month is $10,000, your ROAS would be the ratio between your return and your spend - 5.0.
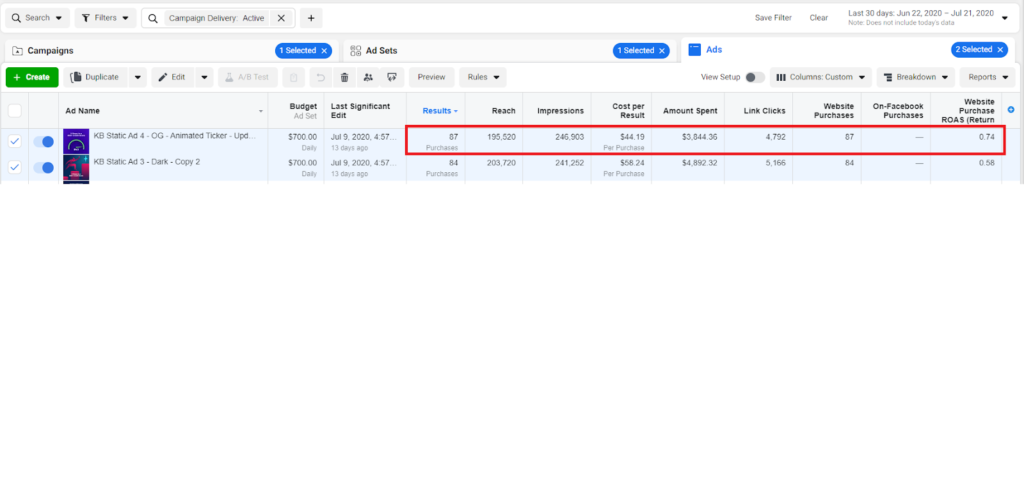
Below you could see the specific results we achieved just by creating that specialized ads/landing page and A/B testing it against our legacy ads/landing page:
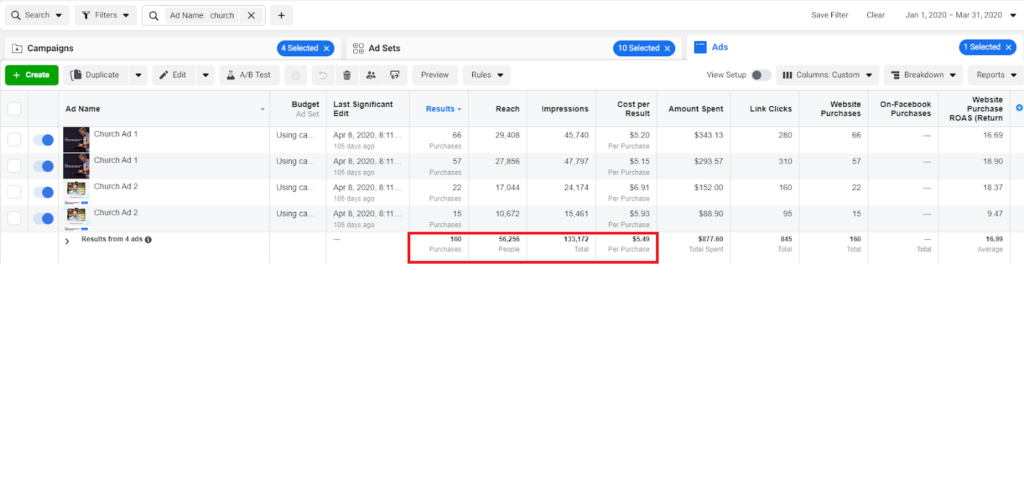
This just goes to show how you can find little golden nuggets of feedback and information you can use for your A/B testing ideas. Applying what we learned from reading the Facebook Ad comments (customers saying it would be great if we serviced churches) we were able to implement new facebook ad creatives that had a CPA 53% lower and a ROAS 200% higher than our original creatives.
Using Competitor Tactics
There’s nothing wrong with looking at what your competitors are doing either.
I do it all the time for ad copy, landing page layout/copy, and even Facebook ad ideas using Facebook’s Ad Library.
One late night I was browsing Facebook and saw an animated ad which showed a ticker illustrating an individuals’ credit score improving from low 500 to over 800. One of my clients, competing in the same space, had been using the same ads on Facebook for years and came to KlientBoost hoping for a refresh- I thought this would be a great new ad that we could improve upon and launch for my client.
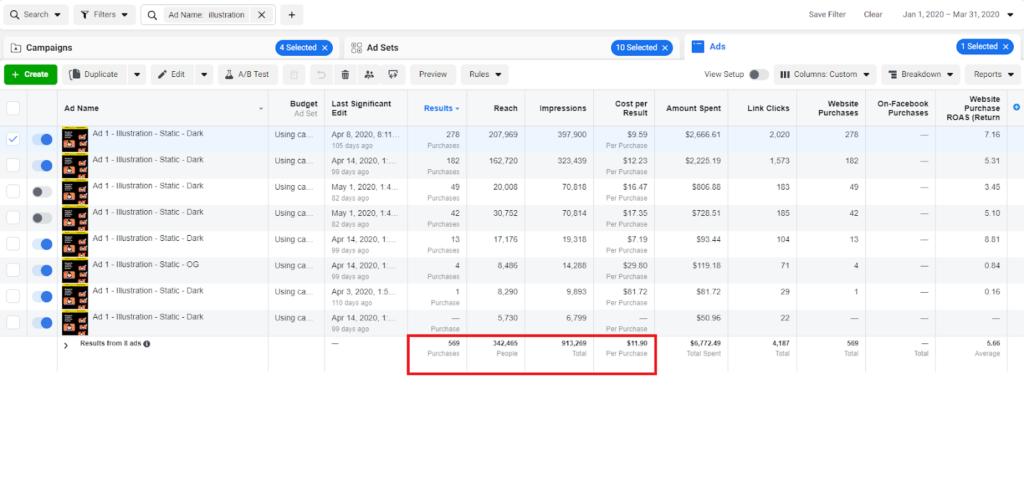
I used this competitor intel to launch an idea of having an animated ticker ad that illustrates an improving credit score, from low 500s to over 800.
This was essentially what I wanted to illustrate for my client’s customers so I thought I’d give it a try for my client.
From just looking at a competitors’ ad and essentially copying their idea and making it our own I was able to improve the CPA with this A/B testing idea, which saw a 24% decrease.
Not only that, but the ROAS saw a 28% increase as well.
Setting Up Your A/B Test
Now that we have a variety of A/B testing ideas with some tools I outlined above, it’s time to set up your A/B test.
Step 1. Set a goal
The first thing you want to do is set a goal for your A/B test. Most online marketers want to increase conversions/conversion rates.
But for some who don’t have conversion data (perhaps for newer accounts), your goal could be set to increase CTR, decrease the average cost per click (which is a byproduct of increasing CTR and ad relevance), decrease bounce rate or even time on site.
Step 2. Make sure tracking is in place
One mistake I see many marketers make is having incorrect tracking.
Oftentimes you’ll have multiple conversion goals being tracked and included in your reporting (if you’re advertising with Google Ads) or even the same conversion event firing multiple times.
This could skew the data and count the same conversion action twice, inflating test results which could also give you inaccurate results from your A/B test.
If you’re testing anything on your website which has multiple traffic sources (like paid ads, social or referral) then I highly recommend making sure you have your conversion goals on Google Analytics set up correctly.
Having your Google Analytics conversion goals set up accurately will help you see the overall effectiveness of any website A/B test you conduct, which wouldn’t be limited to just one traffic source like Google Ads.
Step 3. Define your “control” and “challenger”
Earlier I alluded to a control and challenger variant. Once you decide what variable you want to test from the ideas I listed earlier, the “control” will be the version of your test without the changed variable, also known as the previous “champion” variant.
For example, if you were testing an ad customizer within headline 1 (pictured in a previous example of mine), the “control” would be the version of your ad that does not have the ad customizer headline. The “challenger” would be the different ad that contains the ad customizer headline in this specific A/B test.
It’s very important not to change too many variables/elements for your A/B test since you want to know with the most certainty that a change you made pushed you closer to the goal you set in step #1.
An example of too many changes would be a change in your Google Ads campaign’s automated bidding strategy (from maximizing clicks to maximize conversions) and an update to the headline 1 with the ad customizer change based on the user’s search location. Or maybe a change to your call-to-action, hero image and a design overhaul of your website/landing page.
If you were to get favorable results like I did - which would be an increase in CTR and a doubled conversion rate - would you attribute the improved performance on the automated bidding strategy change, updated headline, change to your call-to-action, hero image change or even a design overhaul?
This is exactly why we choose to only test one element at a time - so we know with confidence and certainty that our change had an impact.
Step 4. Create the variant
You could use any A/B testing tool you feel comfortable with like Google Optimize, Instapage or even Shogun. At KlientBoost we like to use Unbounce. With Unbounce’s A/B testing tool, it’s very easy to make a change within the interface and it even records your conversion rates with statistical significance automatically.
I simply duplicate the current “champion”, make a change in that duplicated variant (this change could be anything you choose to test first like a CTA, hero image or headline), then rename the variant accordingly. Once that’s done you simply need to set the traffic to divide evenly between the “champion” and “challenger” variant, ideally 50/50.
If you’re trying to A/B test headlines in your Google Ads, you simply need to make sure there are only two ads within the ad group you’re testing in and have your ad testing settings within the campaign level set to “do not optimize: Rotate ads indefinitely”.
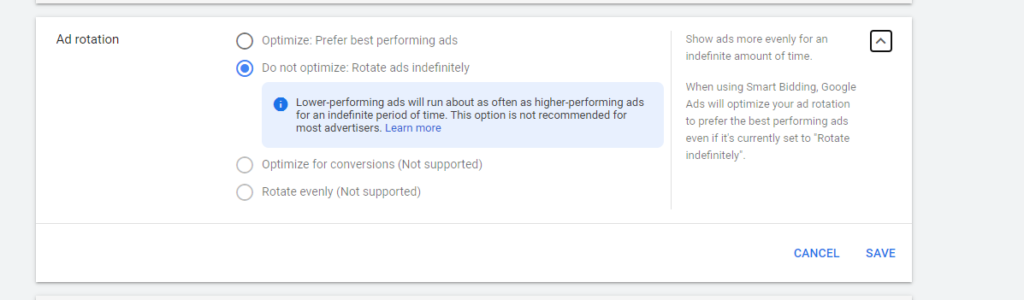
If you had this setting set to “optimize: prefer best performing ads” it’d be more difficult to ascertain which variant of your ad had better performance for this A/B test. When that setting is on Google will not divide the traffic evenly between them which can skew the results accordingly and would essentially add another changing variable into the mix that you wouldn’t have full control over.
Sure - eventually Google would optimize the better performing ad over time anyway and send a majority of traffic to that ad with the “optimize: prefer best performing ads” setting checked but for a quicker, truer test I’d leave that setting off and rotate ads indefinitely.
Step 5. Define your start time
Noting when you’ve started this test is extremely important because with most A/B testing software you can adjust the date range and view metrics within that range.
By knowing exactly when you launched your A/B test you’ll have the data for each variant that you create. Not only that but you’ll also know whether or not your test has reached statistical significance or has been running long enough for you to end it.
Step 6. Gathering Data - How long should you run your A/B test?
The answer to this question really depends on the amount of traffic you have and the drastic difference between your two variants. Too little traffic will not give you statistical significance. More on statistical significance here.
In a nutshell, statistical significance helps you determine, given a sample size, if a result is likely due to chance or the single change you made to your variant. When your test has enough confidence, you can determine whether or not it worked.
In other words, the lower your statistical significance level is, the higher chance your winning variant isn’t actually a winning variant at all. If you had an A/B test result that had a 95% confidence level, you can say that if you were to run that same test over and over again, 95% of the observed results are real and not caused by randomness.
In contrast, if you had a 60% confidence level and you were to run that same A/B test over and over again, the observed results would only be real 60% of the time while the remaining 40% of results would be due to randomness - not the best when trying to determine what changes you’ve made actually contributed to A/B testing results.
This is also why having tracking in place and testing one variable at a time is important for your A/B testing set up. Double counting/missed conversion tracking could skew the testing results of your A/B test. The more variants you have running at once, the more traffic is divided between variants, and the more time it would take for an A/B test to produce significant testing results.
Step 7. Analyzing your A/B testing results
Once you’ve waited an appropriate amount of time for your A/B test to reach statistical significance you could analyze the testing results by using a basic statistical significance calculator (you can google “statistical significance calculator” to find a really basic one).
Then you take the metrics from both variants and plug them into the calculator. Typically, if I see a test that doesn’t reach at least 90% statistical significance then I either have to run it longer or the change made to the “challenger” variant isn’t big enough to impact performance (in which case, you may want to think about initiating a new version that can move the needle a little further for you).
Once you plug in the numbers from your different versions of your variant test the calculator gives you a confidence level. I typically aim for a confidence level of 95% or higher before concluding any significant results.
Step 8. Connecting A/B test results back to your goal
Once you’ve identified whether or not your A/B test produced a positive result or negative result, you can make a change based on that. A majority of the time my A/B testing challenger, if researched properly with the A/B testing tools I outlined above, will become the winning variation.
After that, I’m able to run tests based on the findings from my previous A/B tests.
From there, you can start a new test based on the result of the previous test.
Did your ad copy perform better than your previous ad copy? Mine did. So I applied the same location-based ad customization to the landing page copy in hopes to improve the conversion rate and CTR.
Did your CTA button perform better than your previous CTA button? If it did, you could apply the same type of messaging as an A/B test for the Google ad headlines within your campaigns.
A/B testing should always be an iterative process.
Here at KlientBoost, we’re always asked to find the “next big needle mover”, and A/B testing allows us not only to think of creative ways to test but also to draw conclusions from those tests backed by data we collect.
We do this with all of our clients and it’s produced amazing results.
If you’ve read this far you should have a better understanding of how A/B testing works and how you could do it effectively to improve performance and your bottom line.
The data you collect from iterating on your A/B tests over and over again can be applied to other marketing channels for your business to produce similar results.


