


There it is in Google Analytics: bounce rate.
You’re pretty sure you know what that is—but how sure are you?
And why should you give a flying fig about it? And what’s the blurry lens around bounce rate that makes this meaningful metric so misunderstood?
- What is Bounce Rate in Google Analytics?
- Why You Should Give a Flying Fig about Bounce Rate
- How Does Google Analytics Calculate Bounce Rate?
- You Get to Say What Counts as a Bounce
- What Impacts the Bounce Rate Metric?
- The Difference Between Bounce Rate And Exit Rate
- What Bounce Rate Says About Your Marketing Plan
- Why You Should Analyze PPC Bounce Rates Differently From Other Traffic Sources
- Three Reasons For an Oddly Low Bounce Rate
- How to Lower Google Analytics Bounce Rate—Yeehaw! (Finally)
- Bounce Rate FAQs
- Bounce Rate Google Analytics Summary
Get brand new analytics strategies straight to your inbox. 23,739 people already are!
What is Bounce Rate in Google Analytics?
A “bounce” describes a customer who hits your page (like a ball) and bounces off (clicks away) after a few seconds like this:
I’m here!—I’m looking around—I do/don’t see what I came for—I’m leaving now.
Wait! Don’t go!
Ideally, you want that ball to stick like it’s a tennis ball and your page is made of velcro.
Your goal is to get your bounce rate as low as you can because bounce is a measure of engagement—specifically lack of engagement. A high bounce rate could mean low engagement.
If engagement is the name of the game (and it is!), low engagement might mean your fans aren’t cheering loudly in the stands. Maybe your starting lineup is warming the bench and your third string is out there playing like crap. Maybe your team is too small, or the fans are distracted, or the playing field needs some maintenance.
It’s your job to figure that out.
A high bounce rate could mean that users don’t like your page. It could also mean that there’s a mismatch between your fans’ expectations and the experience you give them. But a high bounce rate could be a good thing depending on a few different variables (your industry and page type, for example).
So know this as we get started: bounce rate is relative.
It might look high, but it’s not. It might look “fine,” but it’s actually running around with its pants on fire screaming at you because there’s an urgent problem to fix.
Let’s walk through some scenarios that show you how to interpret bounce rate so you set your line properly.
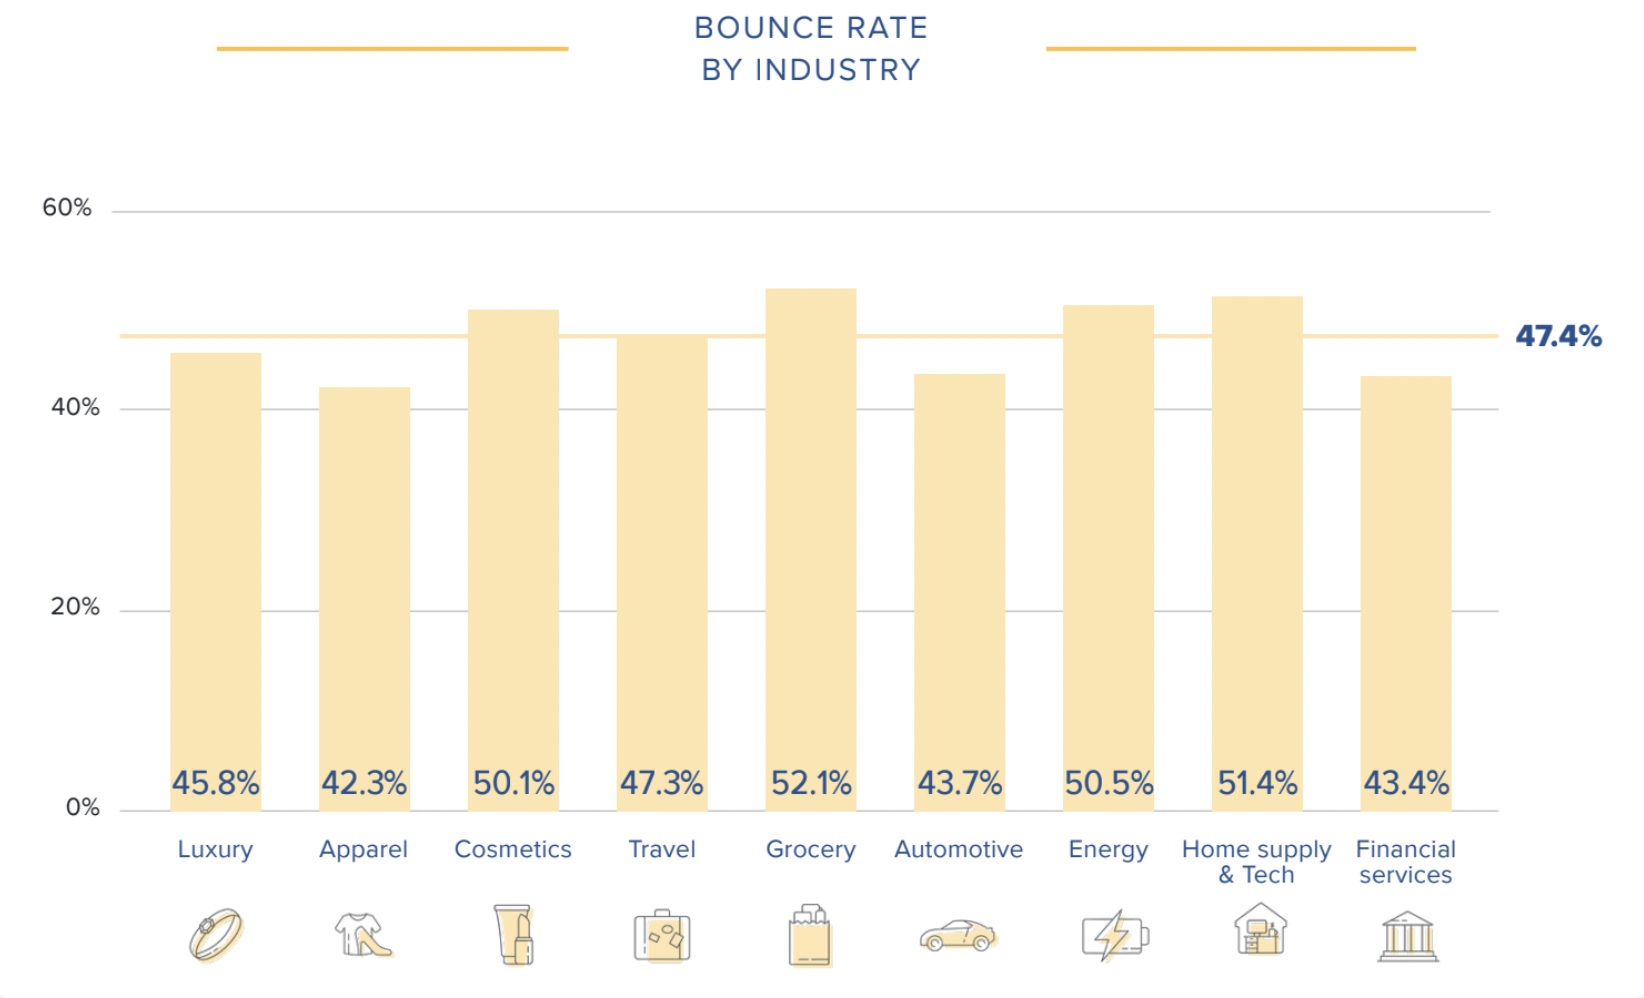
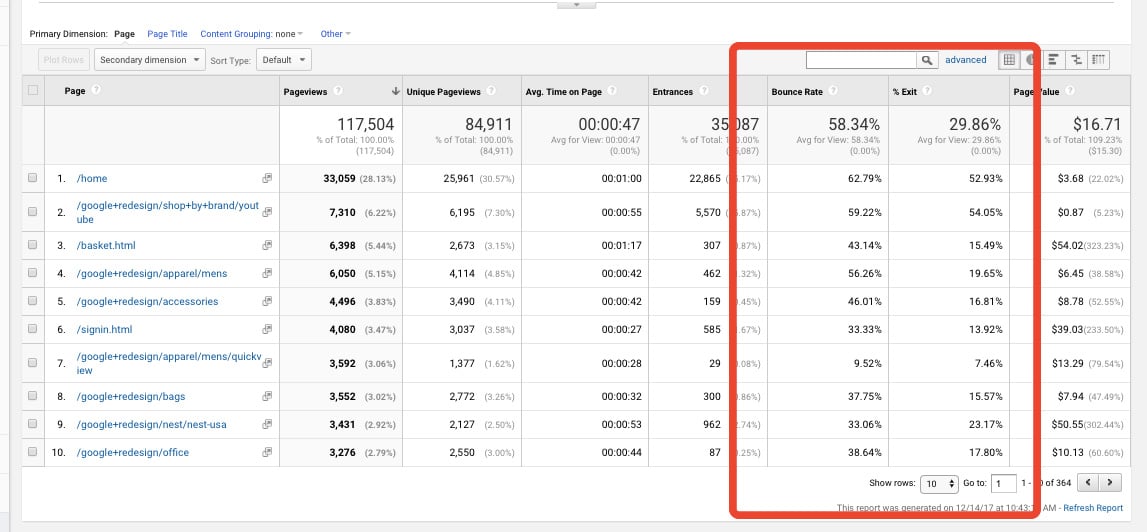
To calm feelings of anxiety before we dive in, you should know that even the best websites score a bounce rate of 1 out of 2 (and bounce rate is higher for B2B sites than for B2C sites).
An average bounce rate falls somewhere between 26% to 40%. Does your bounce rate land in this range? If so, that’s excellent (but keep reading).
If your bounce rate lands in the 41% and 55% bracket, that’s considered average. Start to pay attention if you achieve a bounce score of 56% to 70%. Pay closer attention if your bounce rate is 70% or higher—unless your website is blog or news-based, in which case, that bounce rate score makes sense, and you need not worry too much about it.
Why You Should Give a Flying Fig about Bounce Rate
A high bounce rate doesn’t feel so great.
But don’t let this bummer benchmark release bleak butterflies because, the truth is, that number’s got your back.
Bounce Rate Tells You What Visitors are Doing
You wouldn’t know that visitors aren’t sticking around without the bounce rate metric. It throws a flag that kicks off your journey to figure out why. Get to the bottom of bounce and you might notice your conversions go up as bounce rate comes down if, for example, you add a progression trigger on every page that leads each visitor somewhere else on your site.
Maybe your blog pages didn’t do anything but offer incredibly beneficial information and your bounce rate was at 85% (not an outlandish bounce rate for a blog page). But then you added a lead magnet (a content upgrade perhaps), and the bounce rate drops to 75%—yeehaw honey. That’s great! It doesn’t look fantastic, but it is.
Or you might discover that a high bounce rate means you’re serving up content right away and your visitors appreciate that. They leave (bounce), but they’re thankful. You’re growing a fan base of loyal followers. But bounce rate doesn’t show that.
Bounce rate might indicate your information is solid
Bounce rate doesn’t affect your rank on Search Engine Results Pages (SERPs) like Google and Bing, which is why some marketers don’t pay much attention to it. Nor does bounce rate tell you how long someone stayed on your page (dwell time).
Bounce rate only tells you that someone came, saw, and left without looking at any other pages on your site apart from the page they landed on. But it doesn’t tell you if those visitors left happy or frustrated.
You might have a brilliant page that looks great and draws attention immediately to where the visitor (who clicked through to find something specific) happily finds what they came for and leaves completely satisfied.
Google adds that behavior to your bounce count.
In this case, good job for the high bounce rate, muchacho, because you’re helping people with questions find the answer without making them hunt for it—no need to spend time optimizing your page to bring down the bounce rate KPI. You just figured out it’s okay.
Although it wouldn’t hurt to provide that logical next step to encourage further on-site exploration.
How Does Google Analytics Calculate Bounce Rate?
If you ask someone to define bounce rate, you’ll get a response that sounds something like this: Bounce rate is the percentage of visitors who leave your site after viewing one single page.
Hermmm... That sounds bad. Is that bad?
What if you only have one page?
Does that mean your bounce rate will soar at a steady 100%? Will Google ding your bounce rate dinger whenever someone leaves your one-page site (even if they found exactly what they came for and left feeling fantastic)?
Unfair.
Let’s look at bounce rate mathematically. Google defines bounce rate like this:
Bounce rate is single-page sessions divided by all sessions, or the percentage of all sessions on your site in which users viewed only a single page and triggered only a single request to the Analytics server.
That last line deserves a little more attention: triggering a single request to the Analytics server.
You should add a Google Analytics tracking ID to every page on your website. That way, when someone visits one of your pages, the GA tracking code fires and triggers a session. Clicking from one page to another triggers an event and the code fires again (GA records a non-bounce). But leaving without triggering that second code causes the session to expire. Expired sessions are bounces.
But there are a few wrenches that skew this process:
Slow page load
If your page loads slowly, a visitor might bounce before the trigger has a chance to fire.
Session expiration
Sessions might expire even though the user plans to engage with the website “in a bit.” Say, right after lunch.
Ad blockers
Ad blockers may prevent a code from firing—these visitors interact (or not) in the dark, unseen by GA.
And if you bungle your tracking code setup, you could botch the trigger; it won’t fire.
But let’s assume these things happen only a small percentage of the time and get back to the mathematical nuts and bolts of bounce rate:
Bounce rate = single session / total sessions
Rb = (Ss/St)*100
That’s an excellent definition for all the right-brained people out there. But math isn’t everybody’s favorite.
Let’s walk through an example for all the left-brained creatives out there.
Say ten people visited your site on Monday:
- Seven visitors checked out your home page.
- Two visitors checked out a blog article from a Google search.
- One visitor checked out a landing page that promoted your eBook.
Homepage visitors:
Of the seven visitors, five scroll your page, don’t find what they hoped they’d find and click away. Google records five bounces. Poopsicles.
But two of the seven visitors click a link on your homepage that takes them somewhere else on your website. Google calls those clicks “interactions” and records no bounce. Yass!
Blog page visitors:
Both visitors read your blog article. One quickly skims the content, finds the golden nugget they were looking for immediately—good job!—and clicks away with a triumphant feeling of euphoria.
The other blog reader dives deep and reads every single word all the way to the end, forming an opinion that this was the best blog article ever written. They are filled with gratitude and blast feelings of unbound appreciation into their screen at you. They close their browser inspired and energized.
Google records both of these as bounces.
WTF?
eBook landing page visitor:
This visitor googled the topic of your eBook and clicked your URL because it appeared on page one and your title and meta description were amazing—right on! They hop to your landing page and see your splashy 15-second video you put there right at the top. The visitor hits “play” (an interaction event), likes what they see and hear, and decides to add their email to your awesome-looking form to download the eBook. Mission accomplished. They click over to their email tab.
The two blog page readers and the one eBook downloader all count as single-page sessions—they each checked out one page before leaving.
The blog readers created a bounce session. The eBook downloader didn’t.
Why is that?
It’s related to how you define a bounce in Google Analytics.
You Get to Say What Counts as a Bounce
How you track events affects your bounce rate.
There are two types of events:
- interactive
- non-interactive
The good news: You get to say what events (the things people do on your page) count as interactive. In other words, you get to tell Google what things don’t count as a bounce. Yippee!
But don’t go overboard.
Don’t identify everything as an interactive event just to watch your bounce rate plummet. If you do that, you deflate the power of the bounce rate metric. You don’t want to do that (even if it calms your anxiety).
Remember, bounce rate is there for a reason: to make sure you deliver value to your audience. If you don’t care about that, you can stop reading right now.
The name of the game is engagement.
We set up bounce rate correctly to measure engagement properly. And we pay attention to how well we engage visitors to engage better if we’re not hitting the mark.
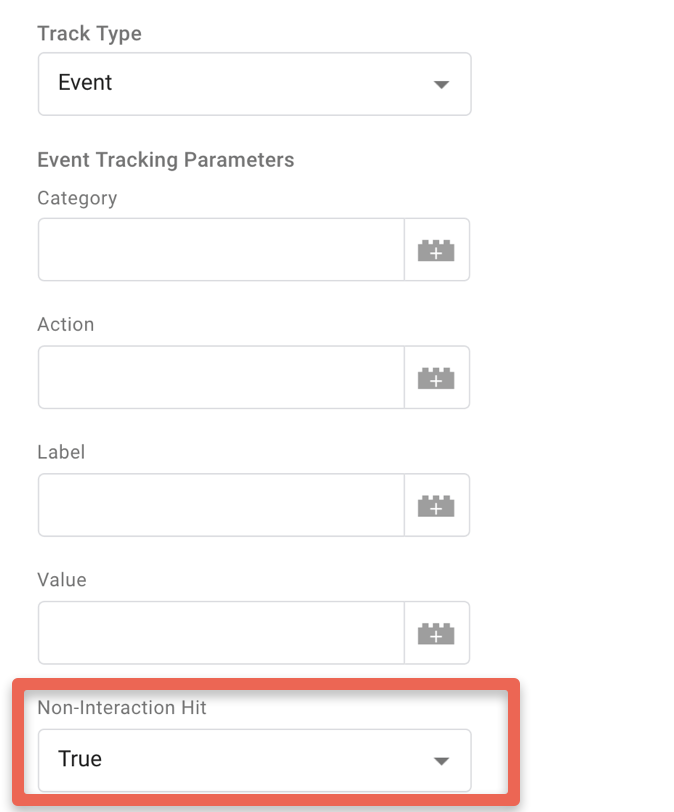
Here are reasonable interaction events you can remove from the bounce rate (by changing the non-interaction event tracking parameters to false and adding your UA tracking ID).
If a user:
- clicks play to watch a video
- clicks an action button
- fills out a form to download something
- spends X amount of time on a page
- scrolls at least ⅔ of the way down the page (scroll depth threshold)
How to set up event tracking: interactions and non-interactions
Google Analytics registers an interaction event as an engagement hit. Engagement hits lower your overall bounce rate. That’s why it’s essential to tell Google what you consider an interaction event so engagement is accurately measured and your bounce rate reflects that.
Example 1: Downloading the MyFitnessPal fitness app
You go to the MyFitnessPal homepage, scroll down to the food database—cool! You’ll come back to that later—read some testimonials, and take note of all of the other apps that integrate with MyFitnessPal.

You’re clearly interested and interacting with the website.
But event tracking wasn’t set up in Google Analytics for any of those interactions, so the MyFitnessPal analytics team won’t see that you’re interested. They’ll only know that you bounced.
If we use Google Analytics Debugger, a handy tool for auditing your analytics, we can see how your behavior only triggered a pageview (and one “view ad” event at the very bottom of the page.)

Another example: Snowboard shopping
You’re looking for a new snowboard. Burton is a household name, so you go to burton.com. Two events fire consecutively:
- The hero section has a 4-slide carousel. You click through it because the imagery is impressive. This is a non-interaction event according to Google Analytics bounce rate out-of-the-box.

- As soon as you start to scroll down, you’re hit with a pop-up. You ex out of it. That triggers an interaction event. So even if that pop-up made you grumpy and you leave right after dismissing it, your visit is not a bounce.
It all depends on how you’ve defined what a bounce is in your account.
Burton set up an Interaction event, so your session is not counted as a bounce.
In the Burton example, setting a pop-up exit as an interaction event is called an “adjusted bounce rate.” It’s not typical. You’re defining bounce rate differently than Google Analytics does out of the box.
Good practice interaction tracking
To make bounce rate meaningful, you should set up an interaction event after a user has spent a certain amount of time on your site (1-2 minutes is a good place to start).
Mailshake uses their “demo” video to indicate user engagement (an interaction event). As soon as you click the play button on the video, an interaction event fires. You are decidedly engaged and counted as a non-bounce session:
What Impacts the Bounce Rate Metric?
You know that a high bounce rate isn’t always bad, and a low bounce rate could be really bad. Figuring that out means looking at your page in conjunction with your traffic:
- Why does a visitor come to your site? (user intent)
- What type of webpage is it?
- What is the webpage quality?
- Traffic quality?
- Type of Marketing Channel
- Visitor Type
- Device Type
Why does a visitor come to your site?
You want your website or landing page to match the visitor’s search query intent as much as possible. If the information on your page doesn't match what a visitor came there looking for (an intent discrepancy), the odds of them clicking away go up; they came for something, but it’s not there. If a visitor jumps to your site after clicking on a display ad or search ad, make sure your ads match the information on your landing page.
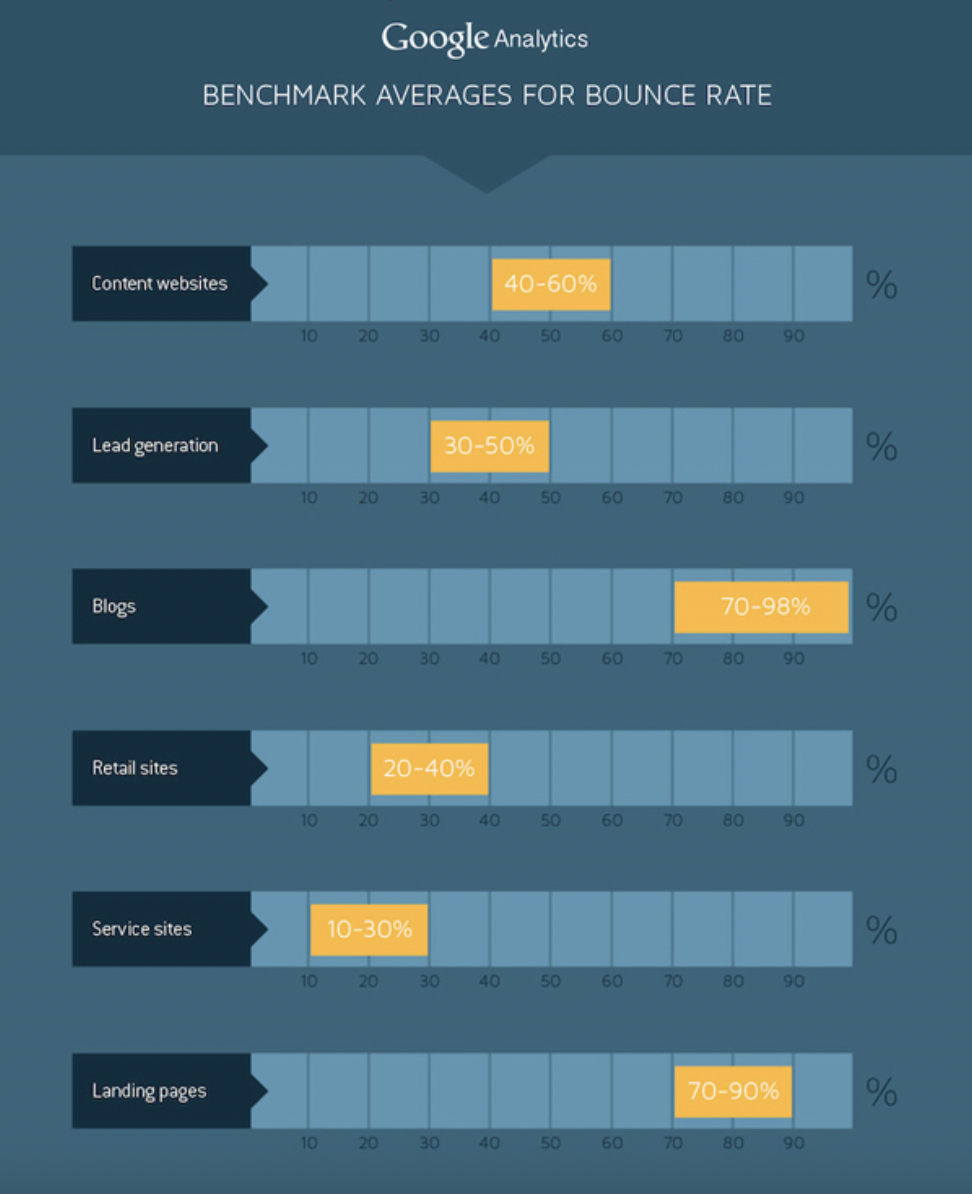
Type of Webpage
Different types of websites have different purposes. Each has a different bounce rate. The bounce rate of a blog page is relatively high (70-90%) for the simple reason that, after a visitor has finished reading, they’ve completed their intent. A blog page isn’t meant to send visitors throughout the website. There’s no further reason for the reader to stay. So they go. No worries! You hope you’ve given them valuable information and that they’ll come back to read more of your blog articles, bounce rate high or not.
Tracking bounce rate for a landing page, on the other hand, is more meaningful. You invest resources to get people to a landing page to fill out a form. You don’t want them to leave before interacting the way you intend them to. If your page is optimized so that people feel comfortable filling out the form, then the bounce rate should be lower (about 40-60%) because clicking the submit button completes an interaction.
If someone visits the “contact us” page on a website and decides to call the phone number instead of filling out the contact form, expect the bounce rate to be higher.
It’s okay if the bounce rate looks high as long as you know why it’s high (and it’s not because something is broken).
Webpage Quality
As an obvious point, ugly sites don’t engage like well-designed sites do. User interface (UI) closely ties to user experience (UX). Too much text, not enough whitespace, a clash of colors or fonts, or too many CTA buttons are UX deal-breakers that brew overwhelm. Overwhelm smacks visitors in the face. Face-smacked visitors click away with anxiety chasing after them.
Apply the fundamental laws of UX to your website to lower bounce rates:
- Remove clutter (minimal design)—including ads
- Simplify copywriting to keep your message clear; keep sentences short and minimize fancy words and industry jargon.
- Use bullet points
- Get your hierarchies right—main title (H1), subheadings (H2 through H6), paragraphs (p)
- Limit choice (one CTA button per page)
- Use clean images and short videos to engage
- Add padding between elements (white space)
- Optimize for page speed to lower bounce rates.
- Offer live chat
- A/B split test and see how users interact with both versions
Traffic Quality
If you haven’t optimized for the right target audience, your bounce rate will be relatively high. Identify who your best customers are. What do your customers want most from you? What are their demographics (age, gender, location)? What’s their belief system (opinions/attitude)? Where do they get their information? Where do they hang out? Reach them where they are on their preferred channels. Entice that narrowed-down group to your site. When they get there, they’ll feel like they’re in the right place because you’re speaking directly to them. That lowers bounce rates.
Type Of Marketing Channel
Different channels have different bounce rates since the intent is different. You can segment by acquisition to see where your traffic is coming from and which channel has the lowest/highest bounce rates. Do you see a trend? Do your ad campaigns have a high bounce rate? Maybe your ad target is too broad. Or maybe your landing page doesn’t give ad clickers what they thought they would get when they land on your landing page? Organic searches will most likely have a higher bounce rate than social media traffic.
Visitor Type
Returning visitors will have lower bounce rates than new web page visitors. If a visitor returns, they land there already familiar with the content (page matches user intent)—they chose to go back to your site. But new visitors don’t know if your site contains the information they’re after or not. Some will find what they’re looking for, others won’t. That’s how the ball rolls. And sometimes the ball bounces.
Segment bounce rate by visitor (Audience > Behavior > New vs. Returning) and see where the bounce rate is higher.
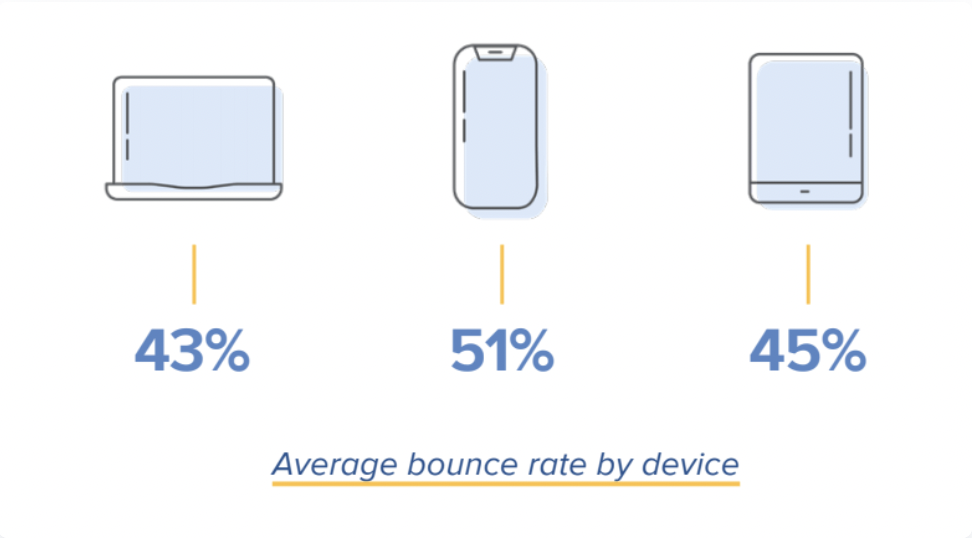
Device Type
If a page is not mobile-friendly, bounce rate could be high. Segment your bounce rate in Google Analytics by device (Audience > mobile > overview) and see if bounce is higher on mobile.
You can see how iOS bounce rates compare to Android devices. You can even drill down to smartphone models. If you see that your bounce rate is similar across iOS and Android, but the bounce rates of new models are higher, that points to compatibility. Perhaps you haven’t updated your theme recently, or your theme hasn’t adjusted for the new models’ parameters. Until that update happens, mobile page display could be off and the UX will suffer, causing higher bounces on certain mobile devices.
The Difference Between Bounce Rate And Exit Rate
Let's clear up a point of confusion: Every bounce is an exit, but not every exit is a bounce.
These two metrics are sometimes used interchangeably, but they describe different behavior.
- Bounce Rate: the percentage of single-engagement sessions
- Exit Rate: the percentage of exits from a page
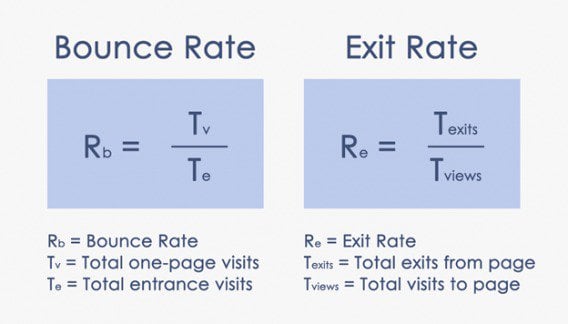
In other words, exit rate measures how often a user leaves your website from a particular page. It is the percentage of exits from that page (the last page in a session) compared to the total number of page views.
Users might not land on the page from where they eventually exit. They may land on one page, click through to another page, and then click away from there.
Bounce rate measures the percentage of exit sessions that happen from the starting page. How many visitors clicked away from that first page without going anywhere else on your website? When visitors land on a page and call it a day (exit from that starting page), that’s a bounce.
Google Analytics puts these metrics next to each other on lots of reports, so it helps to keep that in mind.
Tracking User Behavior & Exit Rates
Pretend your website has this user behavior:
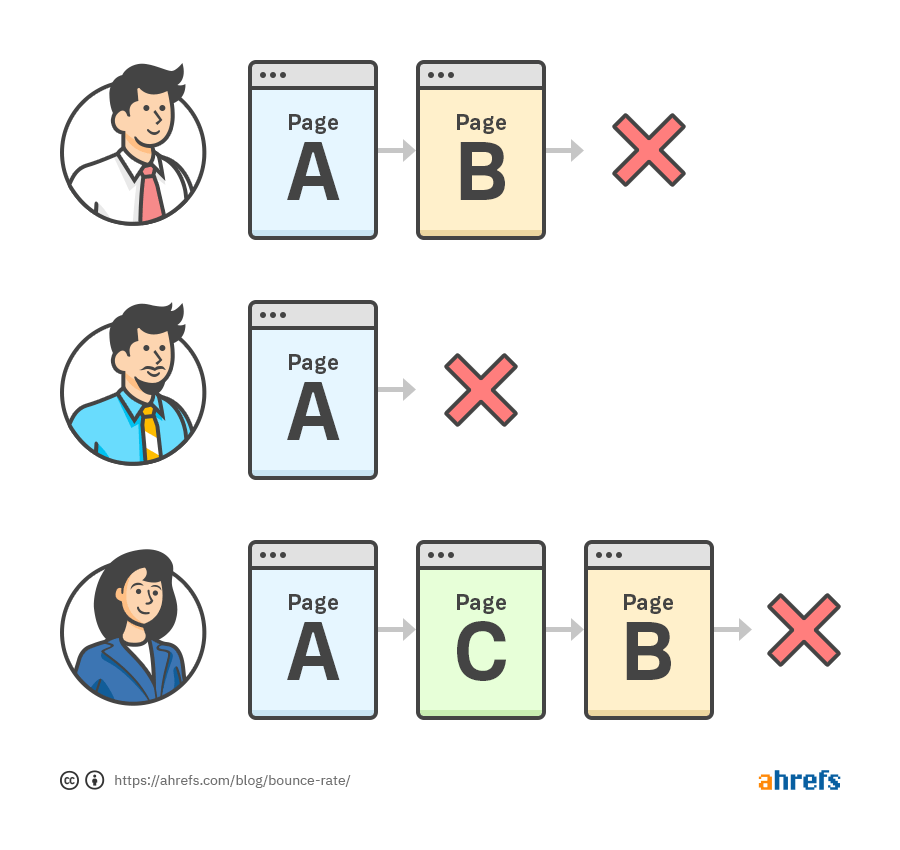
Page A:
- All sessions start on page A.
- The bounce rate is 33% (1 out of 3 users land on page A and bounce from page A)
- The exit rate is 33% (1 out of 3 users left the site from page A)
Page B:
- B has a bounce rate of 0% because no users started on page B
- The exit rate is 100% because no users went to any other pages after landing on page B. Both users who visited Page B left the website after checking out Page B.
Page C:
- C has a bounce rate of 0% because no session started on Page C.
- The exit rate for page C = 0% because none of the three visitors exited the site from page C
What Bounce Rate Says About Your Marketing Plan
What’s a good benchmark to aim for?
This question gets a lot of airtime because no one wants to lag behind the competition, not even with a metric like bounce rate.
As a generally accepted rule of thumb, here are the average bounce rates for specific types of sites:
If I were you, I’d ignore those benchmark averages and stop looking up average bounce rates.
You already know that bounce rate isn’t a universal point of truth. It’s complex, relative, and it varies for a given website’s traffic, as well as the context of a given page within that website.
Go to Google Analytics right now.
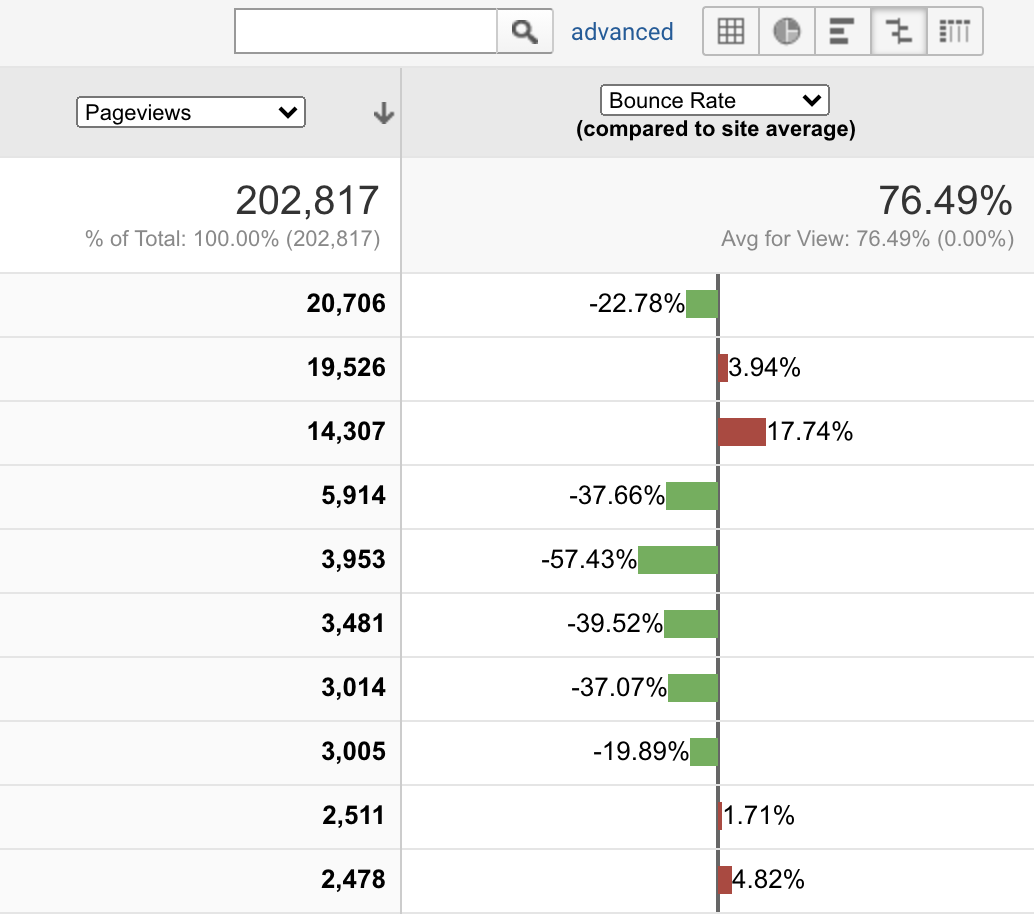
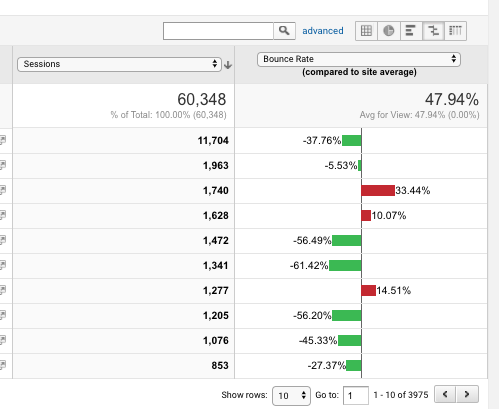
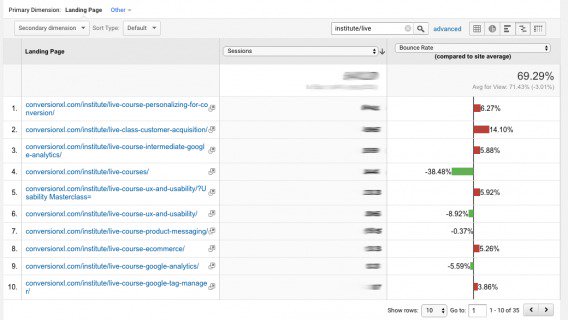
Drill down: Behavior > Site Content > Landing Pages.
Order them by bounce rate using the comparison feature on the upper right corner. The variance is striking even within one site:
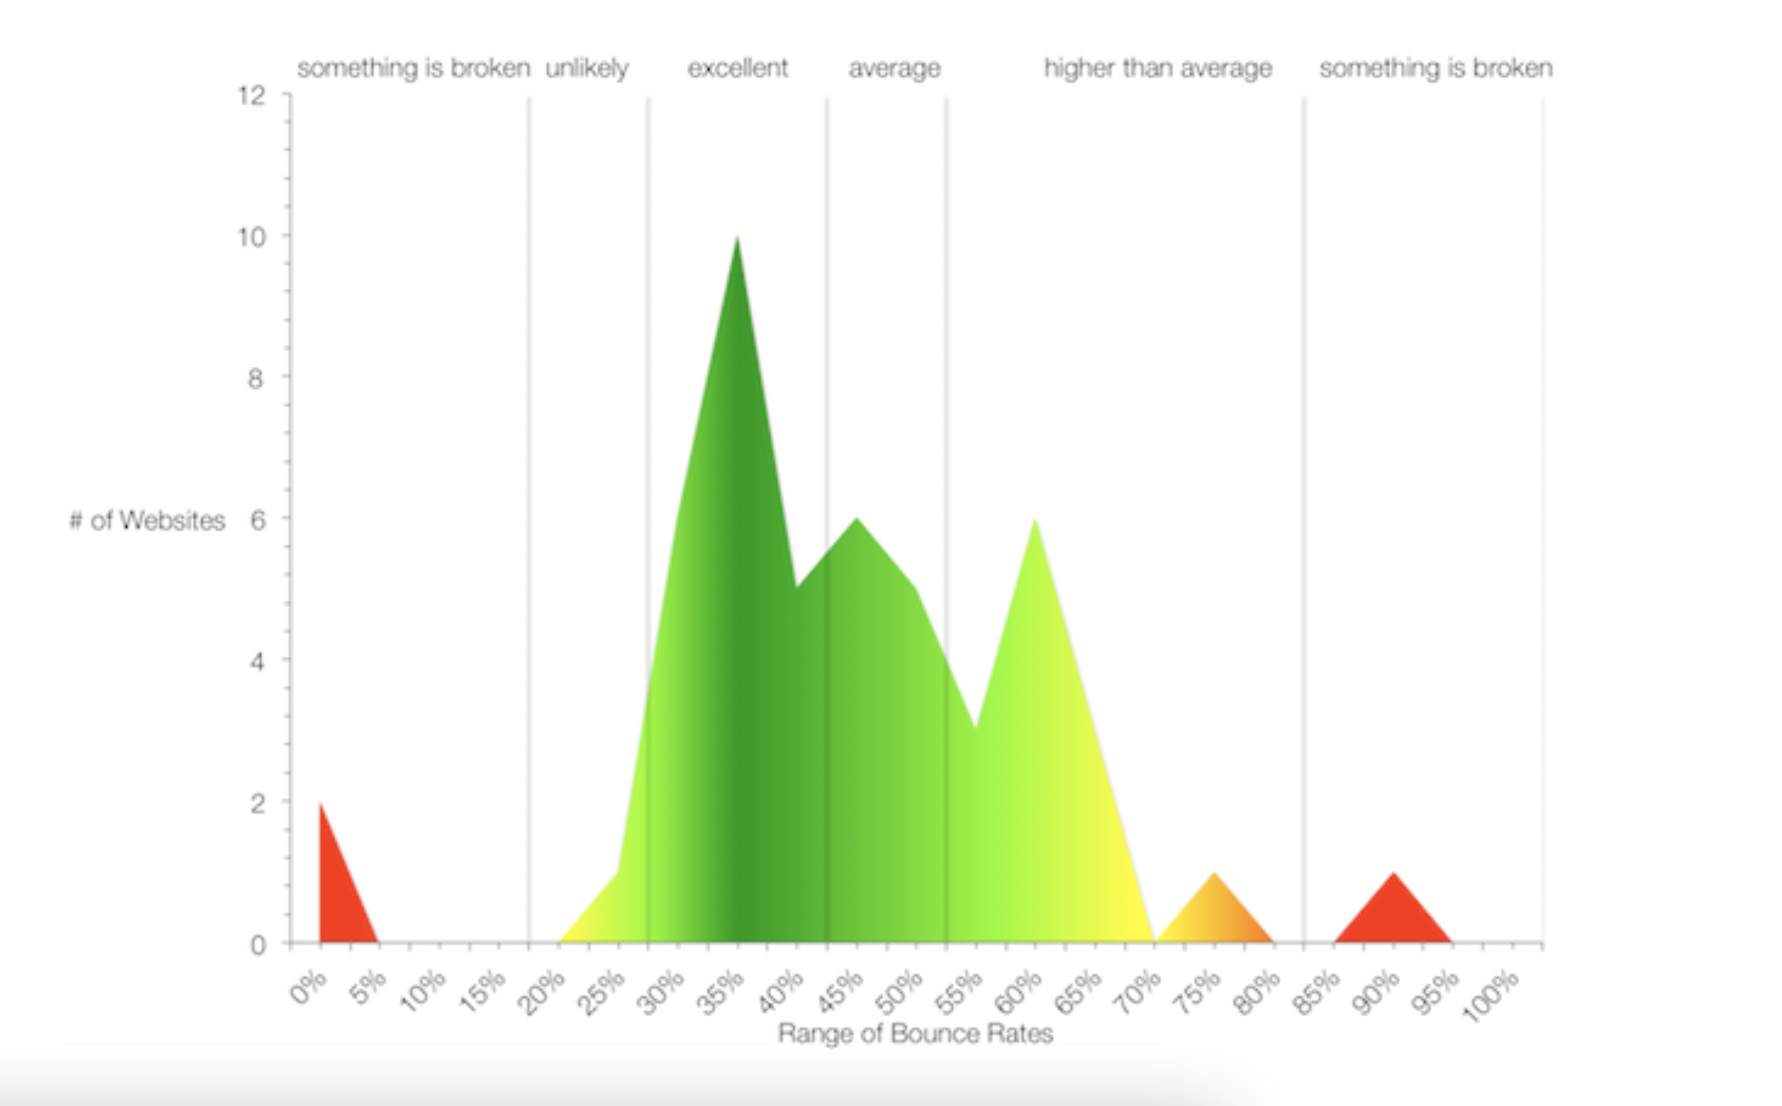
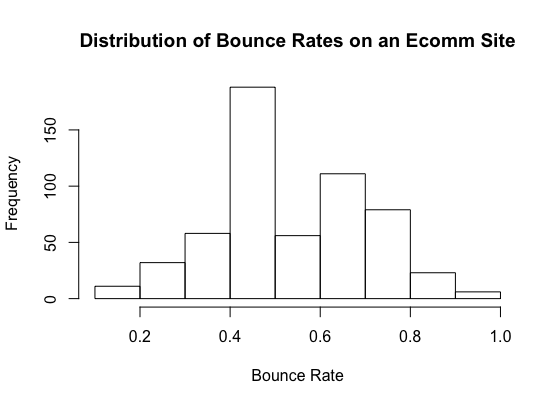
I exported this as a CSV file (excluding all of the pages at 100%) to make a rate/frequency histogram. There’s a lot of different bounce rates here. If you’re curious, the mean bounce rate of this dataset is 55.52%:
So Does Bounce Rate Matter?
To say that your website’s aggregate bounce rate has no value is… a broad statement. There’s a lot of truth hidden in that average. But specific truths are better.
Specificity requires some work using filters and segments to isolate a sharper, more meaningful bounce rate view. The graphs above show that there are different bounce rates across the site—but we don’t know the purpose of any of the pages, how many visits the pages get, or what the traffic sources are.
So, industry averages probably aren’t going to do you much good unless you know the quality of traffic, the variance and seasonality of data, and the distribution of the rest of the pages.
Instead, look at pages with a similar context within your own website and measure “good” and “bad” bounce rates from there. It’s easier to look at those numbers because they are in a context you understand and, to some extent, control.
Bounce Rate Matters, But It Isn’t Definitive
Sometimes a bounce is ambiguous no matter how you define it. It’s not clear whether a bounce is good or bad all the time.
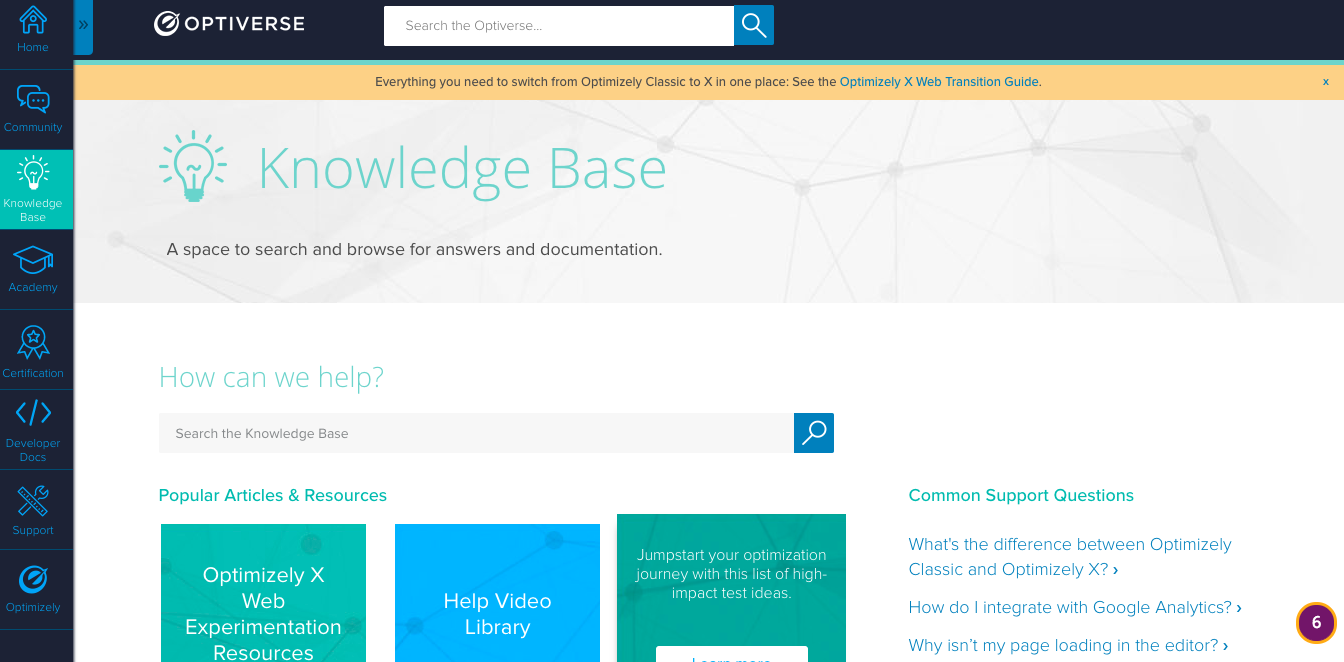
It’s common to use bounce rate and time-on-site together to gauge the effectiveness of knowledge base articles (and other content pages).
Users bounce from a knowledge base article because
- they’ve found their answer and are ready to get back to their life (happily)
- they tried to follow the instructions but were confused, so they left (frustrated)—to look at your competitor’s article
- they fell asleep while working from home and let their session timeout
Hard to tell.
Engagement & Success Metrics
Optimizely looks at engagement metrics and success metrics, using attitudinal indicators and customer feedback to see if their educational content succeeds at its purpose.
While a bounce records the same—no matter what— by your analytics tool, it could be triggered by a variety of user interactions, including:
- Returning to search results, because you didn’t find what you were looking for
- Closing the browser because you’re cleaning your Mac
- Entering a new URL in the address bar
- Following an outbound link from your blog post
- Staying inactive and timing out the session
- Reading the whole blog post and then leaving, fully satisfied with the content you read.
That’s what I mean when I say that a bounce isn’t inherently good or bad in any one circumstance. Context matters. A lot.
Bounce rate is a proxy metric anyway. It’s better if you can optimize for metrics closer to business results—like user experience.
Why You Should Analyze PPC Bounce Rates Differently From Other Traffic Sources
How you treat bounce rate depends on your traffic source.
If a blog post gets a lot of organic traffic but has a high bounce rate, that’s a different story than running Google Ads that get high bounce rates.
If you go viral on Hacker News and chart a high bounce rate, that’s different than targeting a niche audience via Facebook ads.
If you run a linear regression on bounce rates and conversion rates, there’s pretty much zero correlation. Even if there was, you have to keep things in context and think about user intent at different stages.
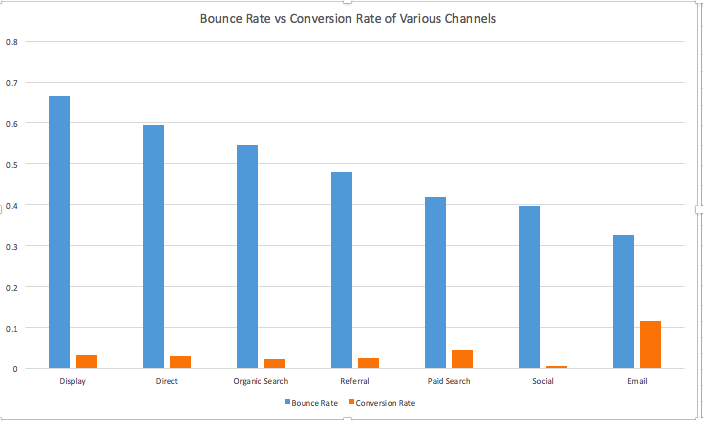
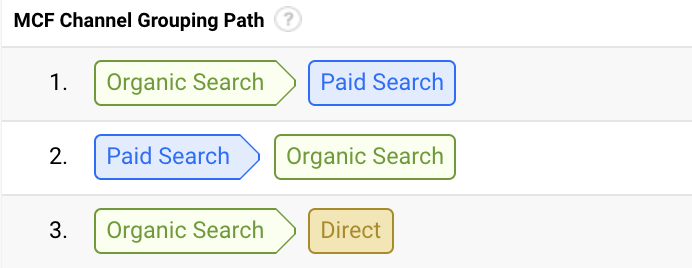
PPC Bounce Rates
In the image above, display ads have a higher bounce rate (but about the same conversion rate) compared to other channels. A high bounce rate here isn’t necessarily a bad thing, depending on how you’re spending your ad dollars.
A display interaction is often a user’s first touchpoint—and they may bounce from the immediate experience but come back again later to convert (making that display interaction successful...but not right then).
That’s why, if you’re spending money on online marketing and operating in various acquisition channels, you’ll need some basic attribution modeling to analyze your conversion paths.
Control Landing Page Traffic
Most paid acquisition marketers recommend you control your landing page traffic as much as possible. Ideally, use dedicated landing pages and don’t index them in search engines.
This way, you can exert more control over click intent and the temperature of your offer. You’ll know all traffic coming in for that landing page is paid and not a mix of paid and organic.
Sometimes, this isn’t possible. With eCommerce, for example, there aren’t usually separate paid acquisition product pages, so you’re going to get a mix of traffic sources.
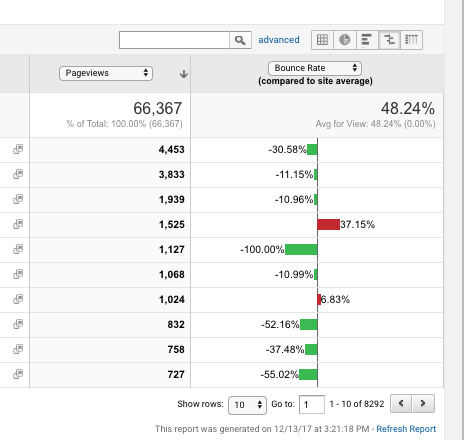
Keep traffic source and campaign in mind when you analyze landing pages and research any pages with low bounce rates. Go to Behavior > Site Content > Landing Pages, and view your report using the comparison feature. You’ll see something like this:
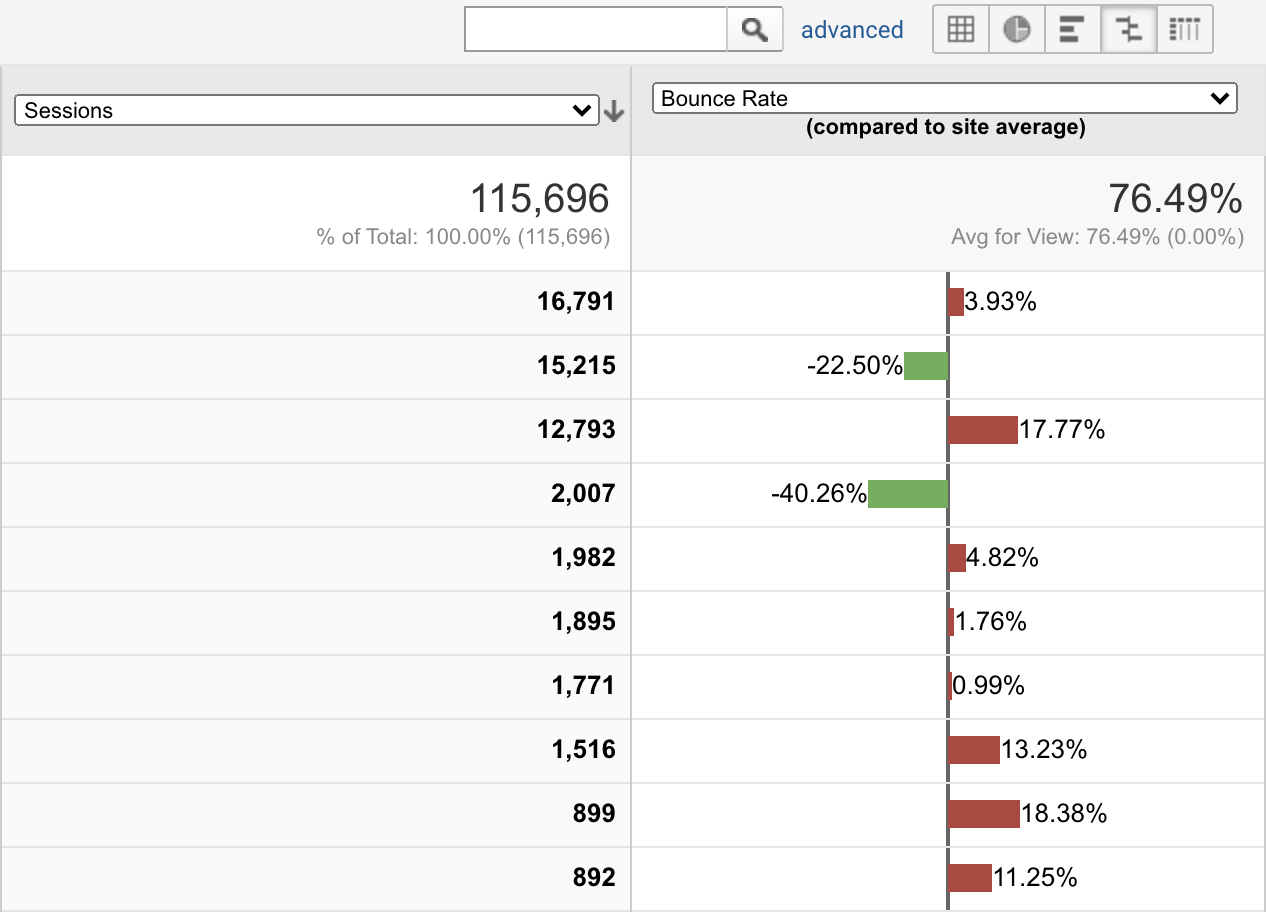
You’re looking for pages with a solid amount of traffic that have a high bounce rate. Google Analytics tells us here that number three on the list is a good candidate to look into (33% higher than average bounce rate).
Add A Secondary Dimension
Before you start changing your landing pages, go into Google Analytics, click the URL with the high bounce rate, and add a secondary dimension: Default Channel Grouping or Source/Medium. Then, view bounce rate by channel and see what’s up.
In the case above, the high bounce rate on that page was due to the page receiving almost all organic traffic, where the other pages got heavily paid traffic.
Remarketing Rules
With PPC, you can use bounces, exits, and shopping behavior segments as remarketing rules.
If you’re running a paid campaign to a landing page with multiple steps, you can target those who bounce right away differently than those who exit on page two, or those who complete the conversion (as well as those who trigger any event in between).
When you reframe bounces like this, they better align your marketing with the buyer’s journey.
If your PPC ads are bouncing at a pretty high rate (ads tend to get higher bounce rates than organic search traffic), maybe you haven’t set your negative keywords just right, and people who aren’t the best fit for what you sell are clicking on your ads. That’s a wasted click, and wasted clicks are expensive! Thank you, high bounce rate, for pointing that out.
Three Reasons For an Oddly Low Bounce Rate
We already talked about how you shouldn’t blindly pursue lowering your bounce rate for the sake of achieving a low bounce rate. On the flip side, sometimes you have low bounce rates naturally (lower than 20%). Only, there’s nothing natural about them.
Extremely low bounce rates mean there’s something wrong with your GA tracking settings. What are the most common reasons for this? Some are intentional. Some are accidental.
Double tagging
Whoopsy! There are two Google Analytics tracking codes, and each one sends a pageview. Two page views are the same as two interactions. And a bounce is recorded when there’s a single interaction. So if GA records two interactions, that means no bounce!
Only, the user did bounce. It just wasn’t recorded that way. If a page looks like it has the world’s lowest bounce rate, check your tracking code for duplicates.
Scroll tracking as an interaction
You might want to count a 100% scroll on a blog article as an interaction—the user read the entire article after all! That sounds reasonable. But is 20% of the article reasonable? What if a user scrolls 75% of the way down the page but that scroll was a quick 5-second skim to glance headers (after which the user decided they didn’t want to read it, so they left)? In that scenario, the session should count as a bounce. They didn’t do anything but scroll. They didn’t read 75% of the page—they only scrolled it.
It might be a bright idea to combine a scroll interaction with a timer trigger. Did they scroll 75% of the way down the page and it took some time to get down there? Then it’s an interaction (not counted as a bounce).
If you set a small-percentage scroll as an interaction event (not tied to time on page), this creates an artificially low bounce rate in Google Analytics—especially when the page height is short. The unmodified scroll trigger activates almost immediately because the visitor hits at 25% of the page height right away.
Events fire on initial page view
A virtual pageview might send right after a regular pageview—something technical might be wrong with the Universal Analytics event or pageview tag.
Or, in the case of eCommerce sites, an “e-commerce interaction” might be set improperly so it fires with a pageview. Maybe you count a product impression as an interaction? You don’t need to do that. A regular pageview tag already fires on a product page, so you don’t need to track the product impression as an interaction as well.
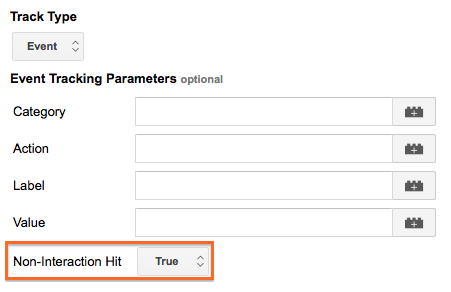
Go to Behavior > Site Content > All Pages and see which of the most-visited pages have the lowest bounce rate. Walk through it. When you identify the culprit, set that non-interaction hit value to true so you only track one event.
How to Lower Google Analytics Bounce Rate—Yeehaw! (Finally)
There are two ways to lower the bounce rate in Google Analytics:
- change how you define bounce rate
- change user behavior on your site.
We talked about fine-tuning Google Analytics event tracking with an adjusted bounce rate already. The second adjustment has more to do with user experience. You invite users to interact with your website in a different way.
Taking some time to map out meaningful user interactions will really get bounce rate working for you.
There is one tried and true tip used to lower a “high” bounce rate. And that’s making sure you add a logical next step for visitors on a page.
Tell them what to do next.
That might solve the problem. From one page, lead them somewhere else. Link a high-bounce blog post to another relevant page or offer a content upgrade using a form.
Mapping Out Meaningful Interactions
Think about what things users do on your site to signal engagement. It might be downloading a file, playing a video, scrolling most of the way to the bottom, or spending more than 3 minutes on your page.
In Google Analytics, create interaction events around these engagement actions to identify them (adjust your bounce rate). That’s the first way to tweak your bounce rate. The second way is to give the user a better experience on your page.
This is where you adjust your site to engage visitors a better way.
Austin Primary Care triggers an event when you click the “Book Online” button. An interactive form pops up where you choose your provider and your appointment time. Efficient!

Without an adjusted bounce rate (using Google’s out-of-the-box settings), a patient would easily fill out this pop-up form on the home page and leave. The user is happy because that was a quick and easy process (good UX). But your bounce rate won’t be as happy.
Here’s the thing: that’s a good trade-off here. Changing the form to be a multi-step process might hurt conversion (booking).
In other circumstances, providing a multi-step form could increase submissions. Sometimes people aren’t comfortable providing their contact information to get something. You can use multi-step forms to get them cozy with the idea of giving you that information in the middle or end of the conversion path. The result is the same (getting a user to submit a form), and the bounce rate looks better too. If you see that your form submission rates aren’t high, try using a multi-step form. But don’t make forms more complicated simply to reduce your bounce rate.
Multi-Step Forms
Chopping up single forms into multiple steps might encourage form completion. If that’s your objective, only ask for something simple like “first name.”
More people may fill out the form this way, but a similar number may drop off once asked to enter their phone number (regardless of whether that ask is on step 1 or step 3 of the form). Test it out with A/B split testing!
What works better? Go with that.
As a health provider, making appointment bookings easy is more important than bounce rate. Don’t change your form for bounce rate—that would be a mistake! Change your form for user experience.
Look At More Important Metrics First
Bounce rate is one metric of many. It’s there to nudge you toward better engagement. But it works best when you consider it relative to optimizing other business metrics.
Another way of putting it: bounce rate doesn’t function in a bowl; it works alongside other indicators. Since Google Analytics is an ongoing metrics conversation, not a set-it-once and you’re done sort of thing, you’ll be able to compare your bounce rate over time to understand if it’s where it should be or if it looks wonky.
Perhaps you’re using bounce rate as a proxy to find high-impact optimization opportunities. In that case, analyze pages that are
- high traffic
- similar in context and format
- engaging or converting on-page so they’re easy to measure.
Above, I talked about the CXL blog post example of clustering landing pages by topic. In this case, I opened a landing pages report (Behavior > Site Content > Landing Pages), and then filtered by URL.
Then, I used the “comparison” feature to look at bounce rates next to the site average. It’s clear which landing pages underperform. The benefit here is that the context and traffic acquisition for all the pages is similar:
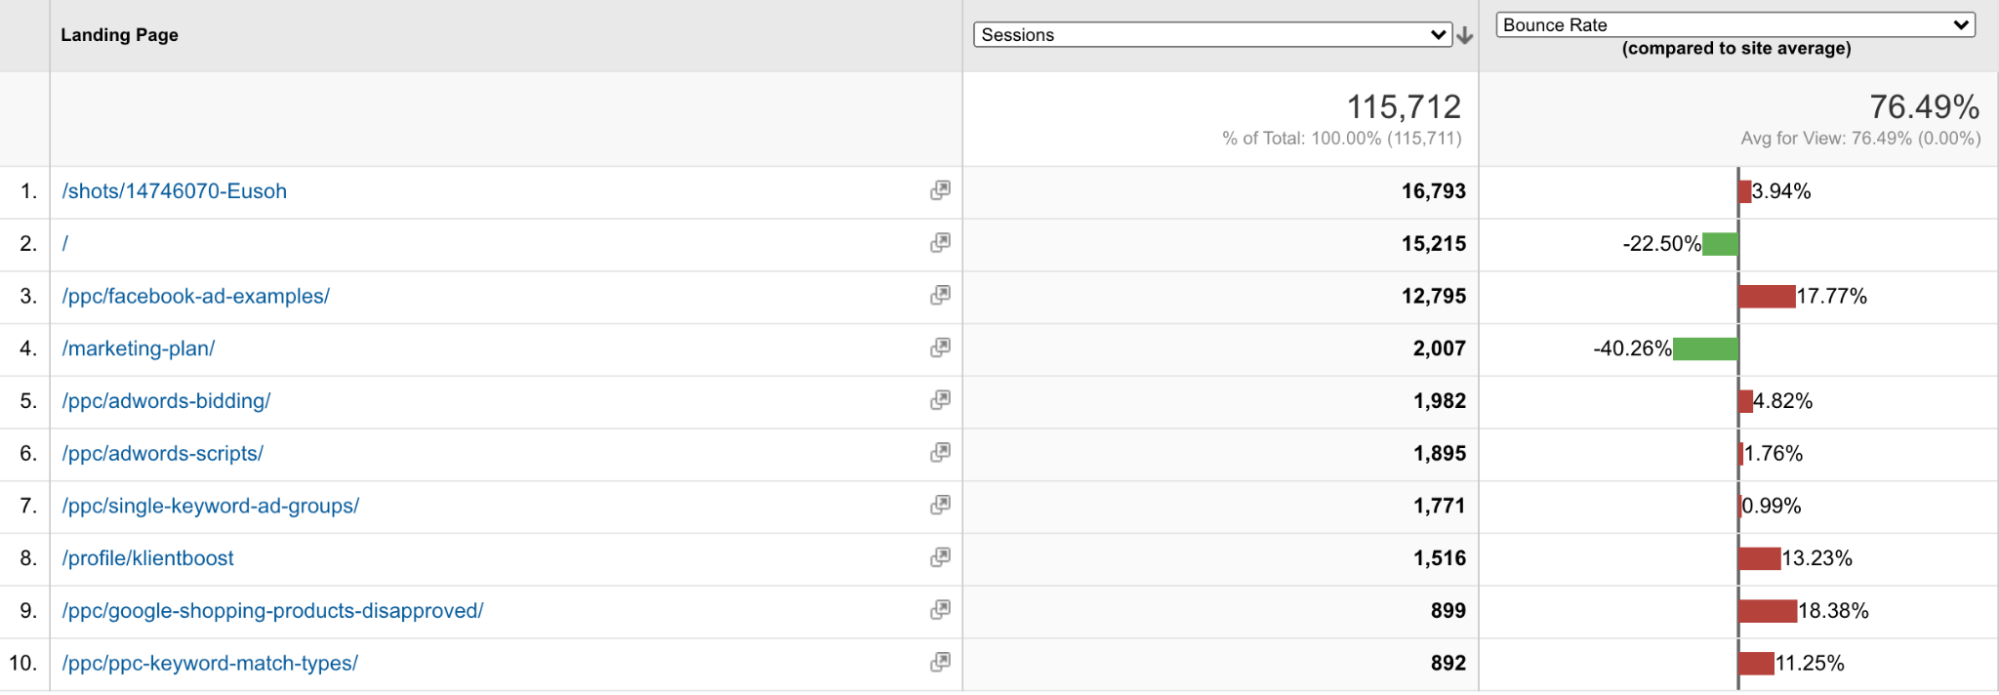
Once you determine landing pages with lower than average bounce rates, you can research why that may be.
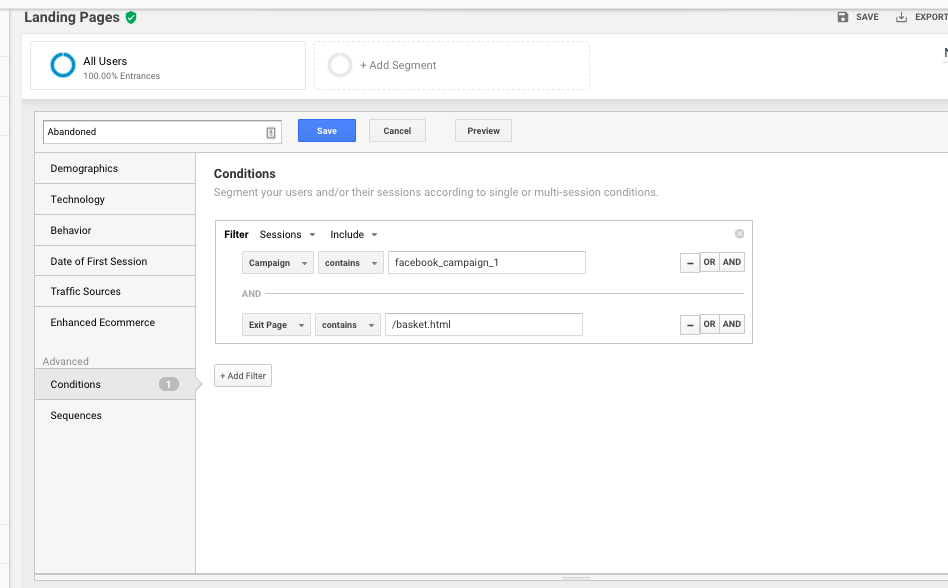
Reasons For Bounces
Maybe the traffic you’re bringing to the page with paid Facebook ads expects something completely different from what the page offers. Maybe there’s a bug that prevents Internet Explorer users—does anyone still use Explorer?—from converting on one of the pages.
People forget the different options available to optimize a landing page:
- tweak your targeting
- change ad messaging
- message match
- user experience
It’s up to you to dig in and try to solve those problems.
As you embark on conversion research, follow that with experimentation, analysis, and iteration (and continuous improvement, of course).
Bounce Rate FAQs
What’s considered a good bounce rate?
Broadly, 40%-60% for content pages (like a landing page or your homepage) is a “good” bounce rate.
But then you must immediately qualify that with relative things like page type, your industry, and how you’ve set up event tracking. View bounces in context. If your bounce rate is wildly outside of “a normal range,” look at load time, cluttered design, or tracking bugs. But if you’re sitting at an 80% bounce rate on your blog pages, shrug it off. That’s “good” for pages not optimized for anything else but single-page sessions—but that doesn’t mean you can’t add a CTA at the end to take that reader somewhere else!
What’s considered a bad bounce rate?
Under 20% or over 80%—ish. I guess.
Relative to the same criteria that mark a bounce rate as “good,” a bad bounce rate hovers above or swims below a generalized bracket based on page type, industry, traffic type (where visitors are coming from), user experience, and event tracking parameters.
There’s a wiry mess of relative considerations that complicate bounce rate calculations. That’s why this metric is loved by analysts who turn it inside out and on its head, then load it into an exhaustive powderkeg of insight most people can’t begin to understand without vodka. And that’s why the bounce rate metric is hated by those not intimate with the guts of GA.
Does bounce rate negatively impact my PPC?
No. Bounce rate doesn’t negatively impact PPC, but poor PPC might create a high bounce rate. So would forgetting to use negative keywords in your PPC ads.
Bounce rate points to problems like user experience issues or poor targeting. Poor targeting impacts your PPC. Your bounce rate might help you figure that out. In which case, bounce rate positively impacts your PPC efforts. If your keyword is too broad or has ambiguous intent, then a click to a landing page will result in a high bounce. Again, bounce rate here is helpful.
Does bounce rate negatively impact SEO?
Something of a backward question! Bounce rate doesn’t negatively impact SEO. But bounce rate does point out when your SEO efforts have little impact.
Does bounce rate affect google rankings?
Nope. The bounce rate has no bearing on your Google rank. Bounce rate is a metric that, though having no impact on where your page ranks, should direct your focus to where you need improvement. Improvements to UX or tweaking ad targets help your google rankings—and that high bounce rate that leads you to make those adjustments may positively affect your google ranking. Bounce rate might not be straightforward, but it does help you figure out where you need to improve.
Does bounce rate include scrolling?
Bounce rate measures single-page sessions. If a user doesn’t scroll, or scrolls quickly and doesn’t spend any time on your page (and doesn’t click anywhere else on your site), a non-interaction event is recorded (a bounce). In that way, bounce rate includes not scrolling. But you can set a scroll action as an interaction event so that scrolling a certain percentage down the page cancels out a bounce—because you’ve adjusted the bounce rate metric. It is good practice to add a timer trigger to a scroll event to ensure the scroll indicates value (positive interaction) for the user.
Neil Patel’s bounce rate infographic: https://neilpatel.com/wp-content/uploads/2010/11/bounce-rate-sm.png
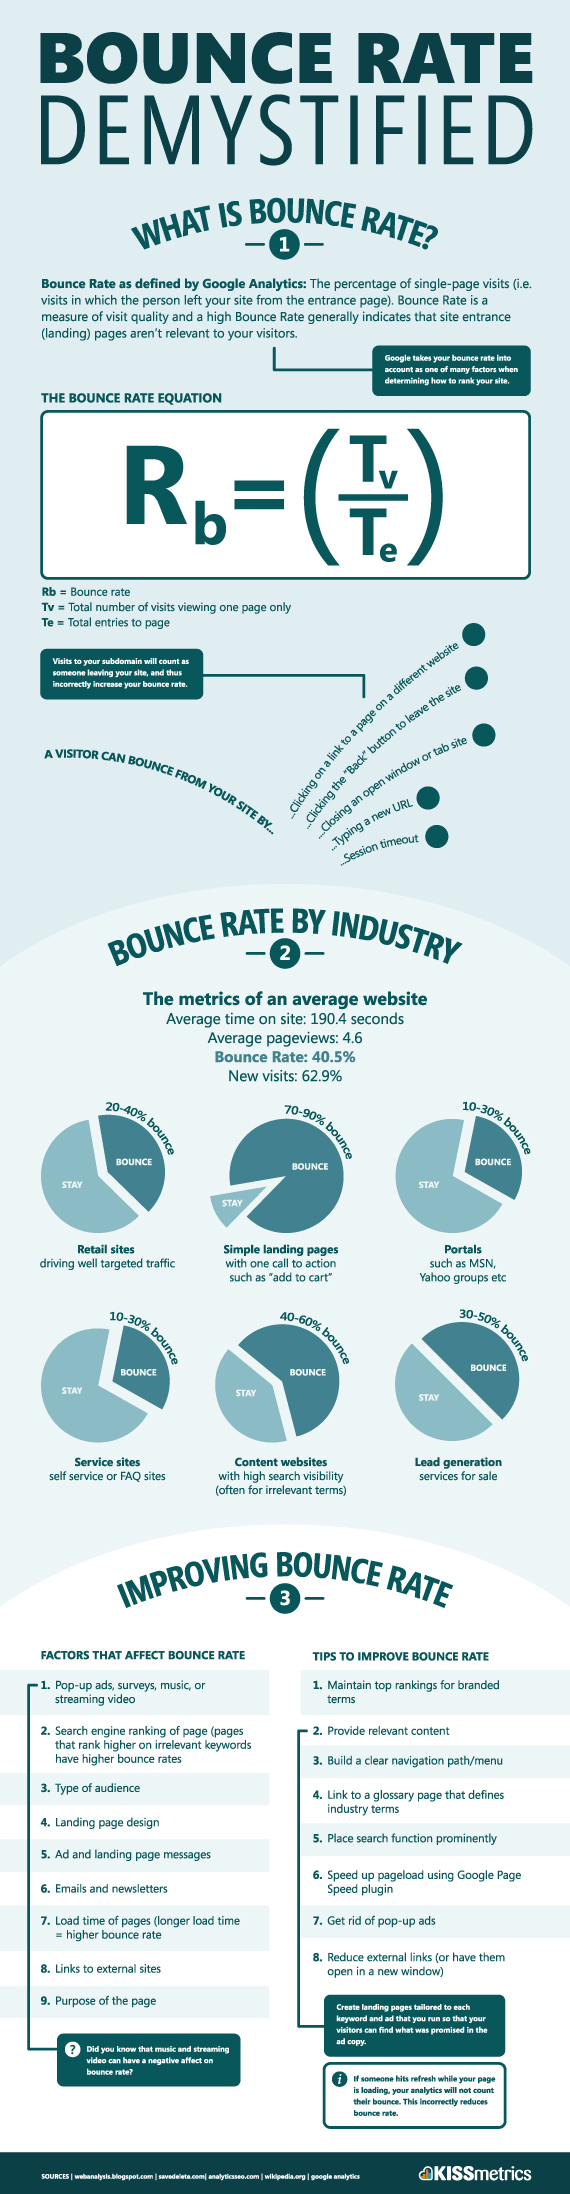
Bounce Rate Google Analytics Summary
Bounce rate is important. If it wasn’t, it wouldn’t exist.
The problem with bounce rate is that it sometimes gets too much attention—it’s misunderstood. An overvalued bounce rate becomes a misused metric. Don’t even get me started on trying to measure yourself to industry bounce rate benchmarks!
But when placed in the right context, it helps when analyzing user behavior and website engagement. And by context, I mean user intent, off-page experience, on-page user experience, and the distribution of the rest of your website pages’ bounce rates.
Take these all into account together, and bounce rate becomes a helpful metric for finding conversion optimization opportunities.
So get behind bounce rate! Stand back and look at it from a distance. You’ll better see it for what it is.
It looks less scary now, doesn’t it?
Aww... You and the Google Analytics bounce rate are on your way to becoming best buds.