


Everyone knows how to check how many sessions you got this week, and most people even know how to see how many conversions you got. But outside of the basics, Google Analytics knowledge tapers off pretty quickly.

It takes a lot of time to learn how to become a great analyst, and it takes a lot of time to learn the ins and outs of specific platforms. Google Analytics, while more intuitive than many platforms, is no exception.
In addition, there are many features that are powerful but are underrated and underutilized.
I talked to dozens of experts to find out what they believe the most underrated features and reports are. Here are the top 12.
Get brand new analytics strategies straight to your inbox every week. 23,739 people already are!
1) Channel Groupings

First, we have channel groupings, which are super underrated.
In fact, in a mildly funny coincidence, both Annie Cushing (Annielytics) and Jeff Sauer (Jeffalytics) mentioned this as an underutilized feature.
Here’s how Annie put it:
“Google Analytics' ability to customize your marketing channels is, hands down, the most underutilized feature I see in Analytics audits. Google Analytics is missing critical channels such as a Paid Social and Retargeting channel. Other channels are inadequately defined, such as the Affiliate channel, which doesn't recognize the medium 'affiliates', only 'affiliate'. And many sites' (Other) channels are burgeoning with unanalyzed data, because most site owners have no idea what it is.
So, there are lots of really great nice-to-have features in Google Analytics that I wish more site owners availed themselves of (like calculated metrics and custom dimensions), but the channels issue is mission critical.”

Annie also wrote one of the best guides on channel groupings in Google Analytics. Check it out here.
Jeff further expounds on the idea here. Basically, go beyond the defaults for a better and more accurate lens of your data:
“Think about it this way: When a marketing team publishes content, they hope it will be spread to hundreds of locations across the web. Yet Google Analytics groups all of the traffic in just a few default channels. It’s hard to analyze the effectiveness of a marketing campaign if you stick to the defaults. You can get many more insights by creating granular channel groupings. These groupings can put all campaign traffic together, can break out paid vs organic social traffic, brand vs non-brand search traffic, and much more.
Of course, with any marketing campaign, you should utilize Google’s campaign tracking parameters. Yes, this should be Google Analytics 101. Yet in 2018, I still see very little adoption (or proper implementation) or UTM parameters in URLs. For every company that gets tagging right, there are 5 more who do no tagging at all.
Direct traffic? That’s not a channel. It is a void. It’s Google Analytics’ way of saying “we don’t know how these people found you!” If you don’t know where over 20% of your traffic comes from, you have a problem. A problem that needs a lot of effort to solve.
Channel groupings are underutilized, because people assume the defaults tell a story. In reality, it’s a cheaply implemented veneer worth replacing. Google Analytics is a one-size-fits-all tool for millions of websites. They treat them all the same. The defaults for a $100MM e-commerce store are the same as an 8-reader blog about cats. Don’t trust the defaults. Customize your channels!”
You can probably take that idea and apply it to anything with your data analytics strategy: the defaults are nice, because they’re convenient--but they’re rarely the most accurate vision of reality.
You can do a little work on custom implementations to drastically increase the accuracy and usefulness of your analytics platform.
2) Campaign Tracking (Strategy)

Yes, as Jeff mentioned in the last point, campaign tracking should be Google Analytics 101. But it’s rarely if ever executed correctly, even at large and “sophisticated” companies (in fact, it’s usually especially broken at big companies).
According to Mark Lindquist, Marketing Strategist at Mailshake:
“I’ve worked with dozens of companies, ranging from small startups to established businesses to international brands, and the majority aren’t even using UTM codes at all, much less setting up a process around organizing and tracking them so that they’re useful.
This can be especially troublesome if you have an active email list, but don’t use UTM parameters. Google Analytics automatically tracks visitors using ‘last non-direct attribution’, meaning a visitor who accesses the site via a Google search, followed by 5 direct visits, they’ll be tracked as 6 organic visits.
If you don’t have UTM parameters set up, all of your email traffic will appear to Google as direct traffic, which will in-turn be attributed to the last non-direct visit. If you have a large, active email list, this can really skew your traffic-by-channel data.”
Use this spreadsheet to track your UTM tags. Also, never use a UTM parameter to link one page on your site to another (it will break Google Analytics’ default tracking capabilities). If you think you have internal links with campaign parameters, you can find them and clean them up using Screaming Frog (instructions here).
In my experience, the best way to track internal links is to use some sort of customer tracking parameters. This article is a tad old, but explains it well. An example here is the ‘hubs_’ parameter we use for internal tracking:

3) Custom Alerts

When you’re just starting out and have very little traffic or conversion volume, it’s easy to keep your eye on the ball.
When you’re scaling and testing many different acquisition channels and tracking many different events and goals, it gets a bit harder to remain notified of big changes.
Custom Alerts helps you automatically get notified of any notable trends in your data.
Here’s how Joao Correia, Solutions Director at Igloo Analytics, puts it:
“An undervalued feature in GA is definitely the "Custom Alerts". When configured Google Analytics alerts you to significant changes in your goals or traffic which can serve as an earlier indicator of problems in your marketing, website or tracking.”
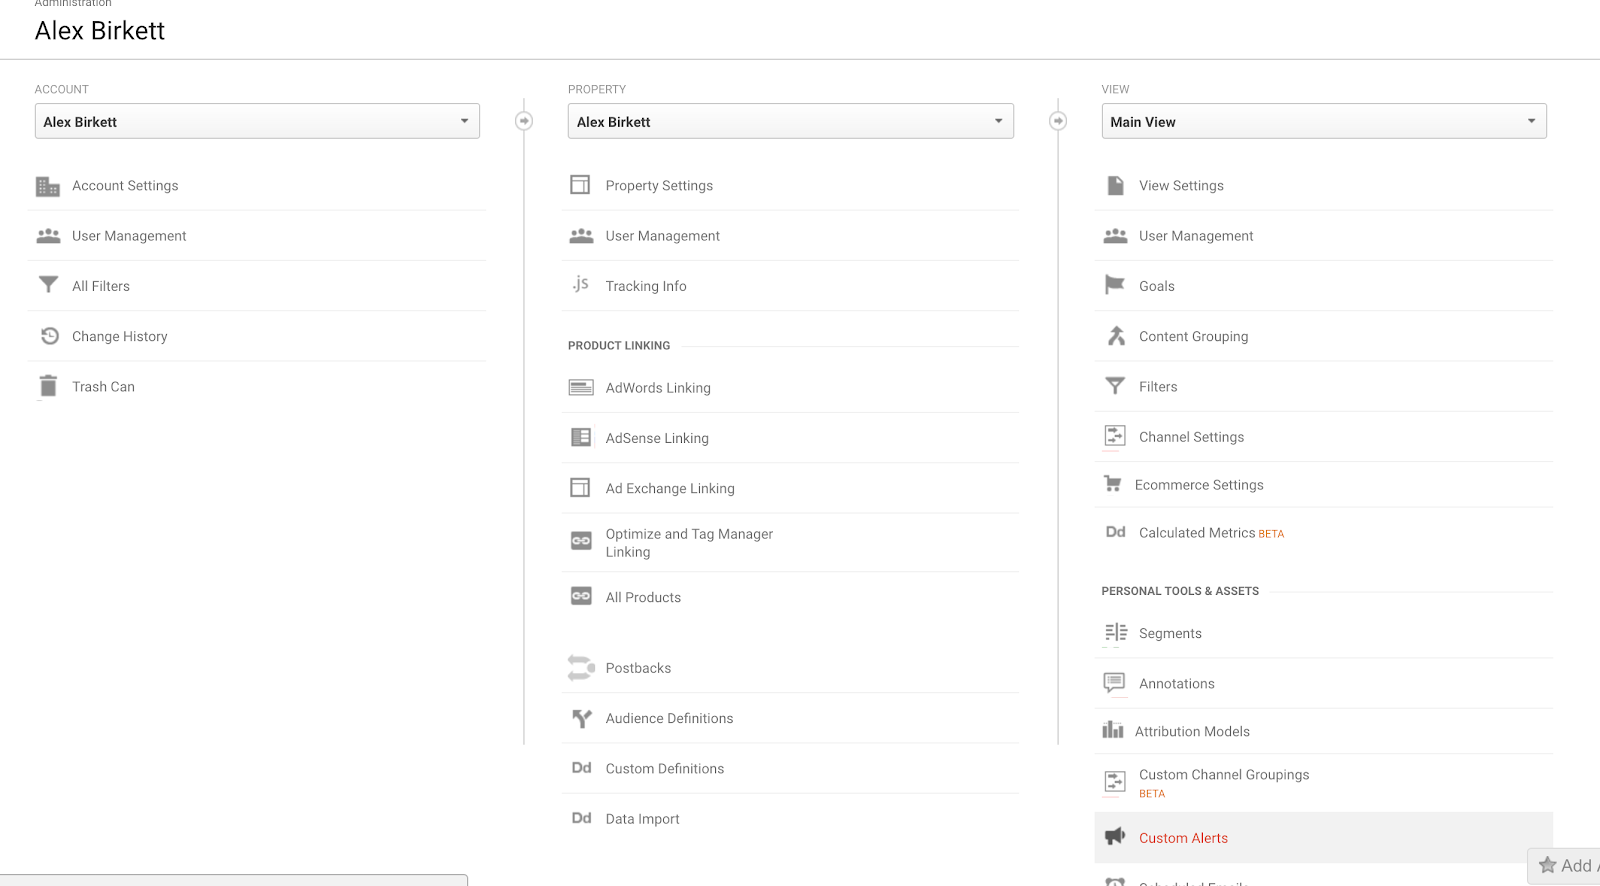
Setting up Custom Alerts is quite easy as well. You just navigate over to your Admin panel and find Custom Alerts at the bottom right hand side of your “Views” section:
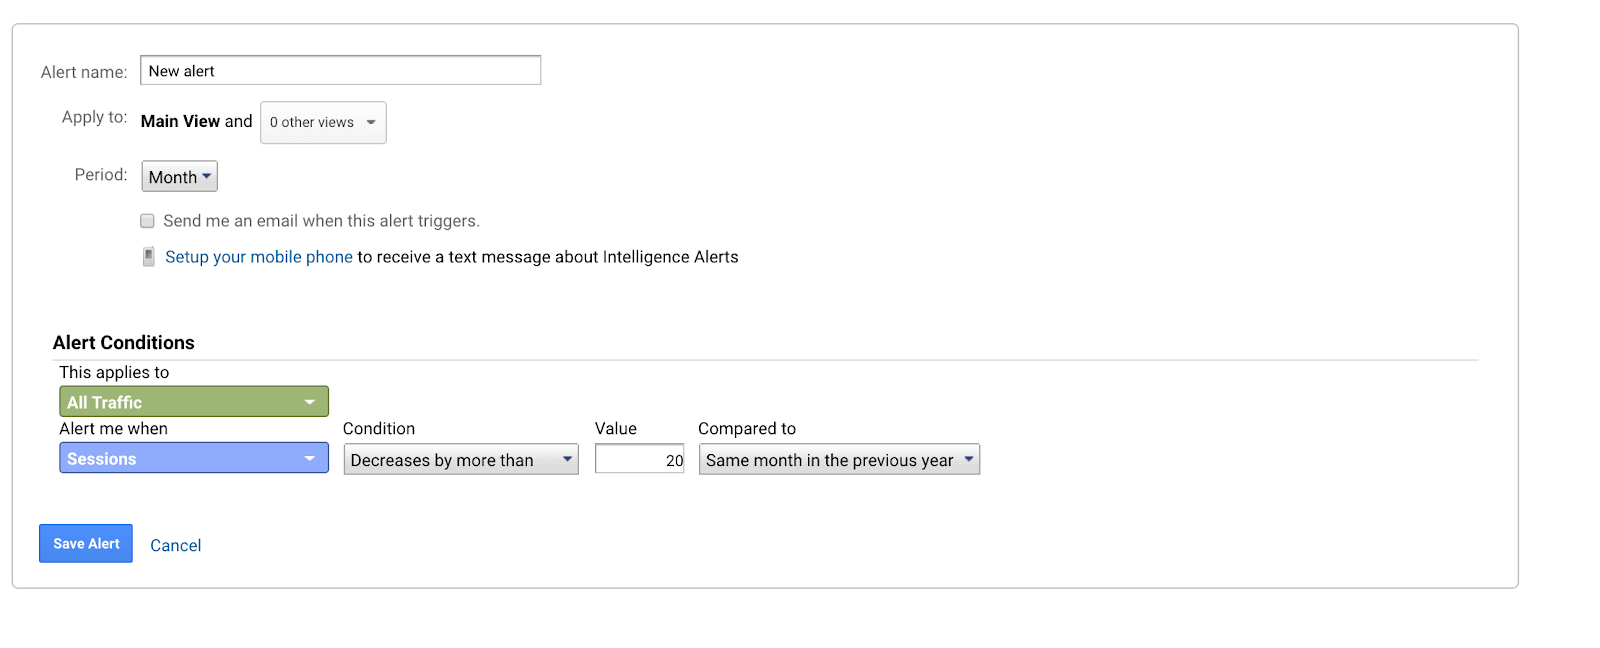
Now, you just need to set up the conditions for which you’d like to receive alerts. This should be something actionable and that matters for your business, and ideally something that could be subject to changes for some reasons. It’s common for marketers to set up alerts for traffic (or more specifically, organic traffic). Whatever you want to report on, just set up your conditions, name the alert, and hit save:
4) Annotations

Custom Alerts are great to keep your team alert as to large changes in certain metrics. Annotations can help your team explain why they happened and add clarity to your Analytics reports. They’re basically notes that you can tag on certain reports that help clarify situations.
Shanelle Mullin, Content & Growth at Shopify, puts it like this:
“I’m always surprised by how few people use annotations in Google Analytics. Historical data is important and we tend to overestimate our own memories. Annotations help make historical data more reliable.
Use the annotations to flag: the beginning and end of marketing campaigns, major holidays, technical or design changes, changes to goals or filters in Google Analytics, impactful press mentions, etc.
You can also share your annotations, making them useful for cross-department communication. Imagine checking Google Analytics one day to notice a steep drop in traffic. Instant panic, right? With annotations, you could see that the paid team turned off a big campaign, for example.”
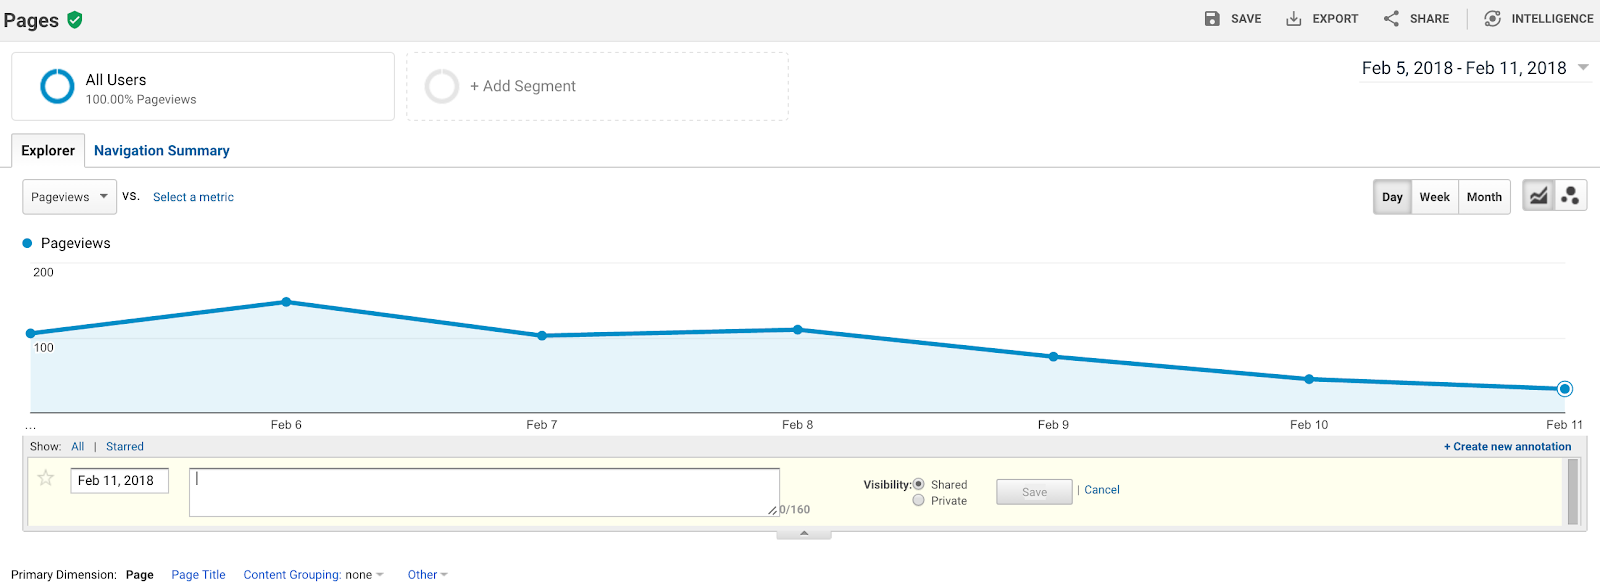
Again, setting up annotations is pretty easy to do. You can do it from your Admin panel, but it’s probably easier and more intuitive to do it directly from a report. Just click the arrow underneath the time series chart. From there, you can find an option to create a new annotation. Then you can simply write what you’d like (e.g. “this traffic increase can be explained by our TechCrunch article,” or whatever you think can bring some context to the report):
5) Reporting Automation

Following the theme of communication and productivity boosters, if any part of your analytics work is highly repeatable, you should look into how you can automate it (as long as quality doesn’t suffer).
Much of the time, the highest impact and most obvious area for automation is with reporting.
Here’s how Johannes Mehlem, Senior Web Analyst at HubSpot, puts it:
“I think that reporting automation is seriously underutilized, next to features such as custom reports, dashboards and report exports, there are also ways to automate Google Analytics reporting in Google Sheets, which allows for easy data sharability, data manipulation with Sheets' formulas and flexible data visualization.”
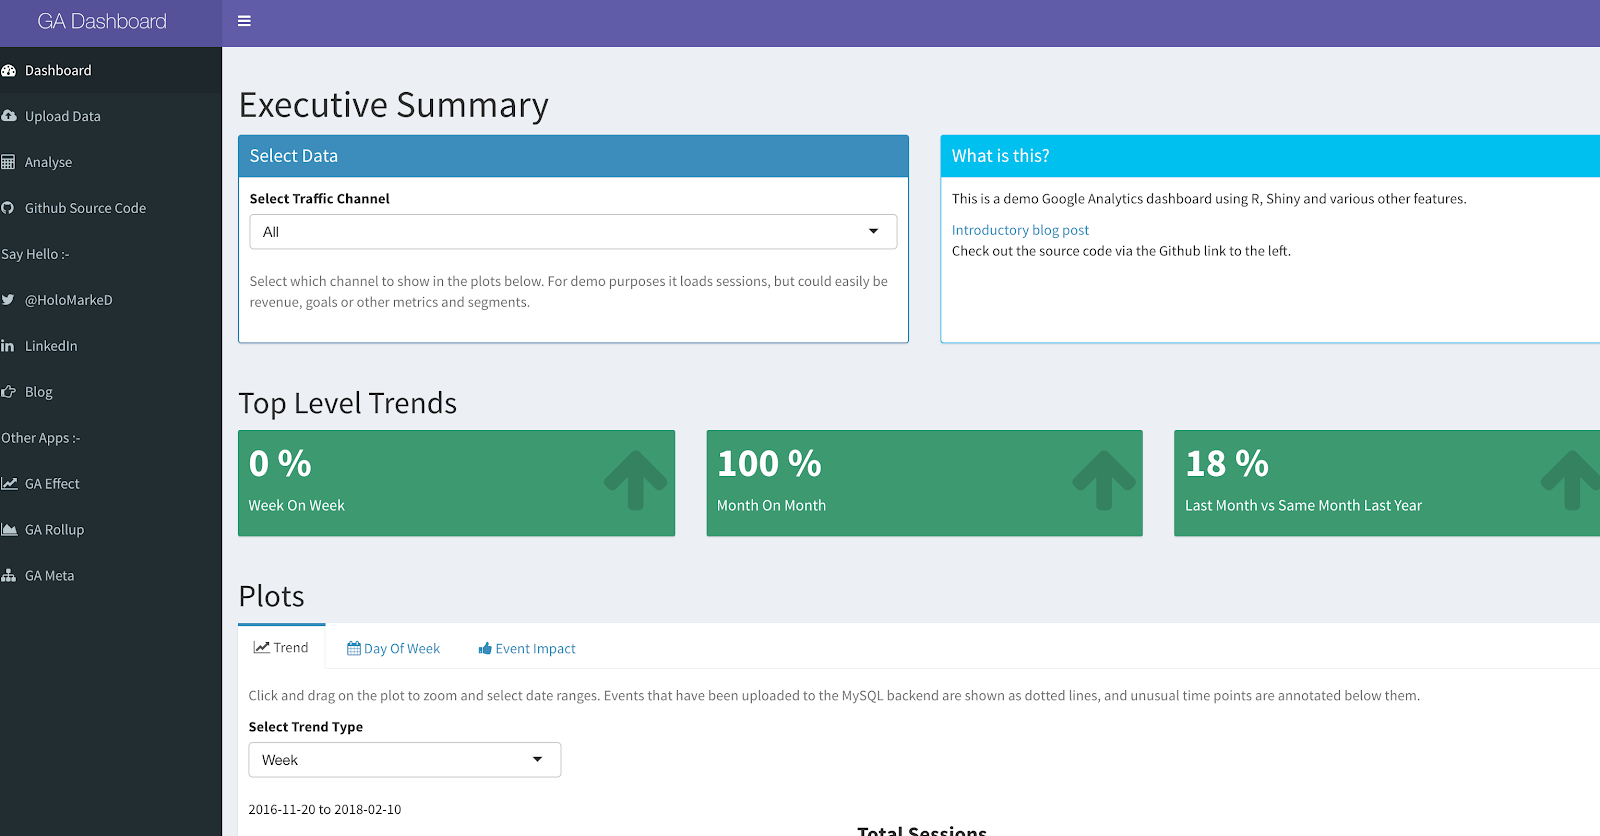
There are many ways to automate your reporting, from the simple options like setting up a custom dashboard within Google Analytics, to the more complicated Google Sheets option that Johannes suggests (though it’s not too complicated really), to the most complicated but robust options like setting up a custom Shiny App using R programming.
This dashboard from Mark Edmondson is a great example of what you can do with R, Shiny, and Google Analytics:
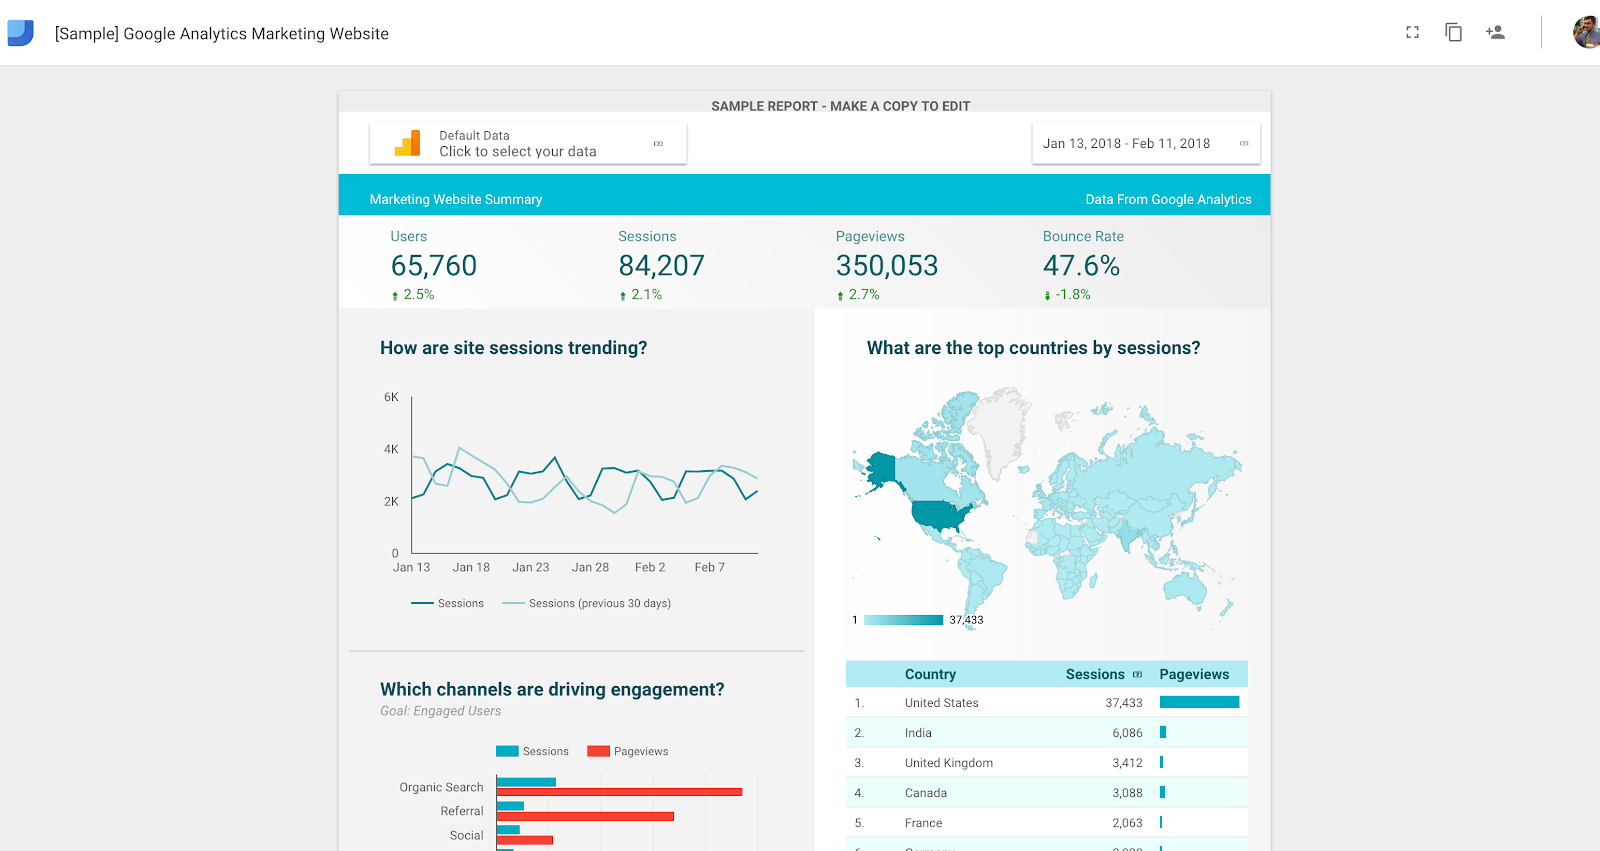
Whatever the case, do what works for your business. Actually, I find that Google Data Studio is becoming a wonderful and easy option for automating reports and sharing them with colleagues.
6) Conditions (Advanced Segments)
Advanced segments in Google Analytics are still severely underutilized. Most people stick to the out-of-the-box system segments that Google provides, like bounced-users and non-bounced-users.
Of course, it’s a good thing if you’re segmenting your data at all (and you’re ahead of the curve if you’re doing so). But it really doesn’t satisfy the proper analytics process of asking business questions and seeking out answers with your data.
With advanced segments, conditions and sequences (which we’ll talk about in a second), you can set up parameters to isolate almost any segment of users on your site (assuming you have the proper tracking set up).
For instance, we can set up a condition for anyone who has a User ID value to analyze the difference between Users and Non-Users on the HubSpot knowledge base pages.
Why would that be valuable? Because than we could see if a significant percentage of visitors are not currently users, and we could make their path to conversion easier (instead of simply assuming we’re helping out current users).
Or you could set up a segment for users who have viewed more than 10 pages but haven’t converted and analyze how their behavior differences from the aggregate:
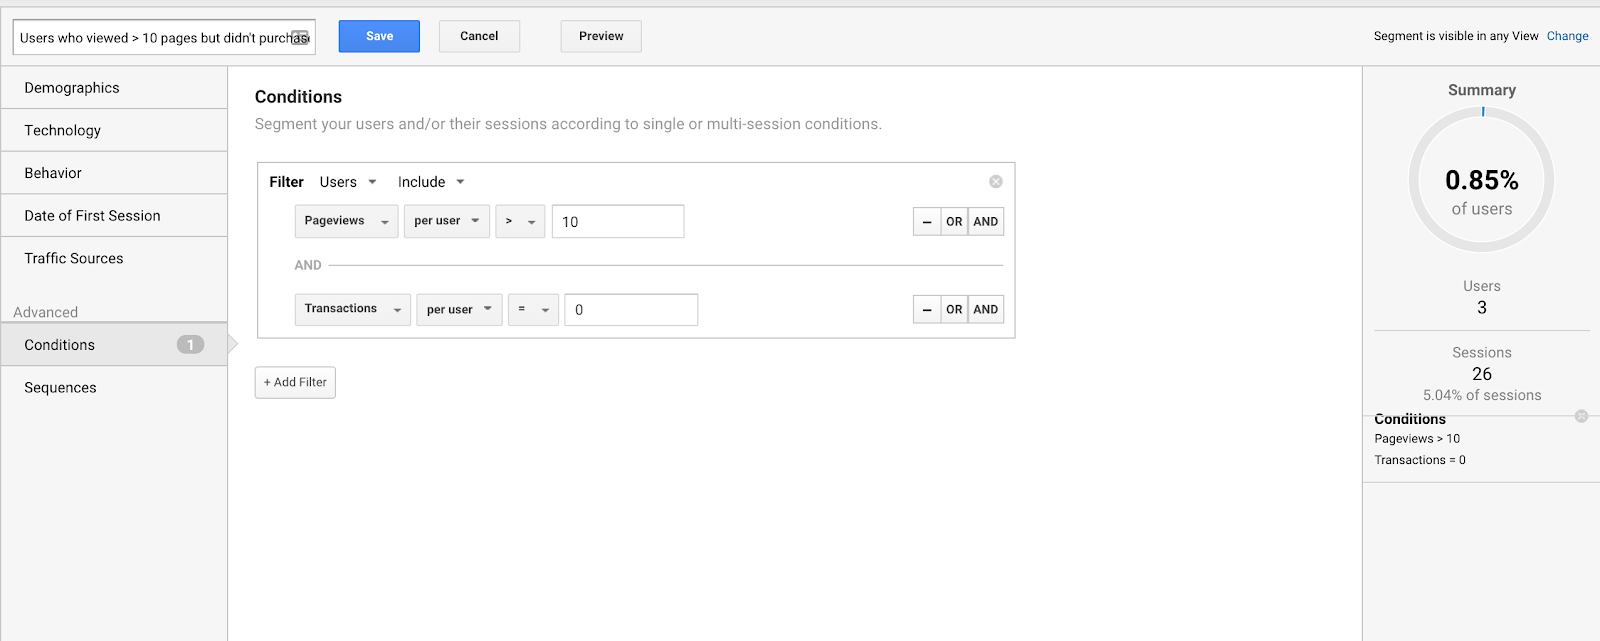
Point is, there are tons of uses for conditional segments for chopping up your data and analyzing deeper. Here’s a great article that dives a little deeper into how to user advanced segments in general.
7) Sequences (Advanced Segments)

The second form of advanced segment is a Sequence.
In my experience, Sequences are the most valuable segmentation method. I’ve definitely gotten the most use out of them, and it seems that others have too.
Here’s how Chris Mercer, founder of measurementmarketing.io, puts it:
“With Sequences, you can start to measure which of your users made specific behaviors in a certain order.
For example, with Sequences at your fingertips, you can create a segment of users who viewed a product detail page, then immediately clicked on the add-to-cart button. Then compare that segment with users who viewed a product detail page, interacted with the images of the product, and only then clicked on the add-to-cart button. Comparing the results of those two groups can help you answer a question like "are the product image thumbnails that important... are they leading to a sale?" and so on.
With the right set of Sequences, you can get all sort of insights and answers you'd otherwise be blind to."

Yehoshua Coren, CEO of Analytics Ninja, also emphasizes the importance and usefulness of sequential segments. Here he goes into great detail on an example of how you could use sequential segments for remarketing purposes:
“Knowing which type of page a user was on when they took a specific action allows us to make inferences about their intent.
This is particularly important because the creation of a segment in GA not only allows us to understand our users and their behavior based upon the actions they take, but we can create Audiences for remarketing from those very same segments in just a few clicks.
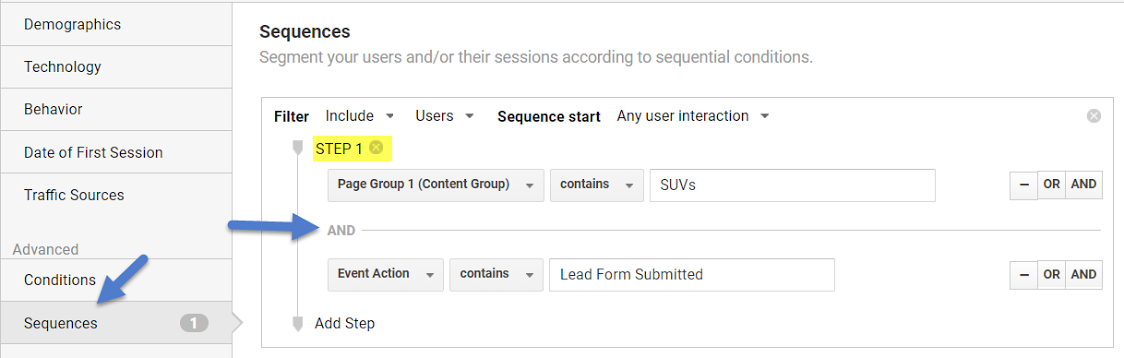
For example, let's say you owned a car dealership and wanted to understand create a remarketing list for users who filled out a lead form for SUVs.
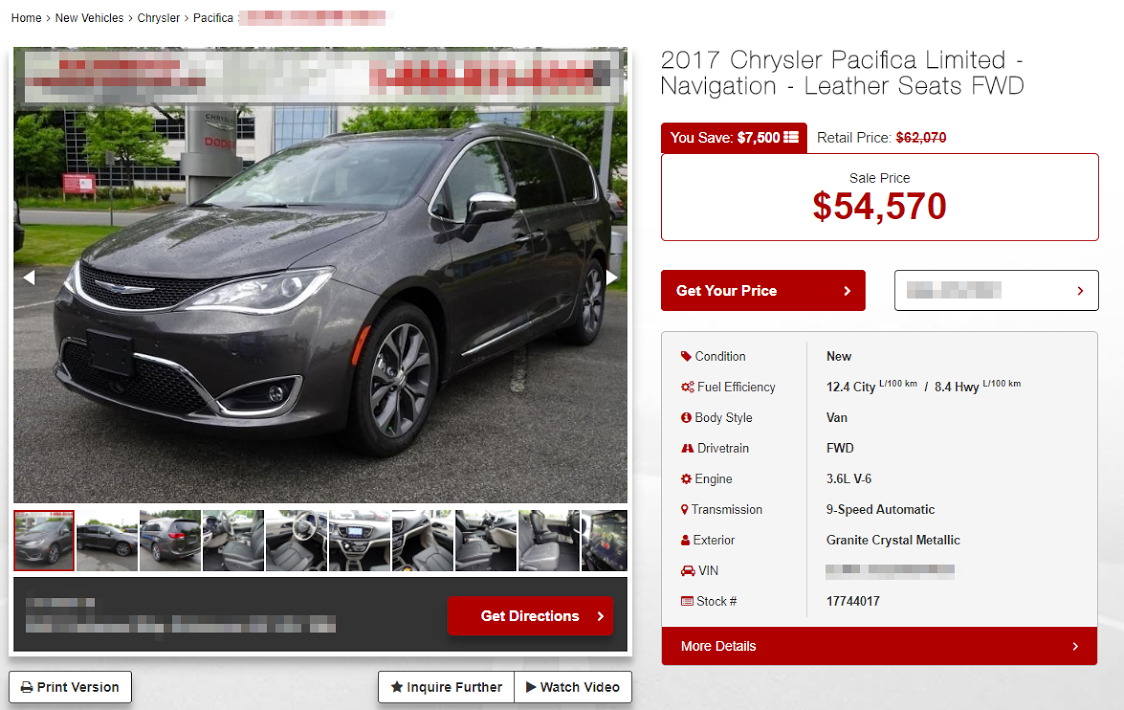
It would not be enough to simply create a segment that matches the "Goal" for form submit, or even Goal for form submit AND page == target page.
The AND statement in a conditional segment would return all users who filled out a form AND also viewed the target page. But it does not mean that the user filled out the form on the target page. Perhaps they browsed some SUVs but became a lead for a more inexpensive car type.
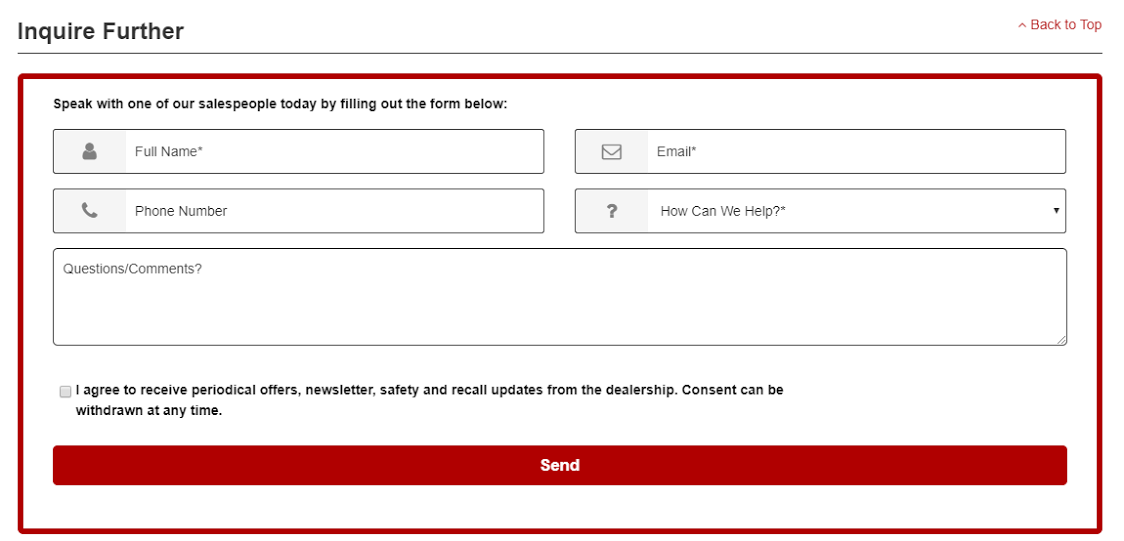
In order to return all sessions of users who submitted the form on a particular page (or page type), you need to put both steps within the same step of a sequential segment.
Similarly, if you want to properly segment your A/B tests without having overlap of audiences, you need to use this hit level segmentation. This is particularly important if you're running more than 1 A/B test at a time, and one of the variations is called "control" in more than one of the experiments.”
In my experience, sequential segments are where you usually find the richest insights, as long as you’re asking the right business questions. Here you can analyze the behavior of users who took certain paths, which can be insanely useful, especially when you integrate this data with AdWords.
8) Demographics

Generally speaking, marketers are apt to look at “what” is happening on site, but rarely probe the question, “who?” when viewing analytics data. There are a few reports that help answer this question, mostly in the Audiences feature.
Ryan Farley, founder at LawnStarter, explains that he gets tons of value from Demographics, for analyzing the differences in user behavior as well as combining this data with more qualitative insights:
“Demographics are pretty underrated in my opinion.
GA gives you traffic, conversion, and engagement stats by age, sex, and interest groups. You can almost always learn something about your audience, for example, what age group your site appeals to most.
Sometimes it’s as clear as seeing that older demographics convert better for your product. You can then go into AdWords and increase bids for that older demographic. Or, you might be able to combine with qualitative data from surveys to see how different demographics describe your product, and test personalizing the messaging on your site.”

Talia Wolf, Founder at GetUplift, also mentions that Audience reports can be useful. As she explains, Audience reports are great for user research that can help inform UX and design strategy (when combined with other forms of research and data collection as well):
“Using the 'Audience' report you can determine what colors you should use on a page to utilize color psychology in the most effective way.
Colors affect people on 3 different levels - Emotion, culture and symbolism.
Meaning that not all colors affect people the same way. In order to choose the right colors and get the psychological effect you want you need to understand your audience better, do that by looking at simple metrics such as: Age, Geo, Language and Gender.”
9) Cost Data Reports
Importing cost and click data from non-Google advertising initiatives lets you explore in greater detail the Return on Investment of your campaigns.
According to Google, it’s best used for anyone wishing to track performance for non-Google campaigns such as:
- Paid keywords from non-Google search engines (except those from the 360 DoubleClick Search Reporting integration, as this will duplicate cost data)
- Email marketing campaigns
- Social media advertising
Talia Wolf, Founder at GetUplift, explains it like this:
“As an optimizer, my goal is to use the data in Google Analytics to find the leaks in the funnel, understand where the story is and fix those leaks. One of the most unused reports for doing that is 'Cost Data Reports'.
If you're spending money on driving traffic to your website and landing pages, you need to know these numbers in order to optimize. GA allows you to import the impressions, clicks and cost into your advertising reports. You can use third-party tools to pull this data or use Google Optimize 360.”
10) Search Terms and Queries
Another useful report for discovering user behavior and intent is search terms (as well as queries to a certain extent). I find that on many Google Analytics implementation, Site Search isn’t even enabled--and if it is, it’s usually buggy. Setting up Site Search is a quick win for you if you have any search function for users.
Here’s how Talia Wolf, Founder at GetUplift, explains it:
“Using the 'search terms' report and the 'queries' report, you can see what terms prospects are searching for before arriving to your site and while on your site.
The search terms will tell you what stage of awareness people are at (unaware, pain aware, solution aware, product aware or most aware), their pains, hesitations and concerns.
Once you know the prospect's stage of awareness, you know exactly what message to use (e.g. strategy, copy, hero image and other elements) on the page that will move prospects from one stage to the next and increase conversions.”
To add to that, I’ve found that site search data can be incredibly useful for informing content strategy. Basically, you can see if new terms are trending--and if so, what to do about it.
I wrote about the process here in my article on content marketing analytics, but the gist of it is you go to Behavior > Site Search > Search Terms and then choose to compare two time periods (this month to last month, for instance). Then, you choose the comparison view, and view “Absolute Change.” This lets you see if there are any rising trends in search:

If there are any rising trends for which you don’t have pages or content, you know that you should probably invest the time in creating them. Especially if the terms are bottom of the funnel or support based (e.g. “return policy,” “guarantee,” “about [brand]”) then you should definitely look to create or prioritize this content.
11) Enhanced Ecommerce (The Whole Suite)
There are two ways you can set up ecommerce tracking in Google Analytics:
- Standard ecommerce reports, which show you the basic product and transaction information (like conversion rate and average order value).
- Enhanced ecommerce, which has all the standard features, and also more advanced information like when customers add items to their carts, seeing when they start the checkout process, and building more advanced funnel visualizations.
Lots of people are using Enhanced Ecommerce, but few are using the entire suite of tools available within Enhanced Ecommerce.
This includes:
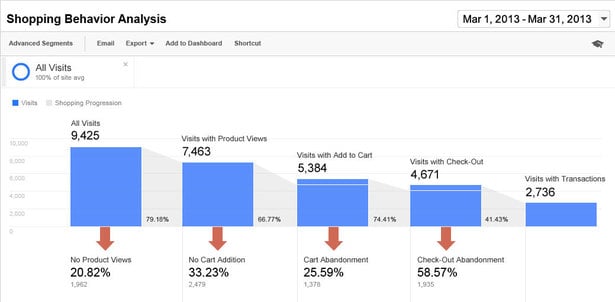
- Shopping behavior analysis
- Checkout behavior analysis
- Product performance
- Sales performance
- Product list performance
- Internal promotion
- Order coupon
- Product coupon
- Affiliate code
That list seems overwhelming, and that’s because you can great crazy granular insights with this stuff. You can do everything from analyzing the performance of internal promotions and banners to creating custom horizontal funnels and analyzing funnel behavior by advanced segments.

Most people just stop at the basics, though.
Here’s how Annika Oorn, Senior CRO Strategist at CXL, puts it:
“At CXL, we analyze tons of websites and their Google Analytics setups. More and more often, we see clients who have set up Enhanced Ecommerce, but are only tracking transactions.
At a minimum, we should be looking at basic actions like "products added to the cart,” "products removed from cart," and "product views" to understand the visitor behavior better. Check out the possibilities here.”
The cool thing about Enhanced Ecommerce features like these, outside of analysis, which is important of course, is that you can incorporate new segments into your advertising strategy and targeting strategy.
In the same way that you can build out remarketing audiences using sequential segments (as we talked about above), you can do that using variables from enhanced ecommerce features.
This allows you to do cool things like remarketing to all non-users who reached checkout, but didn’t purchase (or whatever parameters you choose to set).
12) Gettings Outside of Google Analytics

In a twist, my last point is that sometimes the most underutilized function of Google Analytics is getting out of Google Analytics.
You can port your data to Excel and R, as many do for analysis--but a greater step, if you want to have full access to your raw data, is to pull your data to a BigQuery database. There, you can do things like pull your data into different tools, combine pre- and post-purchase data, and build out stunning models and visualizations.
Moe Kiss, Analytics Manager at The Iconic, puts it like this:
“The most underused feature (and perhaps a scary step for some analysts) is the ability to use session or hit level data from BigQuery for analysis.
This allows you to go from the aggregated view in Google Analytics to more granular data. With this data, you can start building your own models, better stitching users across sessions and creating cross-device funnels.”
Once you start working outside of the Google Analytics user interface, you can start doing cool things with your data. For one example, you can run user path analysis visualizations with BigQuery and Snowplow. Pretty advanced stuff, but very cool if you’re at that level.
LunaMetrics has a great guide to get started, called “Google Analytics 360 Starter Guide for Google BigQuery.” It also links out to a few resources to help you learn more.
Wrap Up On Google Analytics Features
Google Analytics is a great tool for making analysis easy and intuitive. At least, on the surface it’s easy and intuitive. But it turns out there are many important features lurking beneath the surface that are incredibly valuable and barely used.

While your analytics implementation practice should always be lead by strategy and business goals, realize that there’s probably more you could be utilizing out of your current setup to get better insights, and in turn, make better business decisions. Don’t be afraid to explore some of these options.