


Google Analytics segments are where you’ll find the golden insights you’re after. After all, as Avinash Kaushik once said...
It’s not that your higher level reports can’t provide you with some value. It’s certainly interesting seeing broader directions in which you company is heading.
But for true valuable analysis, you’ll want to dig in a little deeper and see how specific cohorts of users and visitors are interacting with your site.
This guide will cover Google Analytics segments in-depth, from the basic all the way to the advanced. We’ll also outline how you can integrate different tools and use Google Analytics segments to improve your marketing efforts.
- Google Analytics Segments: What Are They?
- Setting up Google Analytics Segments: The Basics
- Useful Google Analytics Segments to Explore
- Advanced Google Analytics Segments: Conditional
- Advanced Google Analytics Segments: Sequential
- Google Analytics Segments for Audience Targeting
- Google Analytics Segments Mistakes & Guidelines
- Wrap Up On Google Analytics Segments
Get brand new analytics strategies straight to your inbox every week. 23,739 people already are!
Google Analytics Segments: What Are They?
First off, let’s start with the basics. What’s a segment in Google Analytics?
Basically, a Google Analytics segment is a subset of your data based on parameters or criteria that you set. If you’re not using segments, you’re defaulting to look at your entire set of users. A segment, however, could narrow down on specific subsets such as those who visit from a particular country or device, or those who have visited specific pages on your site.
You can find segments in any of your reports on Google Analytics at the top of the page, where it says “+Add Segment.”
Google Analytics segments are important,because not all of your visitors are the same and they don’t all act the same. Segments allow you to parse out the differences and view how they behave differently.
For example, you can analyze the behavioral differences between bounce and non-bounced sessions, and see what the difference was in terms of page load time, demographics, or whatever else you may want to analyze.
They also lets you isolate variables to find bugs and problems. For example, you may find that one browser or device completely tanks on an A/B test, and you can analyze why that may be. Perhaps, you didn’t QA your test well and there was a bug on that browser.
You can also view trends in your data with segments, the same way that you could with aggregate data. If you saw a sharp drop in aggregate traffic to your blog, you’d be concerned. The same thing can be found within a particular segment.
For example, maybe you find that your conversions are down for the month, and you wonder why. After digging a bit, you find that it’s really just conversions from Canadian visitors that are way down. Why is that? You know now what the problem is, and you can start to analyze the reasons for it occuring.
Finally, you can use Google Analytics segments to refine your targeting with audience targeting and remarketing.
For example, you can create a segment of users who have added an item to your cart, but didn’t end up converting. You can then set up remarketing on AdWords to target these people with a specific message (as long as you’ve integrated AdWords and Google Analytics). You can target basically any iteration of user behavior and dimensions, including but not limited to:
- Users that visited certain pages (or in a certain order)
- Users who fit a certain demographic profile (age, sex, location, etc.)
- Users who visited via a particular source and/or medium and/or campaign
- Users who visited a certain number of pages
- Users who stayed on the site for X amount of time
- Users who triggered X event
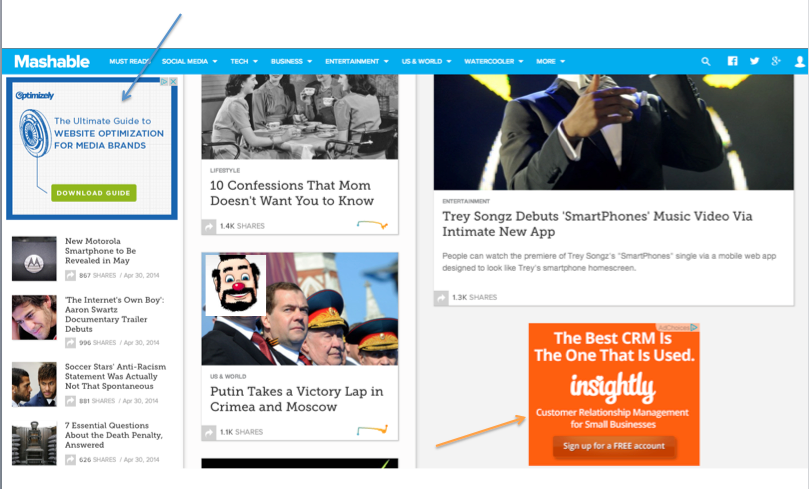
...and pretty much any combination of the above and more. That’s how you can remarket to users who have abandoned their cart, and send them ads with creative like this:

Ryan Farley, co-founder and head of growth at LawnStarter uses segments religiously for remarketing:
“Using segments in GA is pretty much a must have -- it’s by far the easiest and most effective way to remarket without extremely sophisticated tools most of us don’t have access to. At the very least, you should have segments for each level of intent -- ranging from ‘viewed blog’ (low intent) to ‘reached the credit card step’ (high intent). You can then set higher bids on Google Display Network or Search based on how high the intent is.”
More on remarketing use cases later.
Google Analytics also sets some limits on the amount of segments you can set up, both at the user and view level. Here’s how they explain their boundaries in their documentation:
- 1000 per user for segments that can be applied/edited in any view (Segment availability: I can apply/edit Segment in any view).
- 100 per user per view for segments that can be applied/edited only by that user in that view (Segment availability: I can apply/edit Segment in this view).
- 100 per view for segments in that can be applied/edited by all users in that view (Segment availability: Collaborators and I can apply/edit Segment in this view).
It’s pretty tough to reach these limits when you’re just starting out--but still, keep them in mind and be judicious with how you chop up your data and what you’re hoping to find.
Setting up Google Analytics Segments: The Basics
There are a two broad classes of Google Analytics segments to be aware of:
- System
- Custom
System segments are those that Google supplies to you out-of-the-box. They include things like “mobile traffic,” “direct traffic,” and “non-bounce sessions.”
While these can be useful, and they’re easy to bring up right away, you’ll quickly find that you want to set up your own segments. That’s where custom segments come in. To create one of those, you simply click on the bright red “+ New Segment” button on the upper left side.
Once you’re there, you have tons of options to choose from.
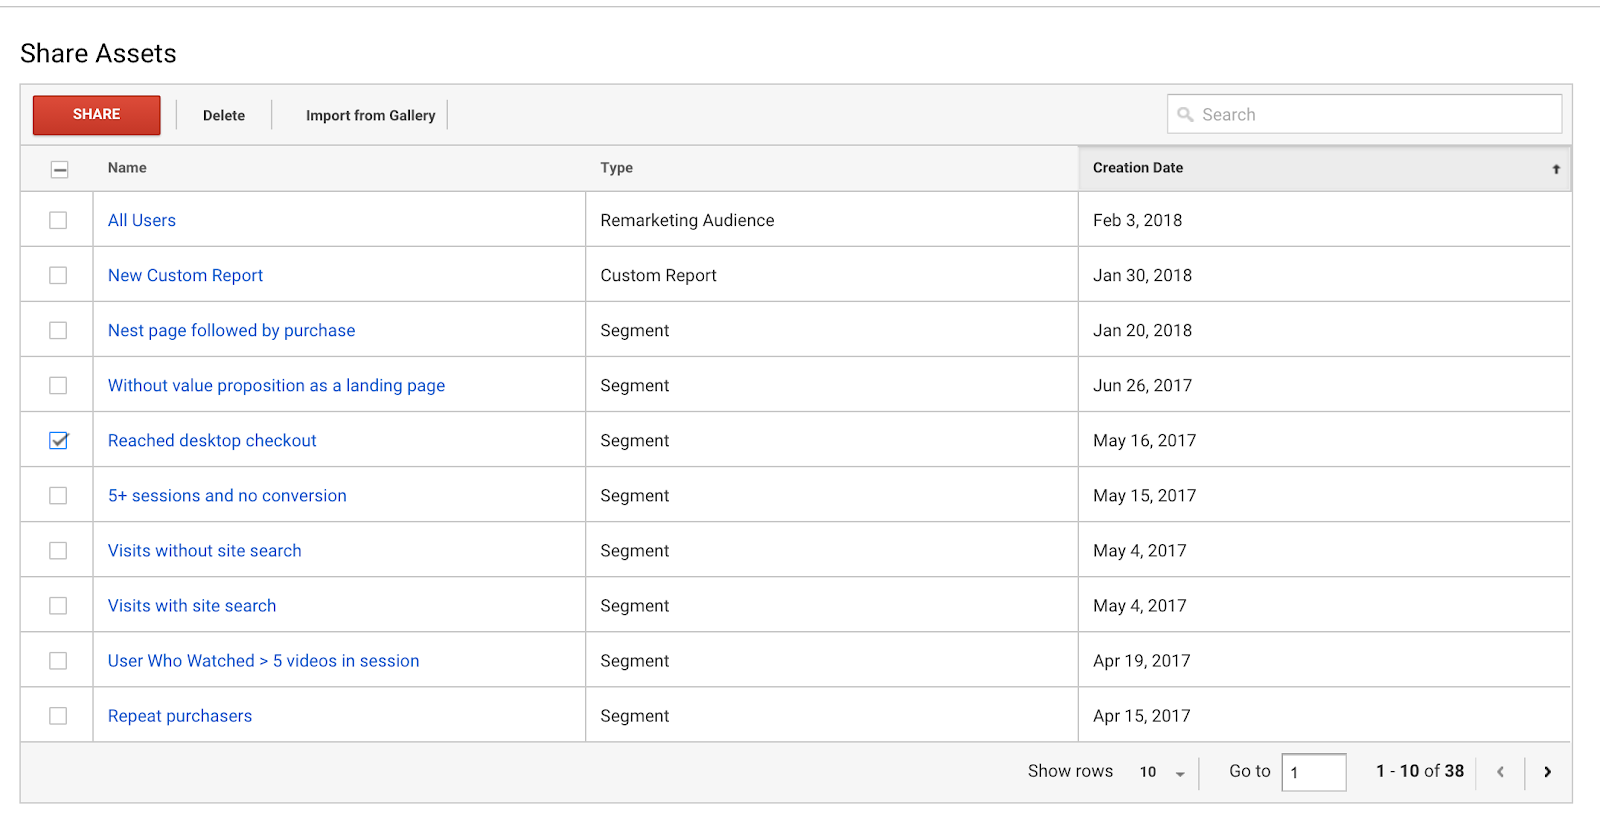
Note that once you create a segment, you also have the option to share it. This comes in handy when you’re working across teams, and what to share specific insights with those who’d like to dive into GA and check it out for themselves. It’s also useful for client work, if you want to explain which segments are worth tracking over time.
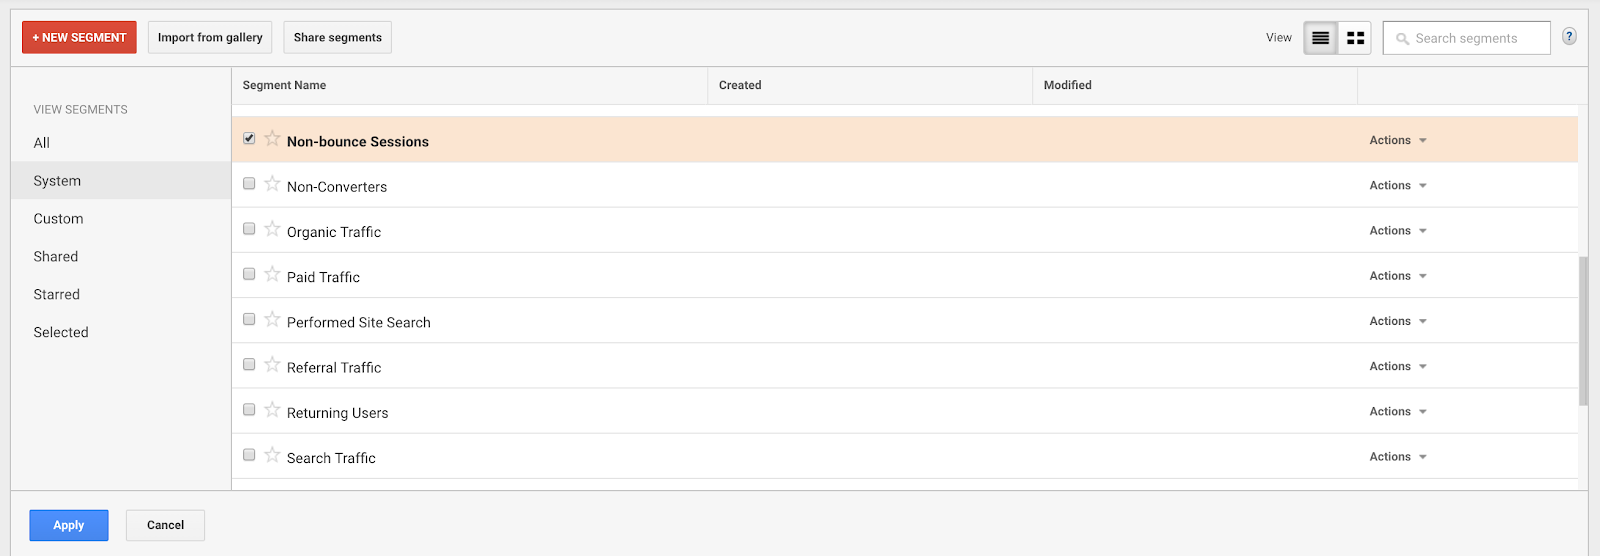
All you do is click “Share segments,” and click whichever one you’d like to share:
After that, you have two options. You can share it privately as a URL or you can share it to the solutions gallery, which is public. Most often, you’ll likely be sharing it privately to others:
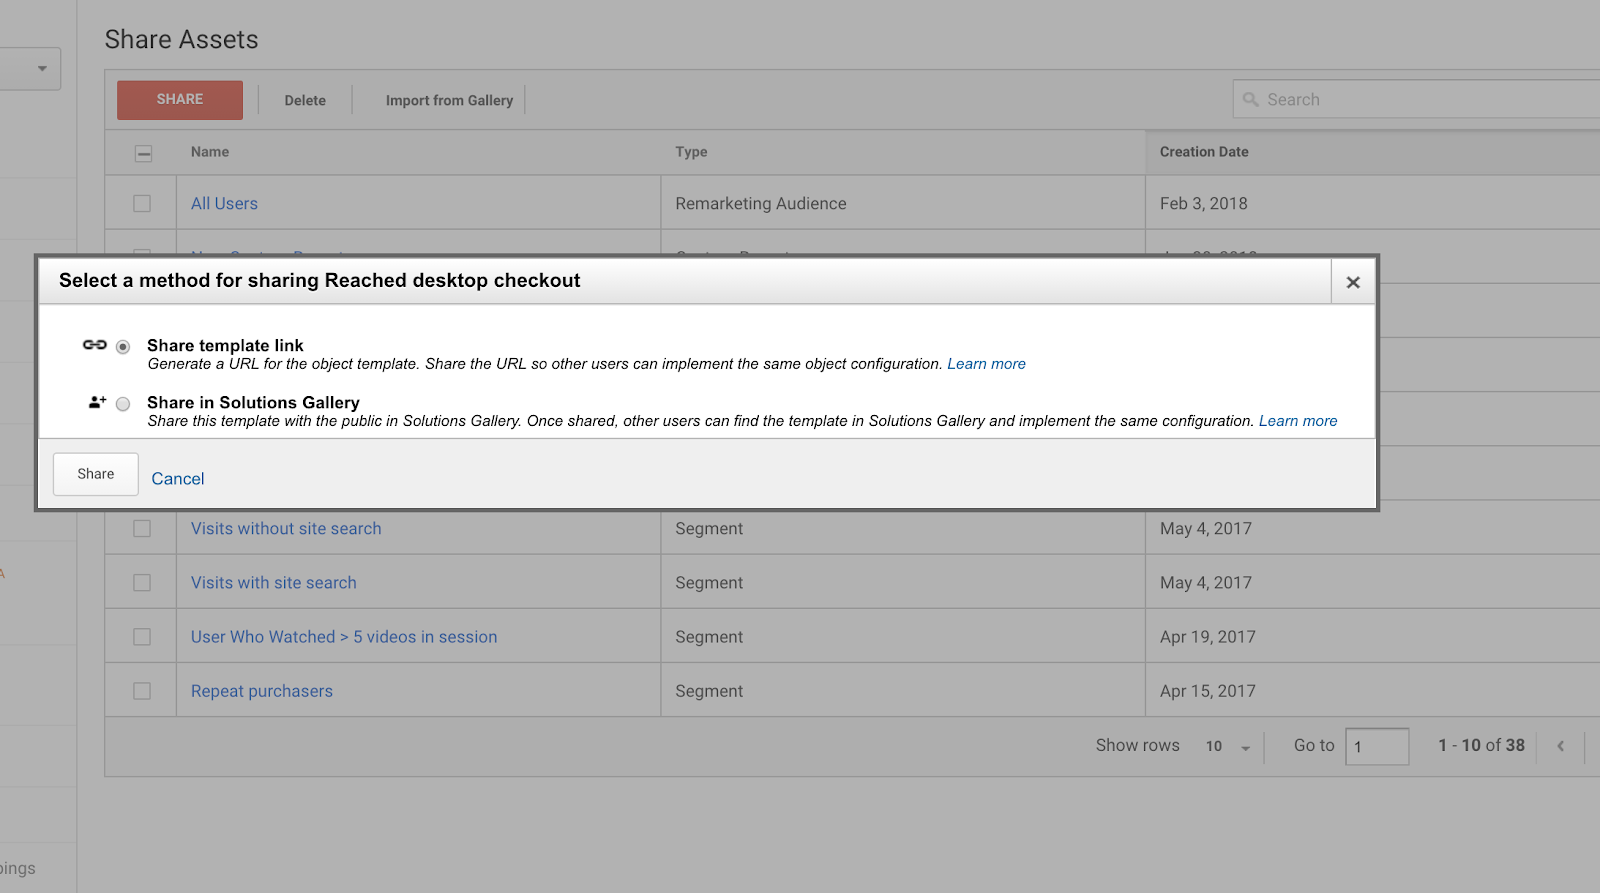
Note that this shares the segment, not the actual report (and traffic numbers) of your Google Analytics account. It just shares the parameters you used to create the segment, so others can do it with their data.
Now that we have the basics down and an understanding of what segments are, let’s go over some simple segments we can create right away.
Useful Google Analytics Segments to Explore
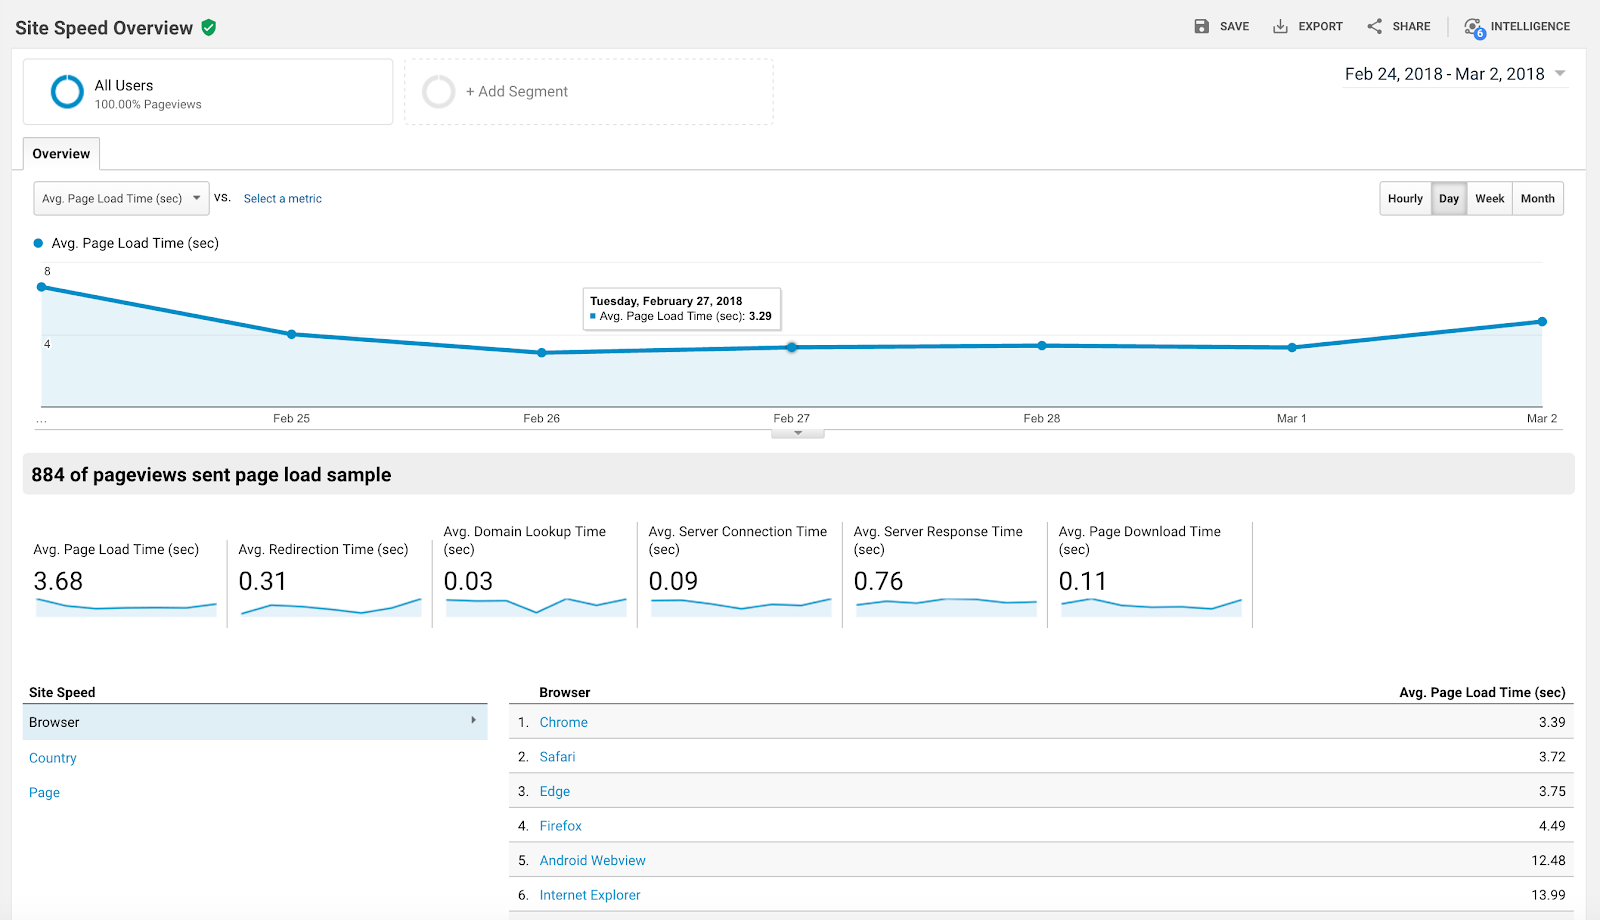
Like I mentioned, Google Analytics includes both custom and system segments. To learn how they work out, let’s try out a system segment to get a feel for a basic report you can run. We’re going to look into the difference in page load speed between bounce sessions and non-bounce sessions (a good route to explore if you want to convince people you need to speed up your site).
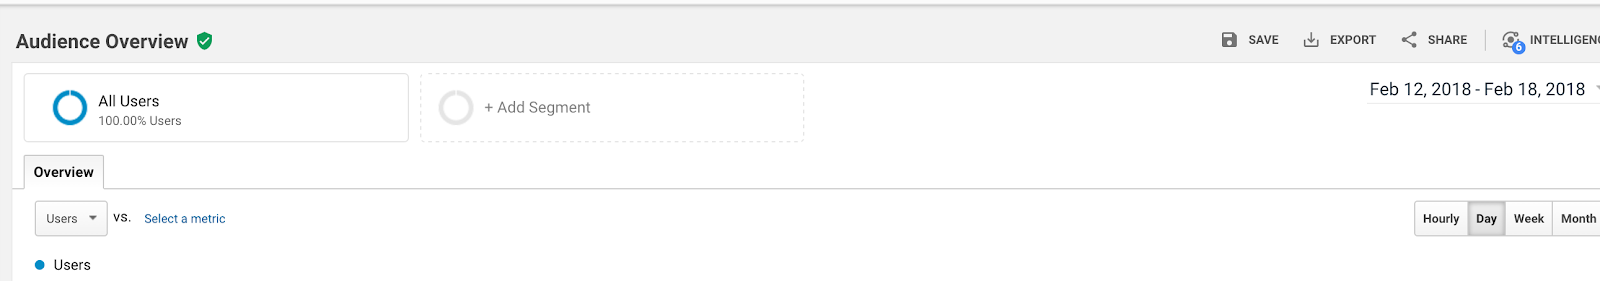
To start out, navigate over to the Behavior > Site Speed > Overview report. You’ll see your aggregate metrics:
Next, click “+Add Segment” or just click into the “All Users” tab on the top part of the screen (doing so allows you to replace that audience). You’ll get a screen like this with a variety of segment options:
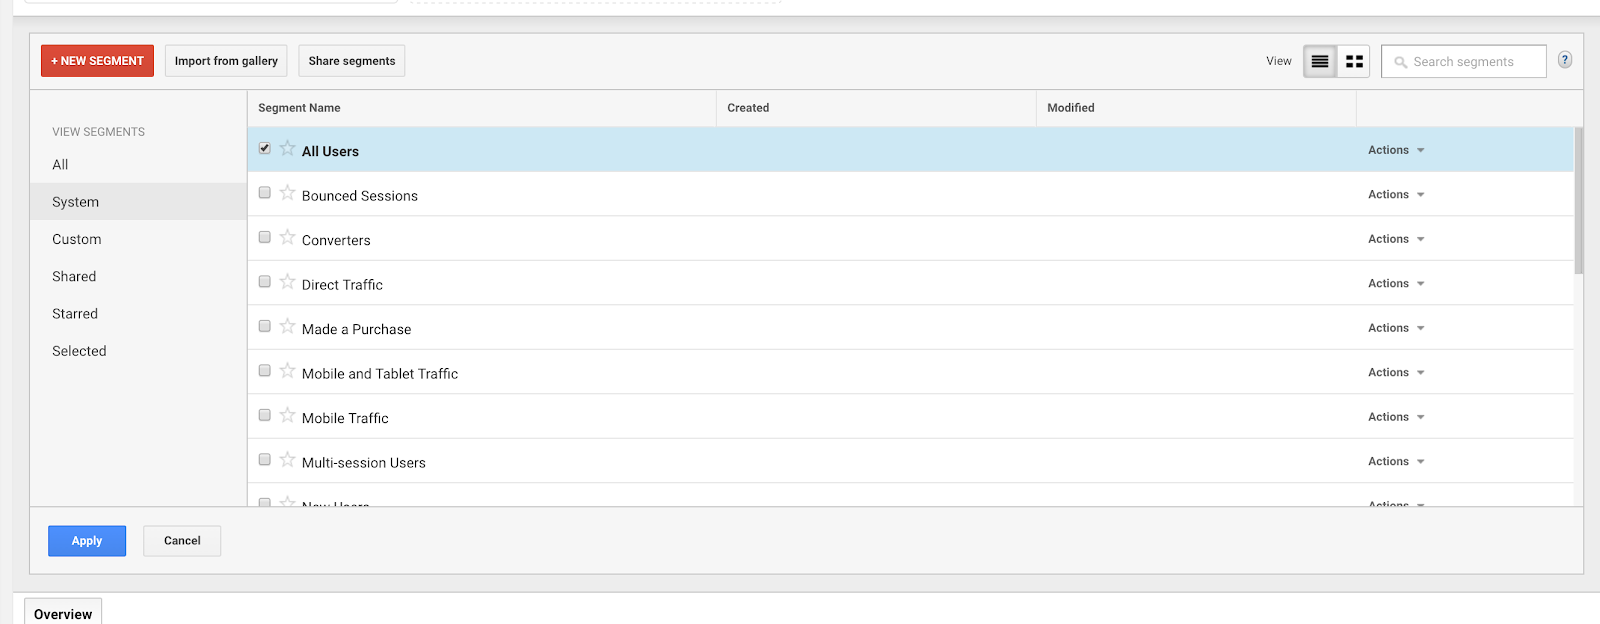
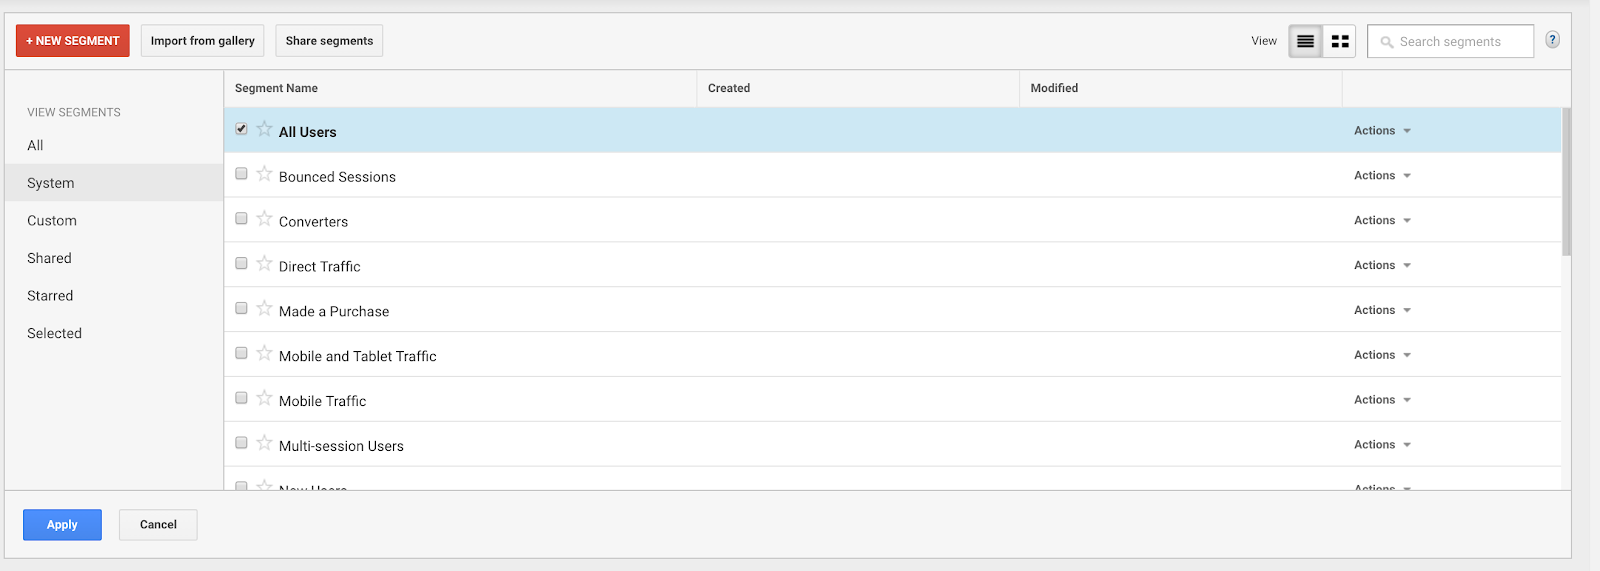
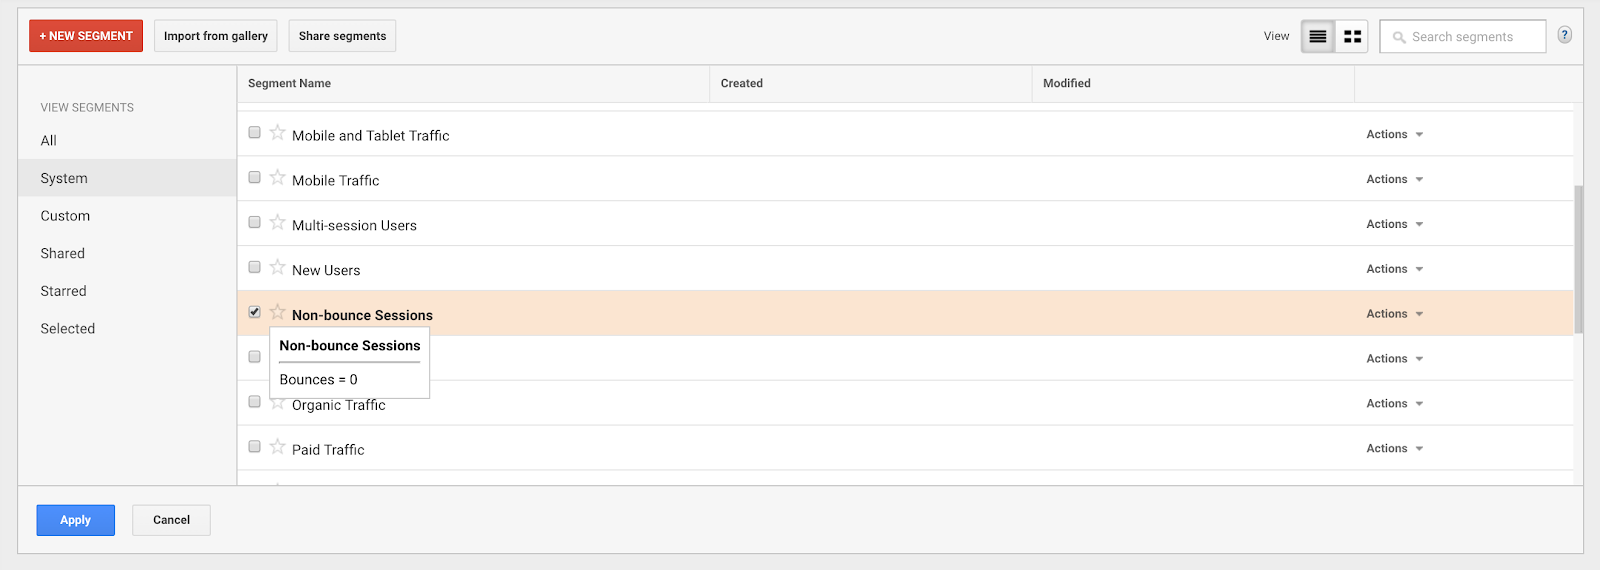
Here, you simply need to click into the segments you’d like to analyze. On the left side, there are a few options including System, Custom, Shared, Started, and Selected. Click “System” and find “Bounced Sessions” and “Non-Bounce Sessions.” Check both of them (and uncheck “All Users”).
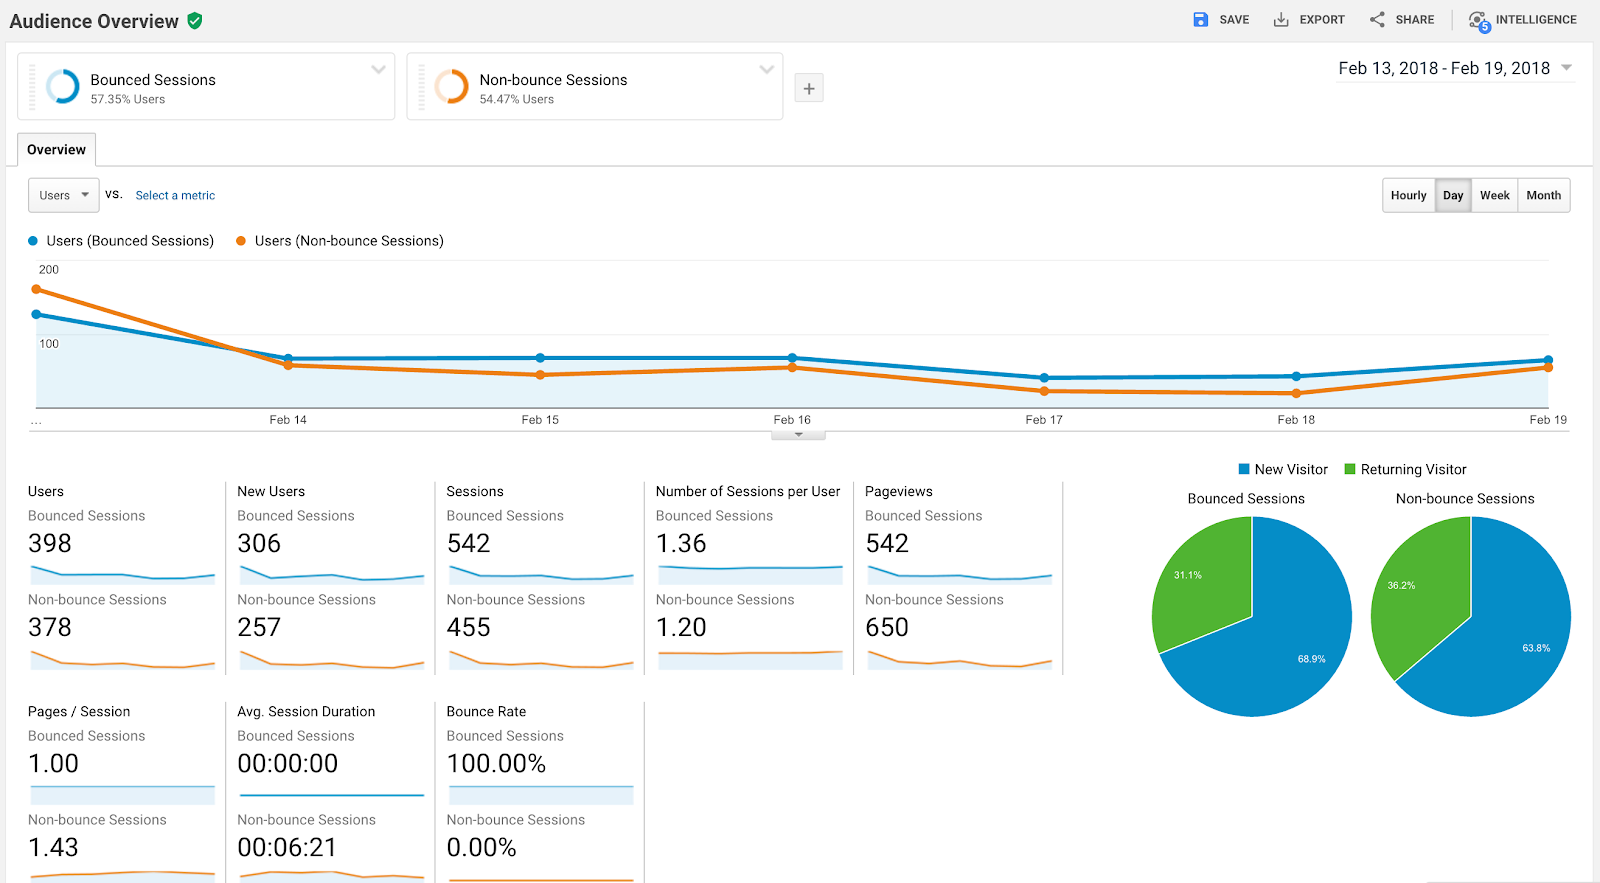
Once you’ve done that, click apply, and you’ll be able to review your site speed report (but now using Bounce and Non-Bounce Sessions as segments to compare). You can clearly see how much pagespeed correlates with bounce rate on this site (and every site, of course):

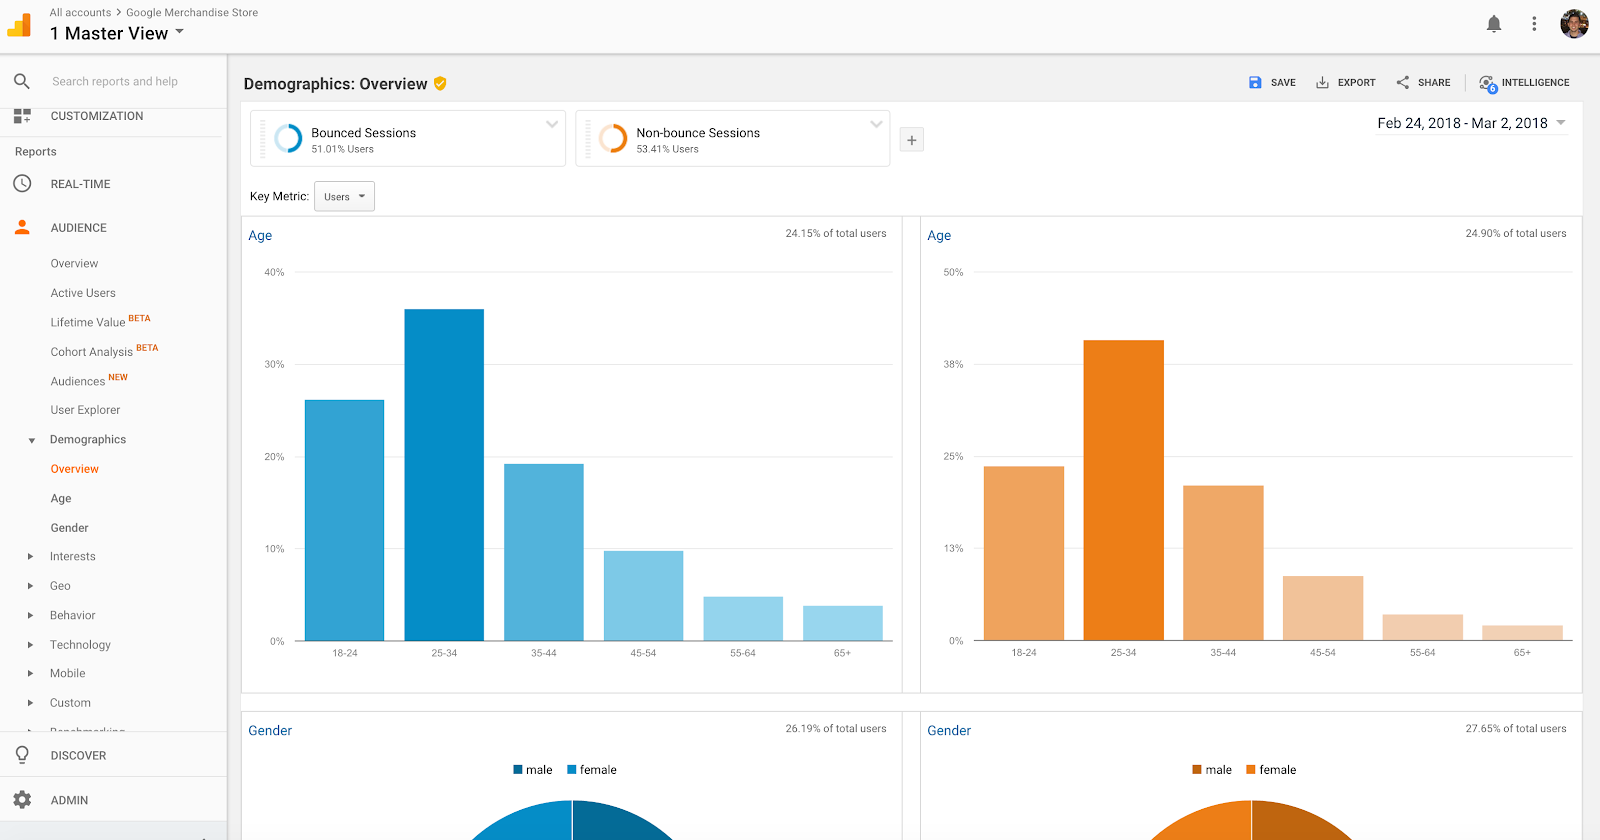
Note that you can explore any reports using these segments. For example, using the same two segments, we can look into their differences in terms of demographics (Audience > Demographics > Overview):
If you’re just exploring segments, it can be cool to just flip through different reports using different segments, just to get used to and explore the possibilities. With System Segments, it’s super easy, too. They’re already created for you. Go ahead and analyze some different segments (e.g. converters vs. non-converters, desktop vs. mobile traffic, etc.).
You can also build your own segments. In reality, most analysis you’ll do will be with custom built segments, not the system ones (that’s not to say the system ones don’t have value).
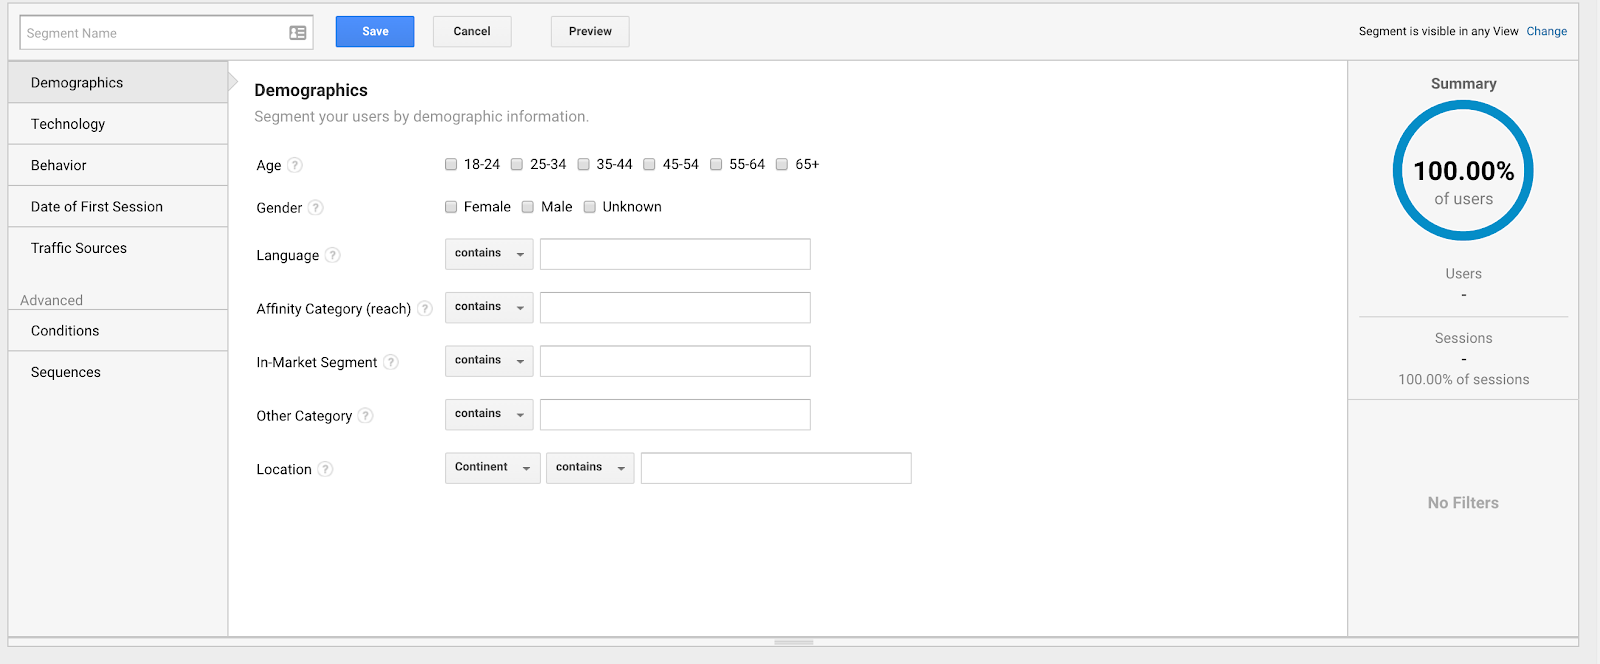
To build your own segments is quite simple. You go to the View Segments tab on any report (same as last time), though instead of clicking “System,” “Custom,” or anything on the left hand sidebar, you click the red button that says “+New Segment.”
One you’re there, you have a variety of options (including advanced segments, which we’ll cover in a minute). You can set up segments based on demographics, technology, behavior, date of first session, and enhanced ecommerce.
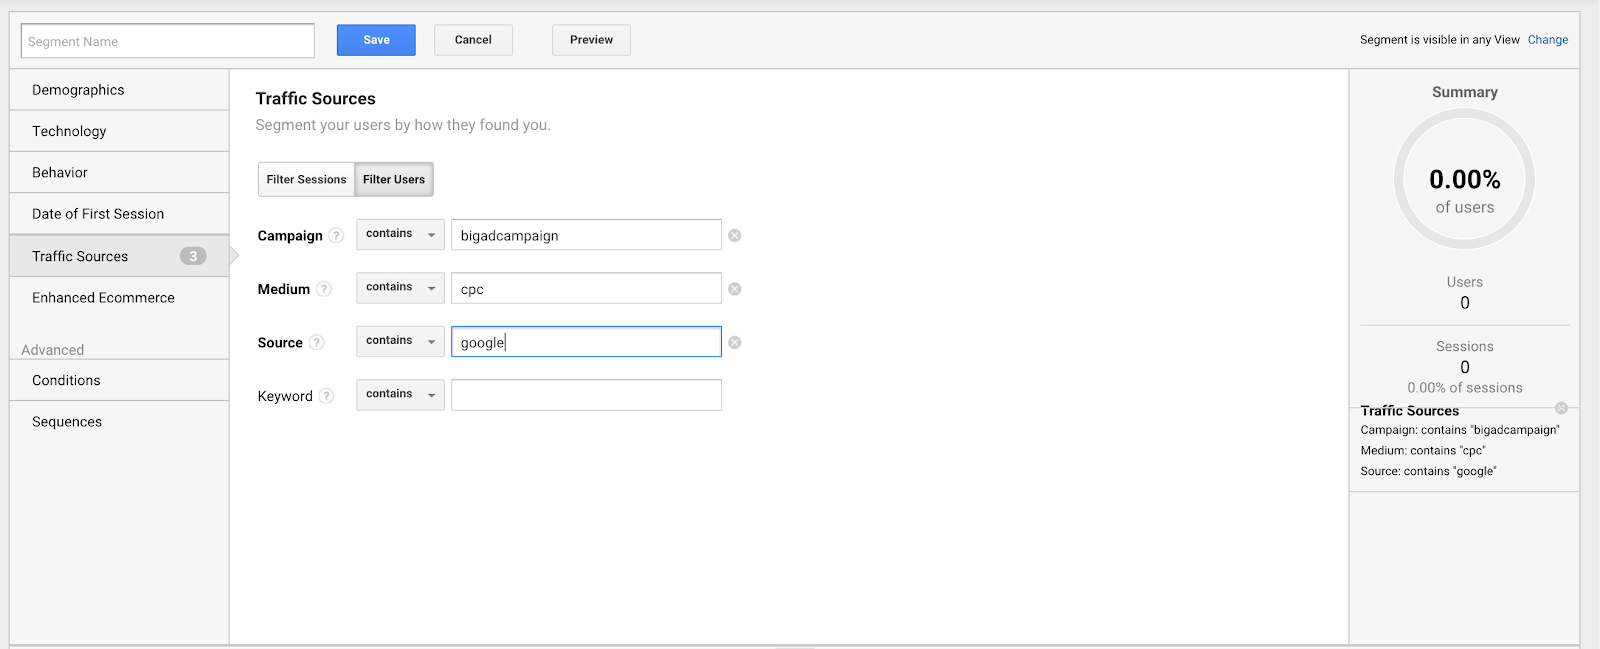
Let’s pretend you launched a big ad campaign using the following UTM tag: site.com?utm_source=google&utm_medium=cpc&utm_campaign=bigadcampaign.
You can analyze the traffic from said campaign by creating a segment with the following parameters:
Another example is analyzing the behavior of your highest value customers. Let’s say you get out an Excel spreadsheet, chop up some data, build out a histogram, and realize there’s a small subset of users that purchase far and away more than the rest of your users. What’s up with these outliers?
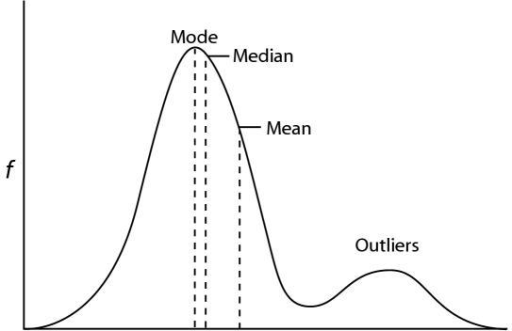
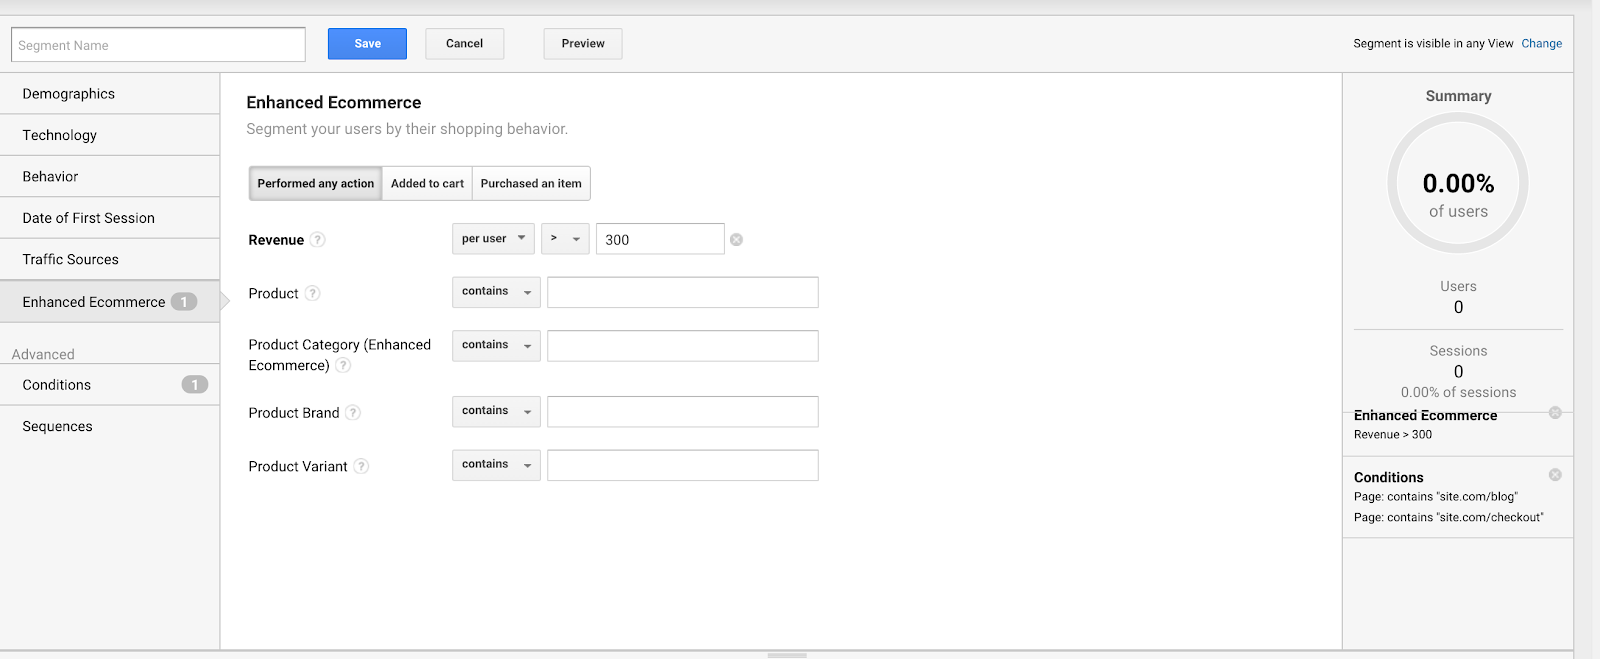
You run the numbers and find out anyone who purchases above $300 per order can be considered an outlier here. Now, you want to explore how they behave differently onsite. So you can set this segment up very easily:
Easy enough, right?
Again, play around with different segmenting possibilities before moving onto advanced segment. Though, that’s where the good stuff comes in, so let’s move onto advanced segments now.
Advanced Google Analytics Segments: Conditional
What are advanced segments? Essentially, they’re custom segments you build from scratch with the addition of AND/OR rules to create conditional and sequential segments.
What’s the mean, exactly? Functionally, it means you can get more specific on who exactly you’re segmenting. Technically, it means you can view users who have done this AND that, or this OR that, and you can even view segments based on the order they completed steps.
That sounds a bit abstract, so let’s walk through some examples, starting with conditional segments.
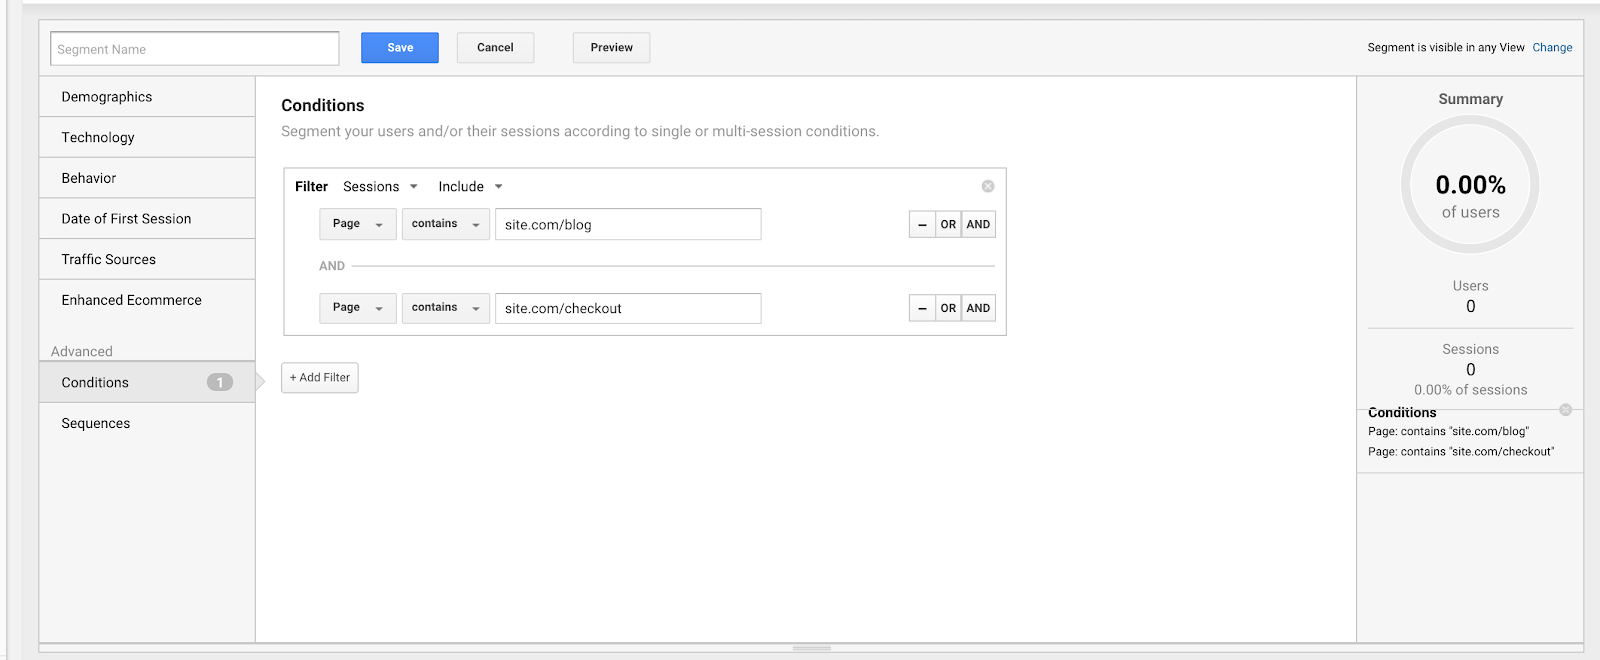
Conditional segments are advanced segments that include conditional logic, but do not include restrictions on the order in which those things occured. For example, you can set up a conditional sequence for users who have visited two site pages (e.g. site.com/blog and site.com/checkout), but it does not matter in which order you viewed those pages.
Now, this part of the segmentation world is where things get more complex, because they’re literally endless options for how you set them up. So, to be strategic, here’s something even more important. Otherwise, you can lose yourself in data exploration without purpose. Best practice is to start with a business question and explore data for an answer to that question. Let’s walk through a few questions doing just that.
Question: I noticed that visitors from our campaign who are more engaged (spend more time on page) spend more money with us. I wonder what’s different about their behavior?
This one is easy to set up.
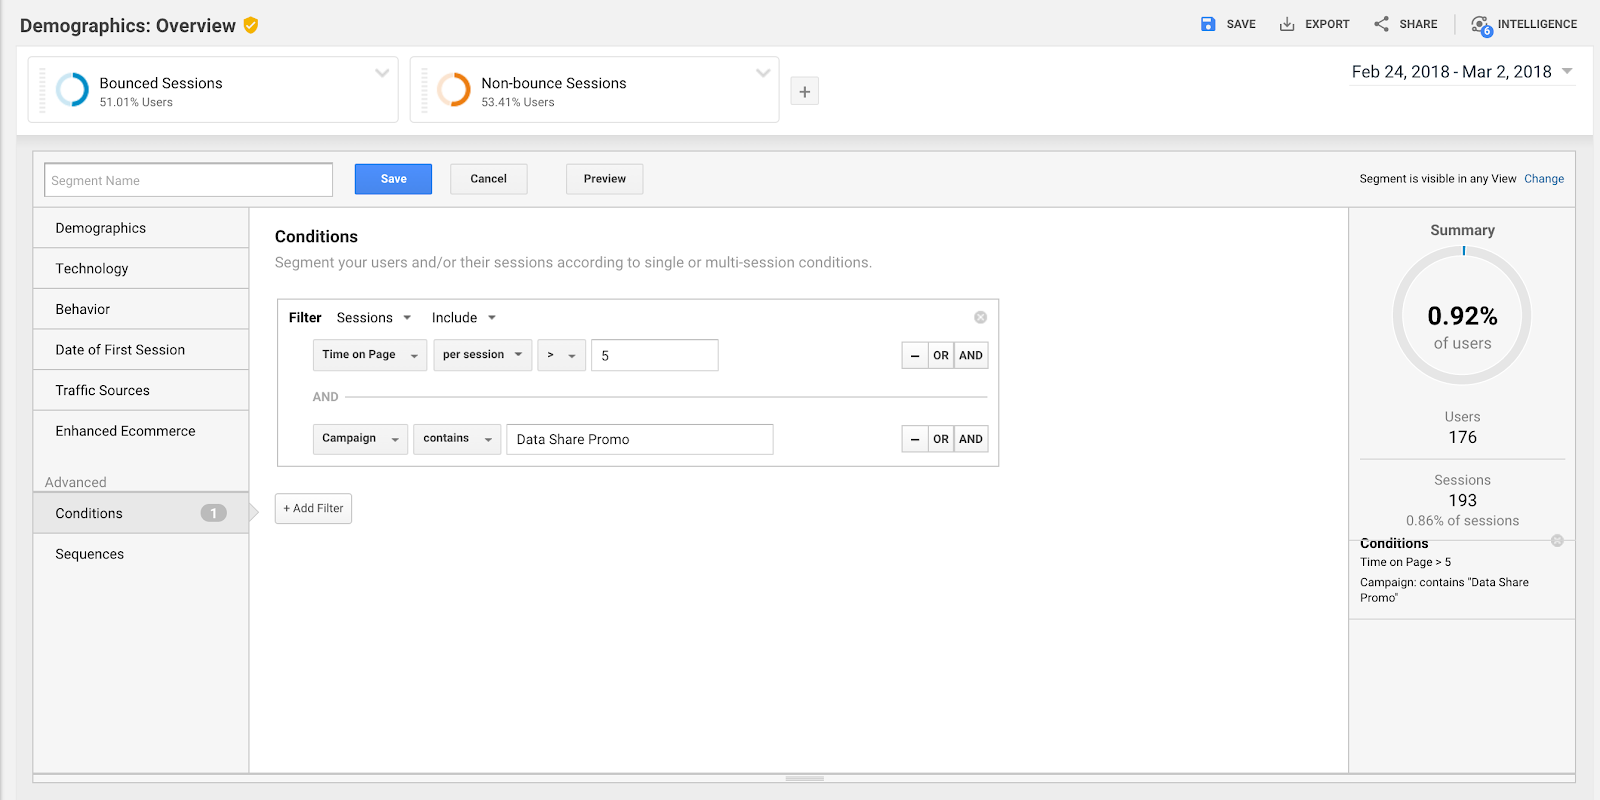
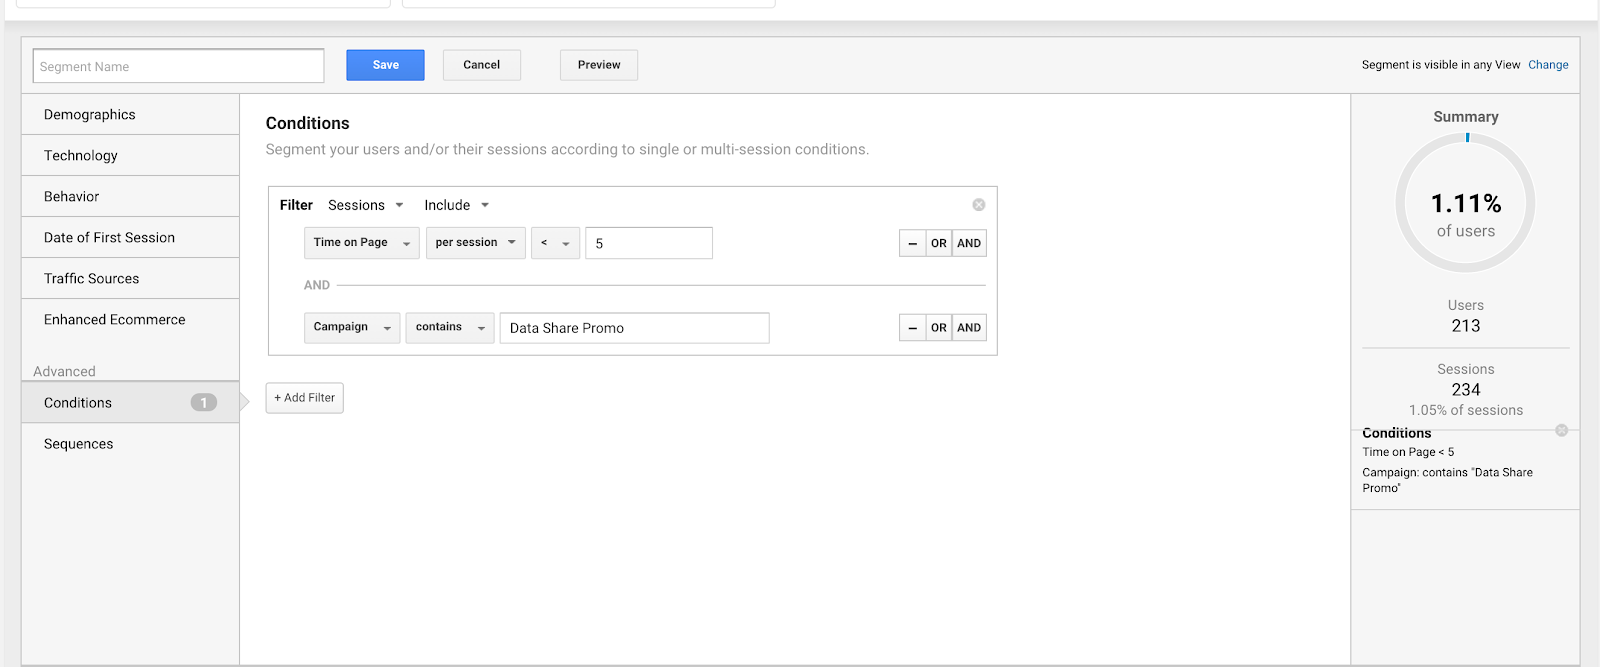
We want to explore the difference between two sets of users, both from the same campaign. The only difference is, we noticed that users who spend more than 5 minutes on page spend much more money than those who spend under 5 minutes. These aren’t profound insights by any means (you’d expect interested users to spend more time on page, right?), but they’re the beginning questions to what could prove to be fruitful user behavior data.
So, we’ll start by creating a conditional segment that includes 1) the campaign name, 2) an AND rule, and 3) a rule that includes users who spend > 5 minutes on page. This is what it will look like:
Then, we just inverse that segment, yet keep the same campaign. So, just change the time on page to < 5:
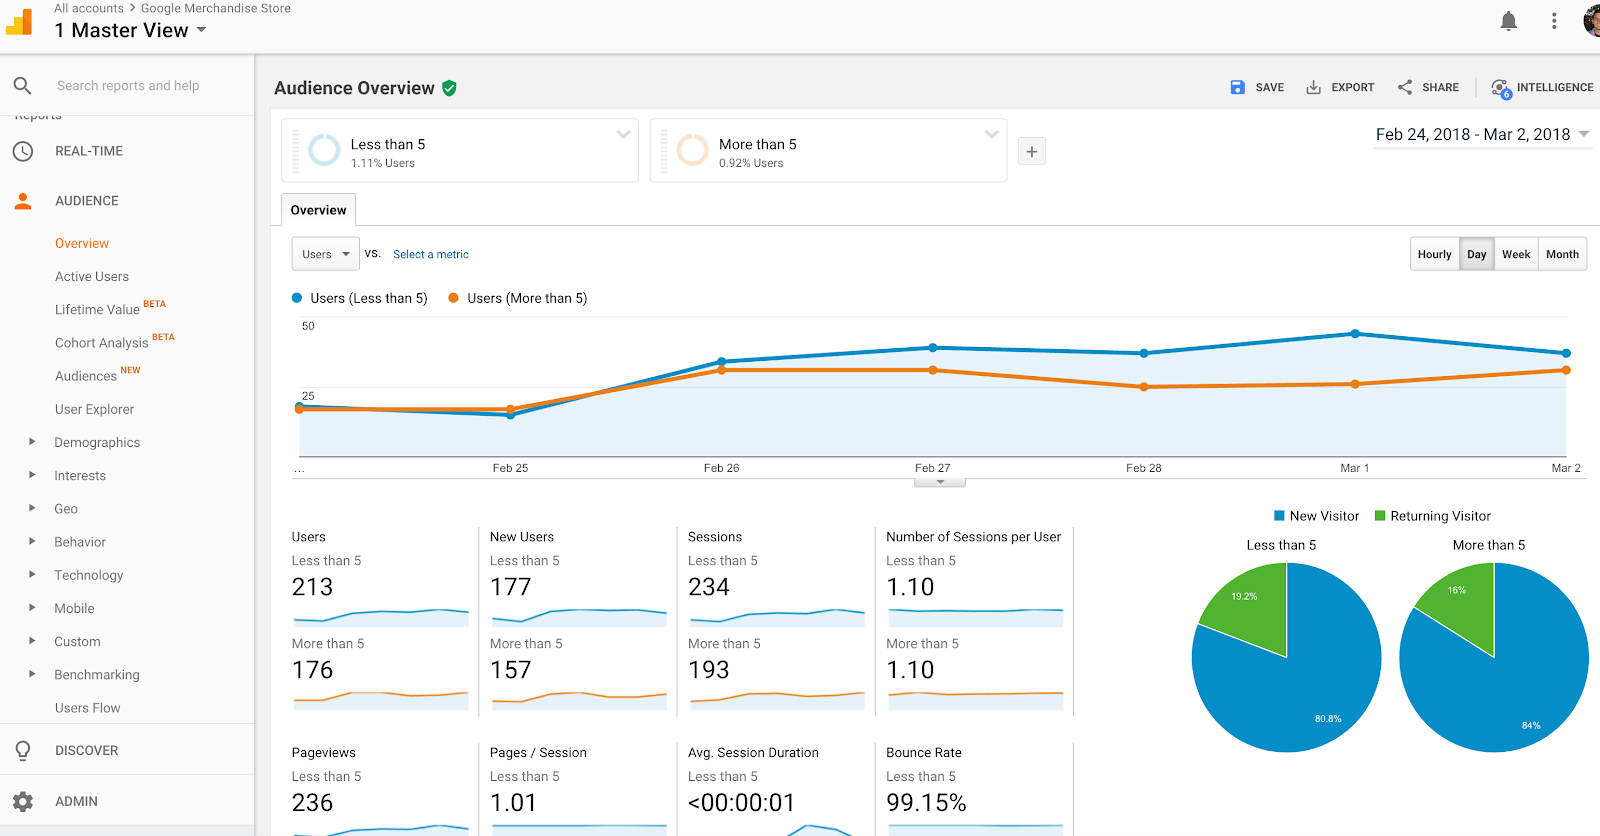
Then, you can view different reports using those segments as the lens. Here’s an audience overview report by those segments:
That example may seem a bit arbitrary, so let’s use an example that would be important for content marketing analytics.
Inquiry: I wonder how many non-users vs. users are looking at a particular page.
This one requires a bit of a setup, either through user ID tracking or at least via a particular page that only logged in users would see (the second option is much sloppier, though even the first isn’t 100% accurate do to cookie deletion).
But if you have your marketing website and software application on the same Google Analytics view, you can isolate who’s a user vs. a non-user.
As Mark Lindquist, Marketing Strategist at Mailshake, puts it:
“Most of the clients I’ve worked with don’t have their public-facing website and application separated, meaning all their traffic is tracked together.
This can really gum up your analytics, because your overall traffic/pageviews, conversion rates, etc. are being affected by your customers, I use segments to remove traffic that hits the ‘application’ page, so I can just focus on analytics around non-customers.”
As I mentioned, how you do this depends on your site setup and technical capabilities, but the way I’ve always done it is through user ID tracking. You can find a great guide on that here.
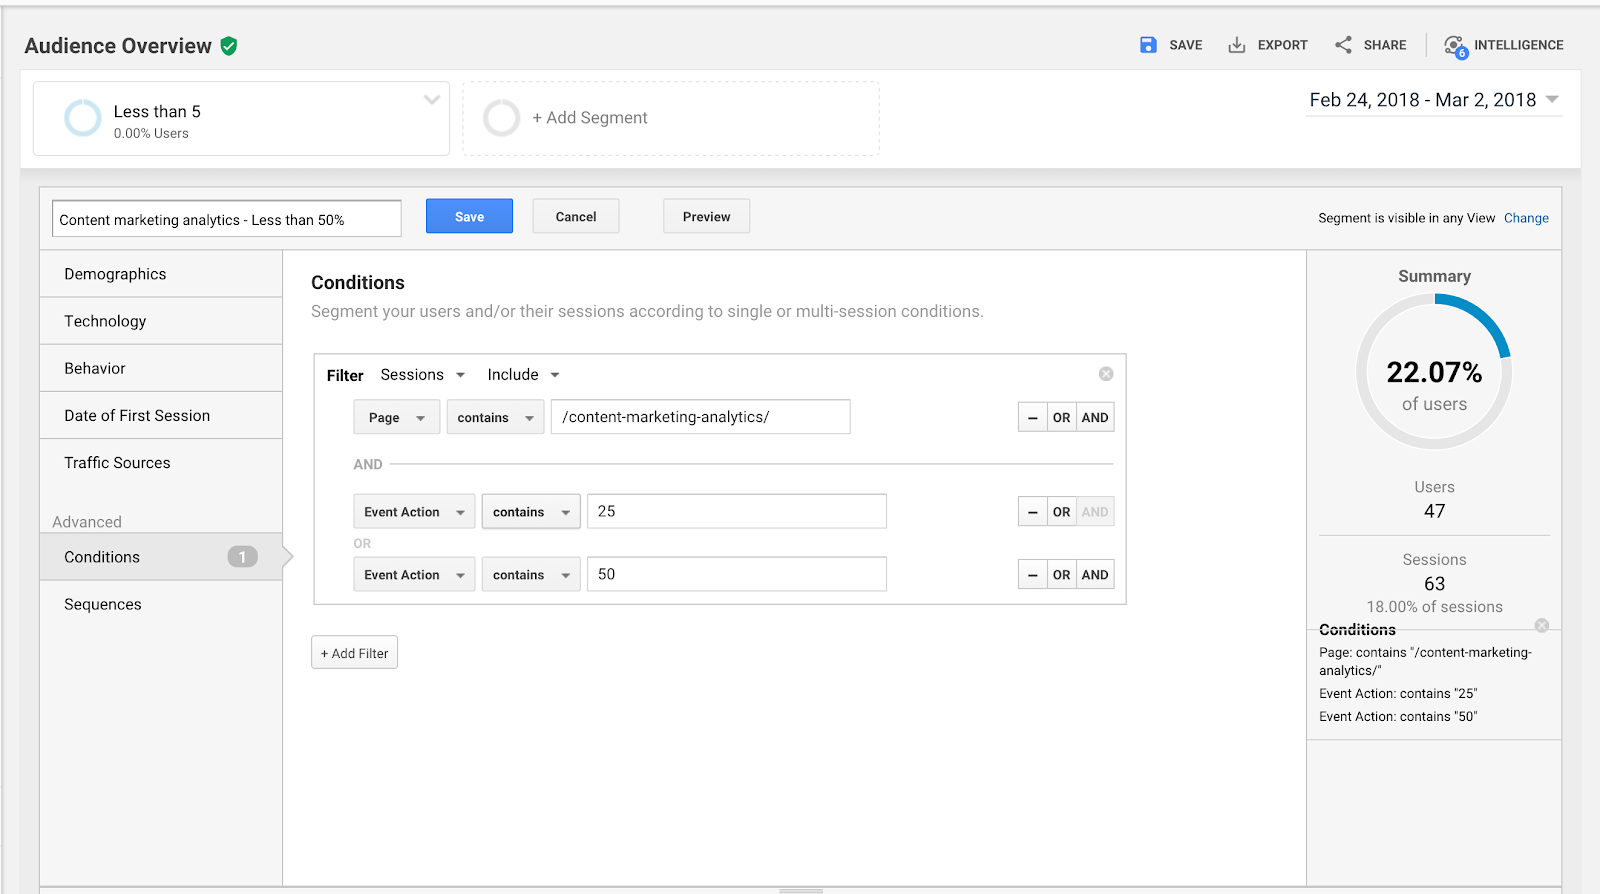
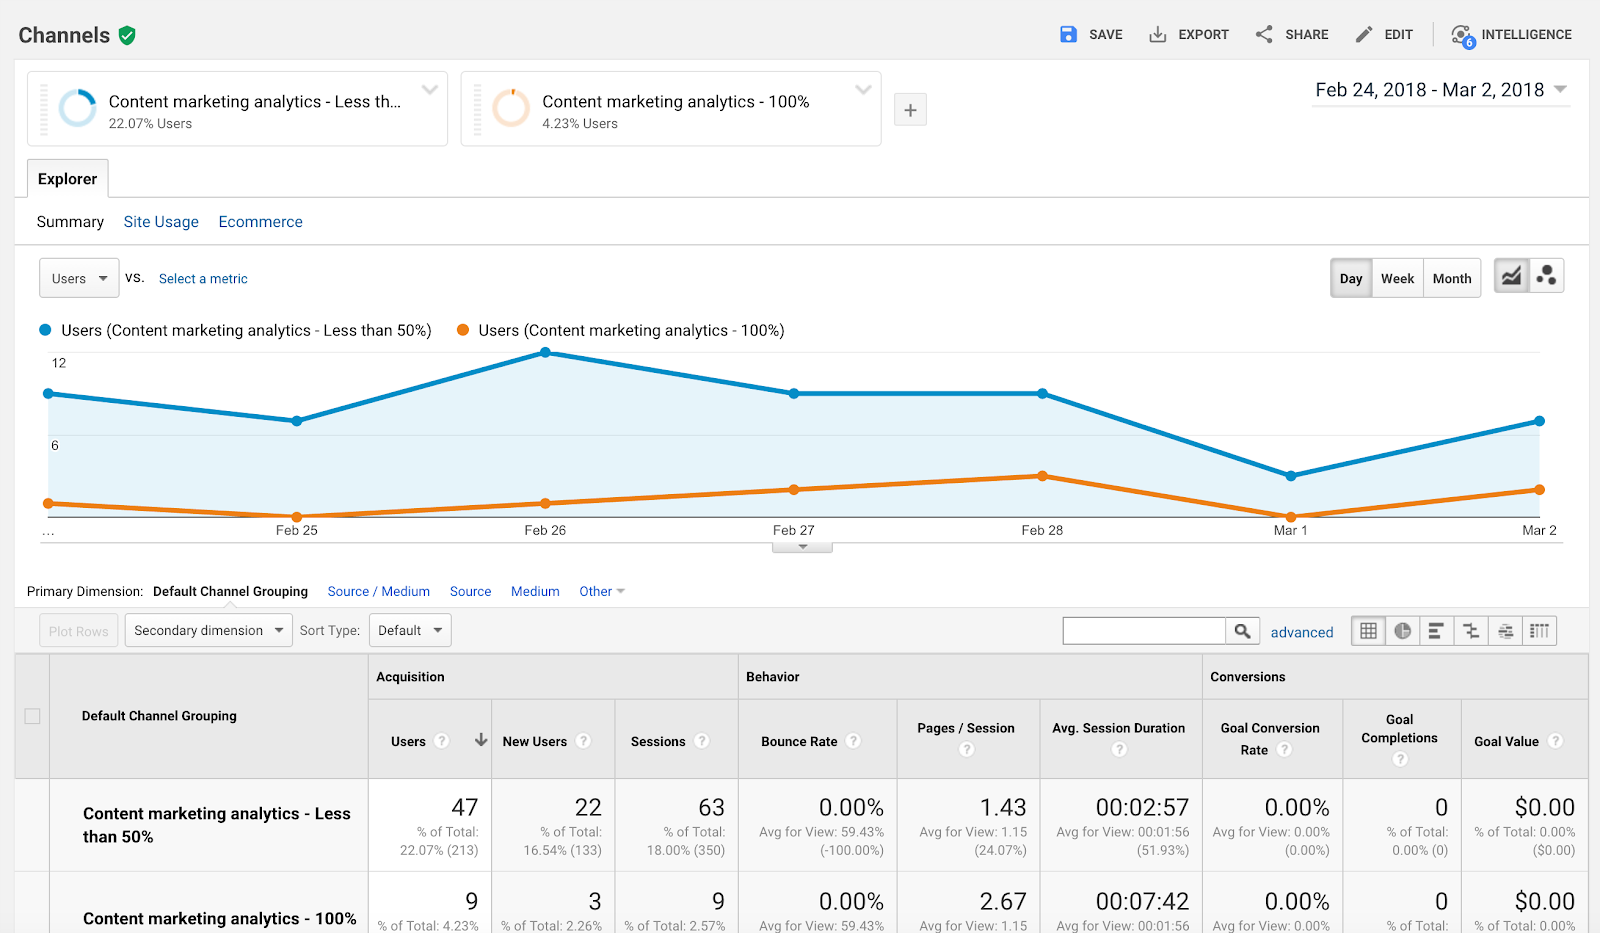
Inquiry: I wonder if there are any demographic or behavioral differences between those who finish our top trafficked blog post and those who reach less than 50% of the length of it.
This is a great question, because we can isolate the variable of content length (because we’re only analyzing one article), and we can see if there are indeed concrete differences between the most engaged users (who reach 100% completion) and those who didn’t make it halfway through the article (<50%).
Maybe their on-site behavior is different, maybe those from one source are more engaged than another, etc. All of this can inform your content approach.
This assumes you have scroll depth tracking set up. It’s also highly dependent on what you call your event actions and labels, etc. (here’s a good guide to read on event tracking).
Basically we need to isolate the page variable, which is easy enough to do. Second, we need to include event action labels of 25 and 50 (meaning the percentages). For simplicity, we’re going to ignore those who didn’t trigger an event at all due to bouncing right away or otherwise. The segment will look like this:
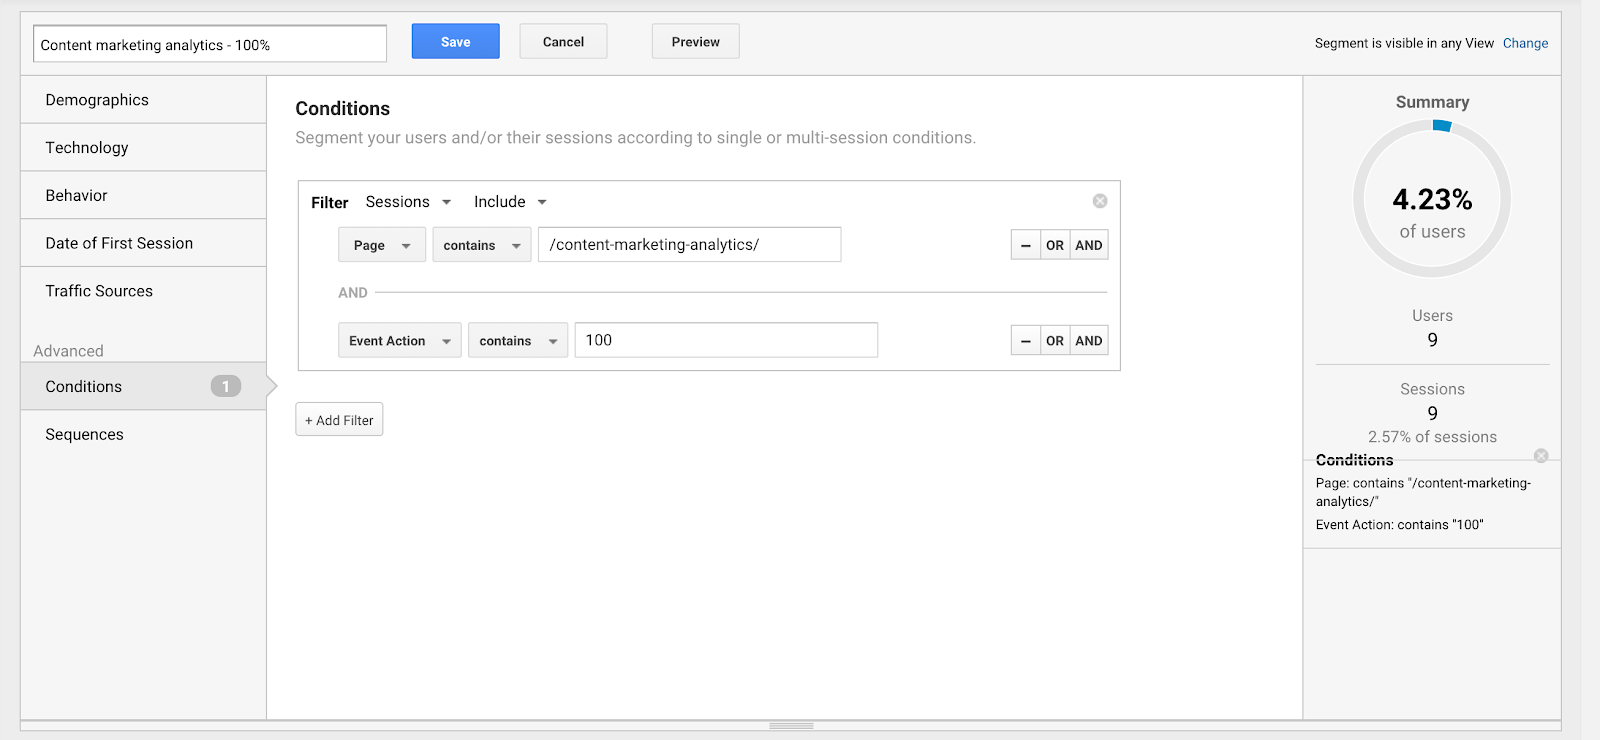
Now we’ll create a segment of only those who have completed the entire article in question. For this, we only need to change the second rule, that of the event action. We just need to change it to be “100”:
Now we can compare the difference in acquisition sources for these two segments (Acquisition > All Traffic > Channels):
Okay, so let’s move onto one more example, this one combining a few parameters.
Question: we have this high converting landing page, but it’s got multiple CTAs. Which one is more effective at driving paid conversions?
For this one, I reached out to Christopher Nolan, Conversion Optimization and Growth Manager at BigCommerce. Here’s how he explained it:
“GA's default reporting is useful for understanding where users come and go, and how long they engage with your site--but it's relatively ineffective at filling the gaps within the user's session.
For example: If it's a page with multiple CTAs, which CTA are users interacting with?
For those questions, segments are incredibly useful. The segment below has helped me to understand which CTA ("Learn More" vs. "Start a Free Trial") is more effective on one of our paid landing pages:
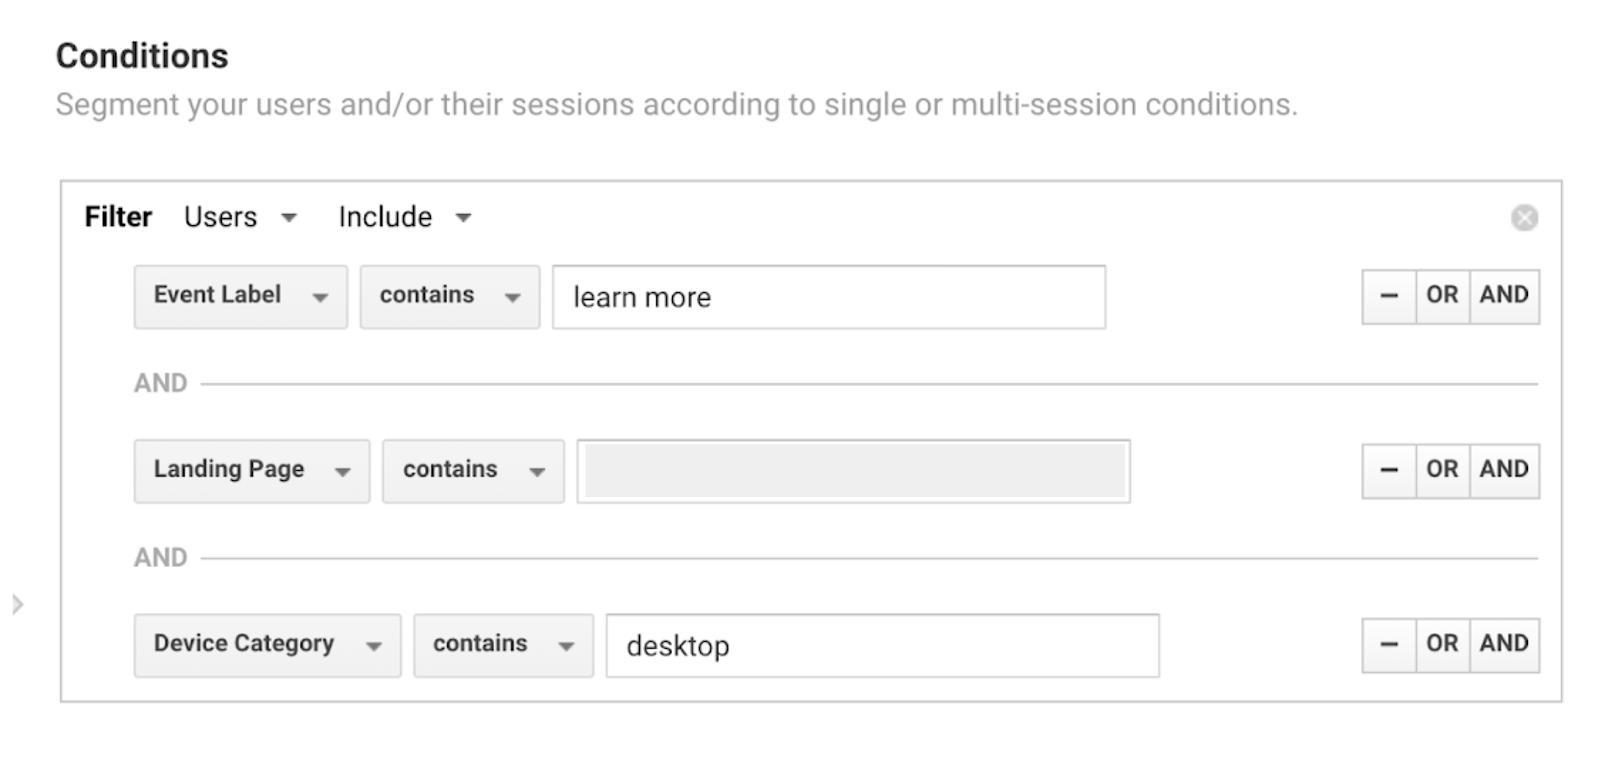
This example also helps illustrate how you can combine events, landing pages, device, etc. to understand behavior without needing to reconcile data from the events, landing pages, and device type reports.”
Advanced Google Analytics Segments: Sequential
The other feature of advanced segments is even cooler (in my opinion)--because in addition to the conditional logic you can use to cut up segments, you can also run conditional logic in chronological order.
This means you can view a user from X country who did these three action in sequential order. Now, the options are truly endless on how you can slice up your data.
Again, things get out of control with this level of complexity and chaos, so always start with business questions. Here are a few interesting problems we can explore and walk-through.
Inquiry: I wonder what’s going on with people who filled out the first part of our quote lead form, but didn’t finish.
For this example, I reached out to Christopher Nolan, Conversion Optimization and Growth Manager at BigCommerce. Here’s how he explains it:
“An easy example of how segments - particularly the "sequences" feature - have helped with our site optimization is their utility in dissecting the efficacy of a site's navigation and information architecture.
I sought to understand whether our navigation is meeting the users needs. In doing so, my primary question was two-fold:
a) Are users navigating in the way we'd expect them to given the layout?
b) Are their parts of the site that are not easily findable that are converting well, and how can we surface those pages more effectively?
To answer this, I looked at users who landed on our homepage and immediately navigated to one of our top level navigation pages. In the example below, I was trying to understand how many users navigate to our features page and then click to start a trial.
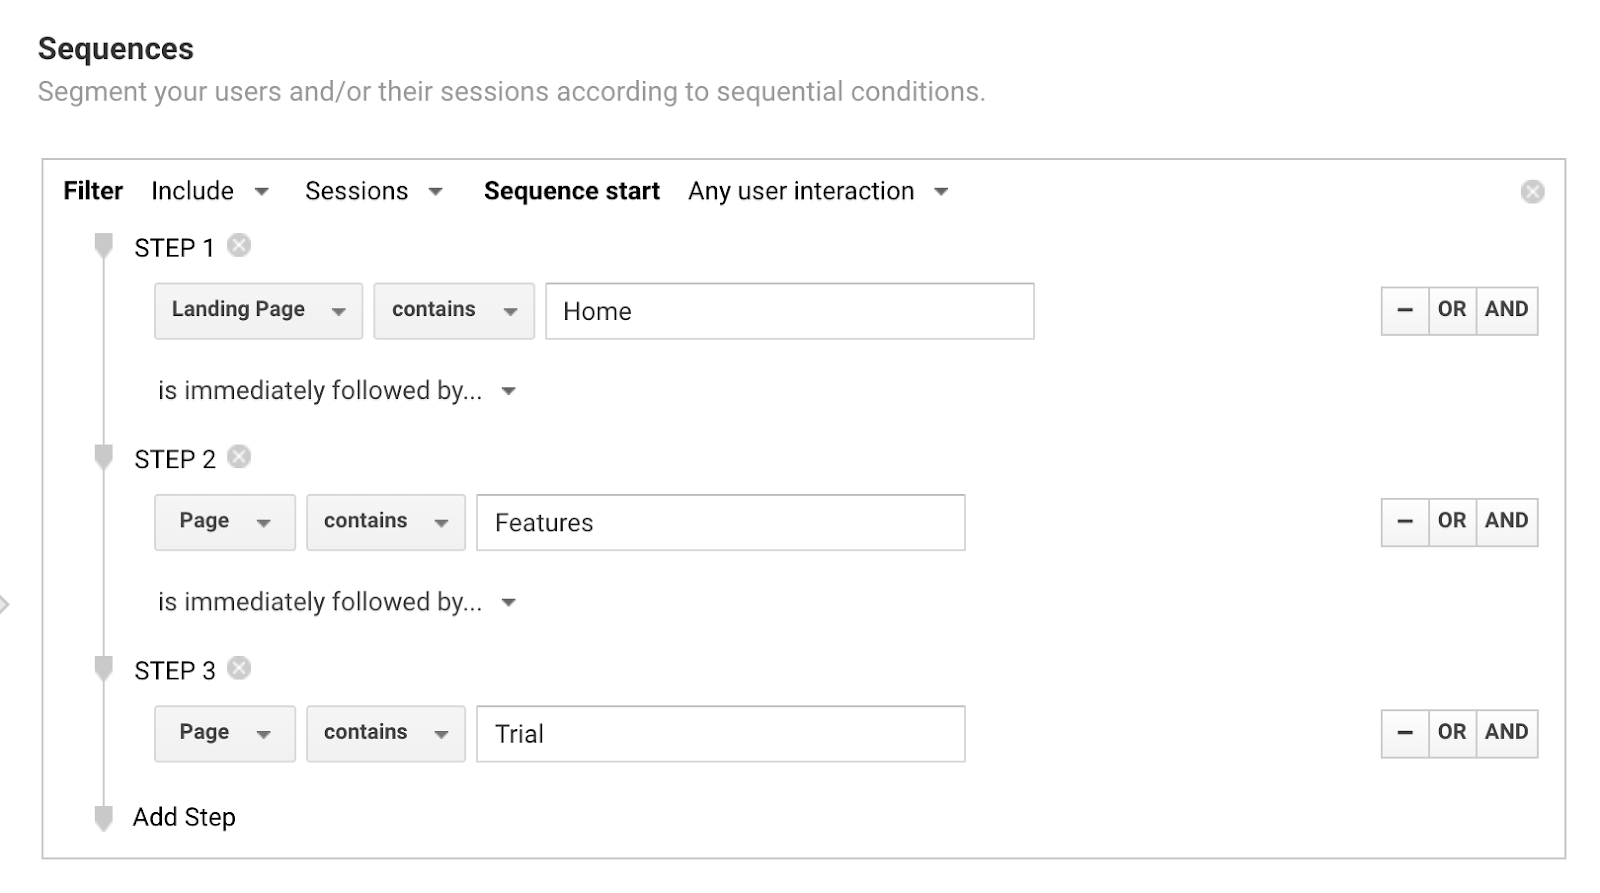
I also looked at users who continued navigating from features, to see if there were certain pages hidden in that section of the site that were not easily findable in our navigation but converted at a high rate.”
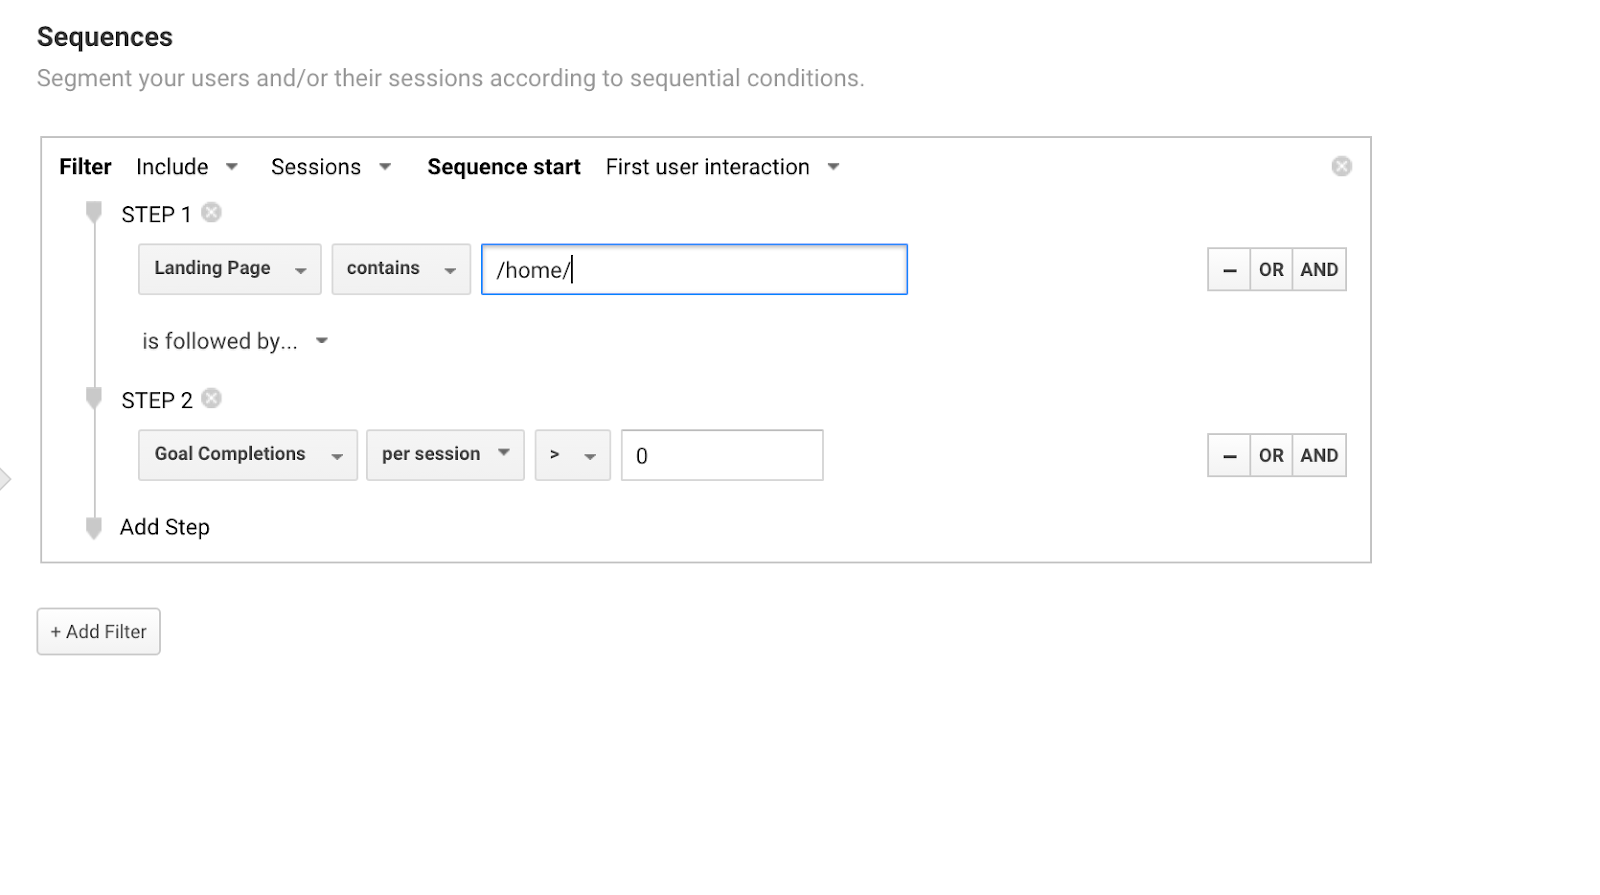
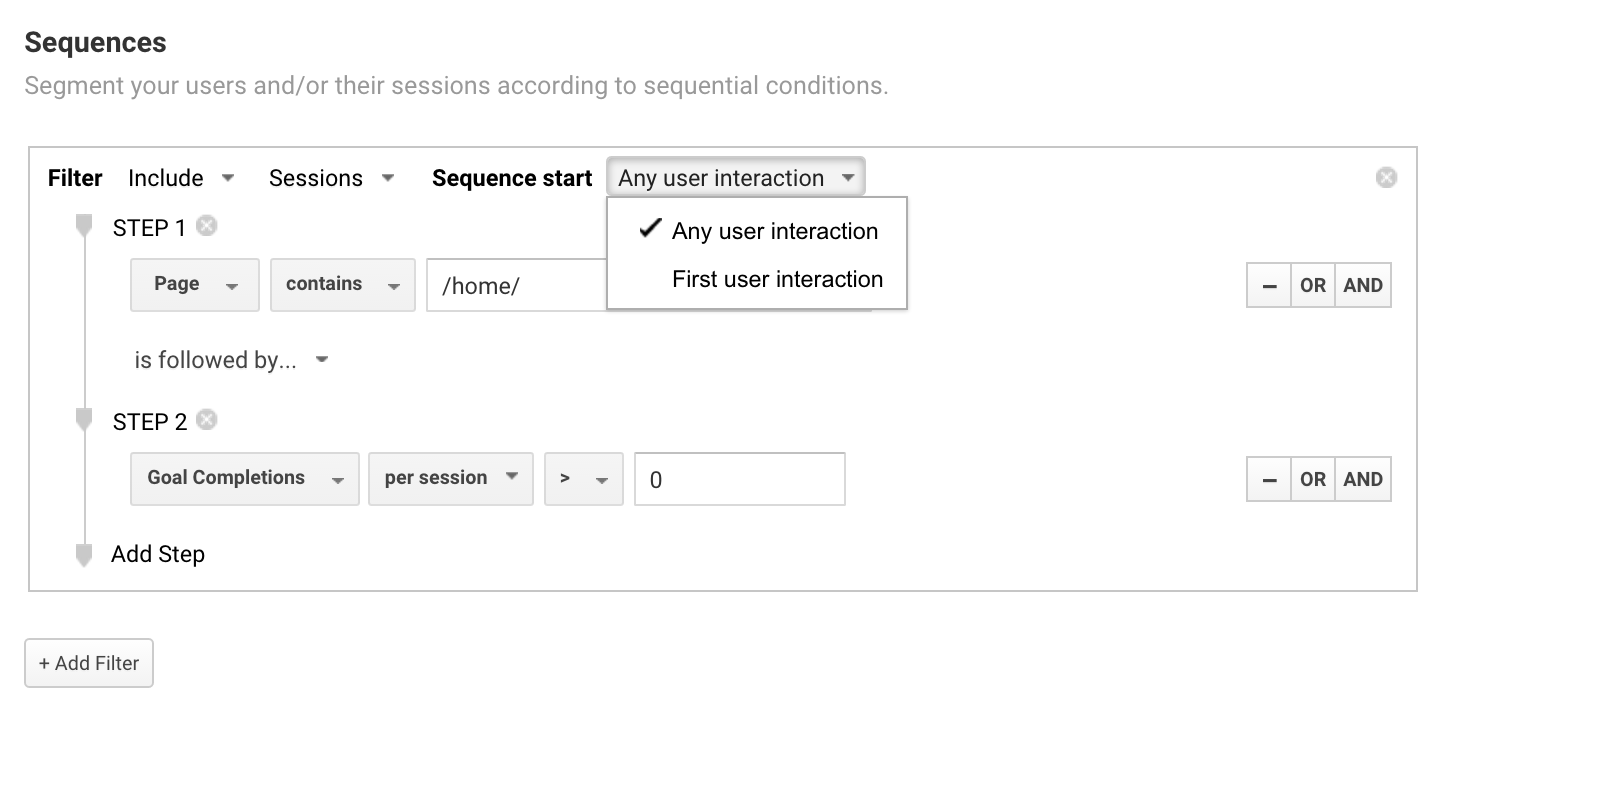
Inquiry: I want to see how people who land on our homepage convert vs. the aggregate conversion rate.
Easy set up here. We just need to set up a sequence where the first step is the landing page of our homepage and that’s followed by a conversion. It doesn’t need to be directly afterwards, but it needs to occur in the same session. It would look something like this:
Google Analytics Segments for Audience Targeting
Besides using segments for analysis and greater clarity on your users and their behavioral and demographic makeup, you can also use Google Analytics segments to improve your marketing, specifically in the case of PPC ads.
In fact, when you integrate AdWords and Analytics, it’s incredibly simple to transport GA segments over to AdWords for paid targeting, either using display remarketing or RSLA.
This can be incredibly helpful, especially when you start building out advanced segments. That’s when you can get into some pretty sophisticated abandoned cart retargeting, buyer’s journey specific targeting, and even non-commercial use cases like targeting people for recruiting and other purposes.
Basically, instead of just running ads based on rule-based targeting parameters, you can begin to engage website visitors that have exhibited different behaviors or characteristics. Here’s an example matrix Google put together to show how you could possibly approach remarketing audiences:

You can set these audience up straight from your AdWords account (great and clear instructions on how to do that here).
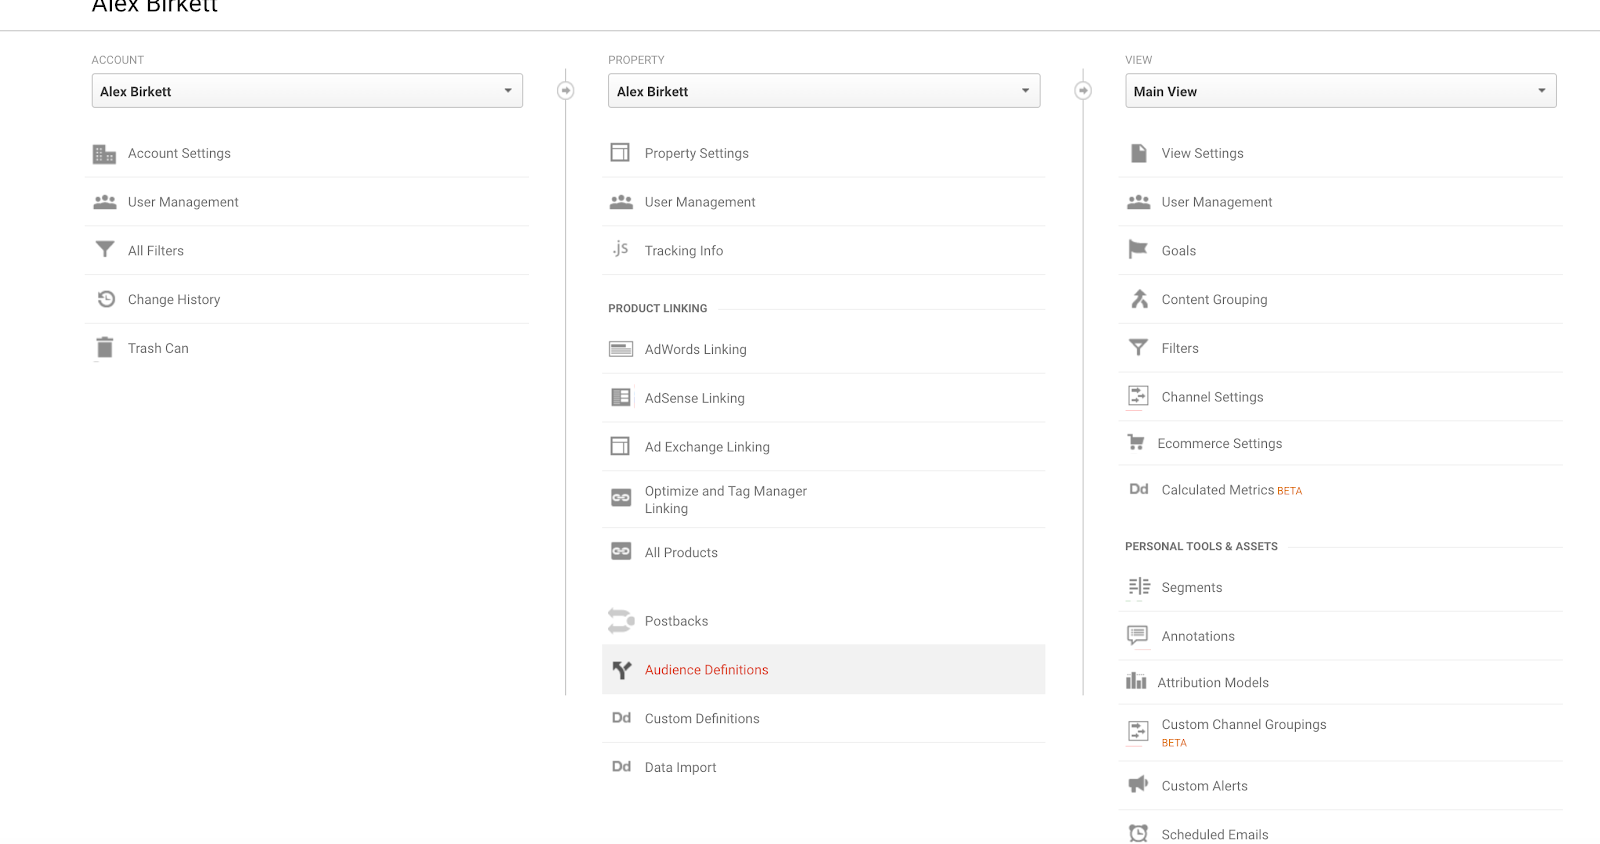
But I prefer to create the audiences from Google Analytics and send them over to AdWords. To do that, first make sure you’ve integrated your systems (KlientBoost article on that here). When that’s done, go over to your Admin section and find audiences (right in the middle):
Then, you’ll come to a screen with a nice obvious red button that says “New Audience.” Click that.

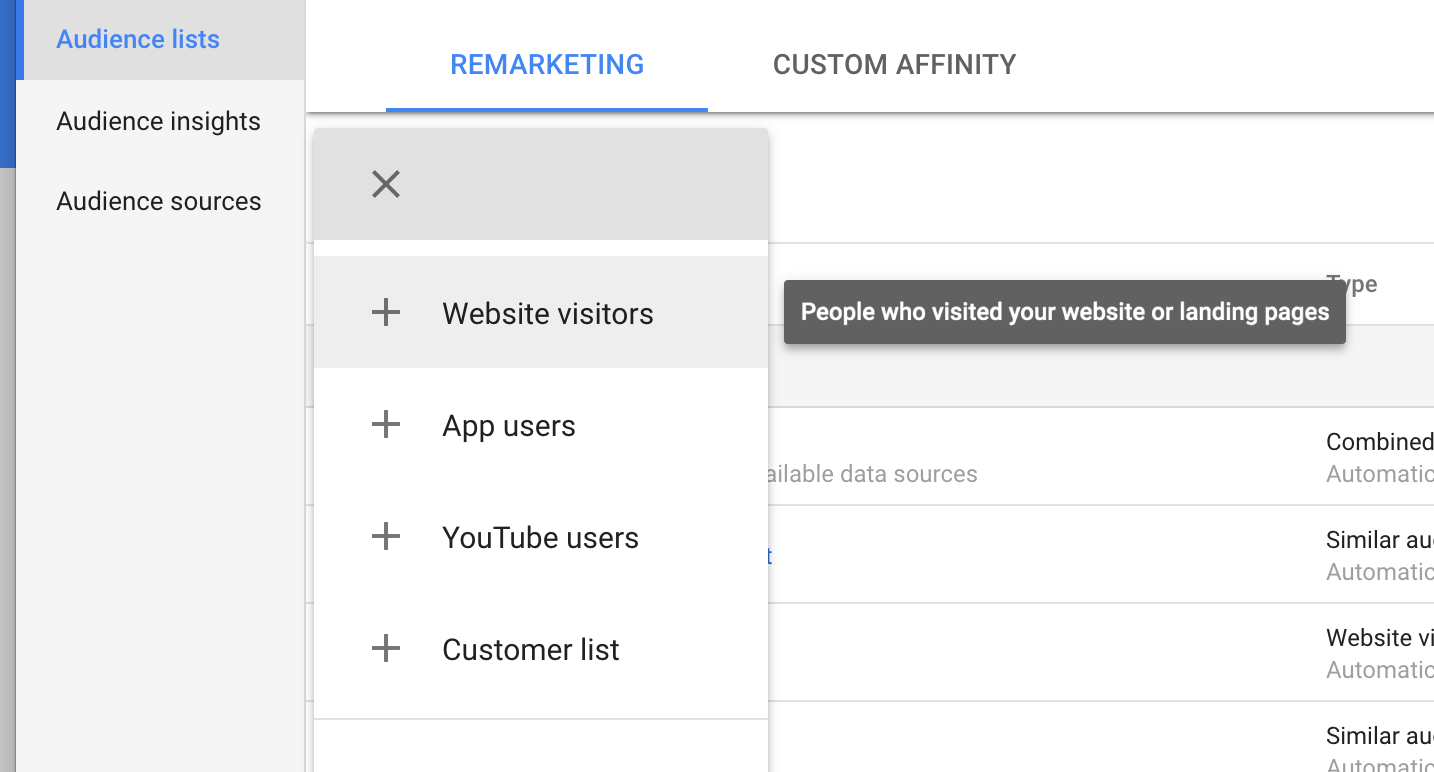
After that, you’ll get the following options. Choose whichever audience source you’d like (from whichever Google Analytics view you’re working from primarily), and then check out the audience definitions. There are a few more out-of-the-box options, like users who have visited a specific section of the site and those who have completed a transaction.
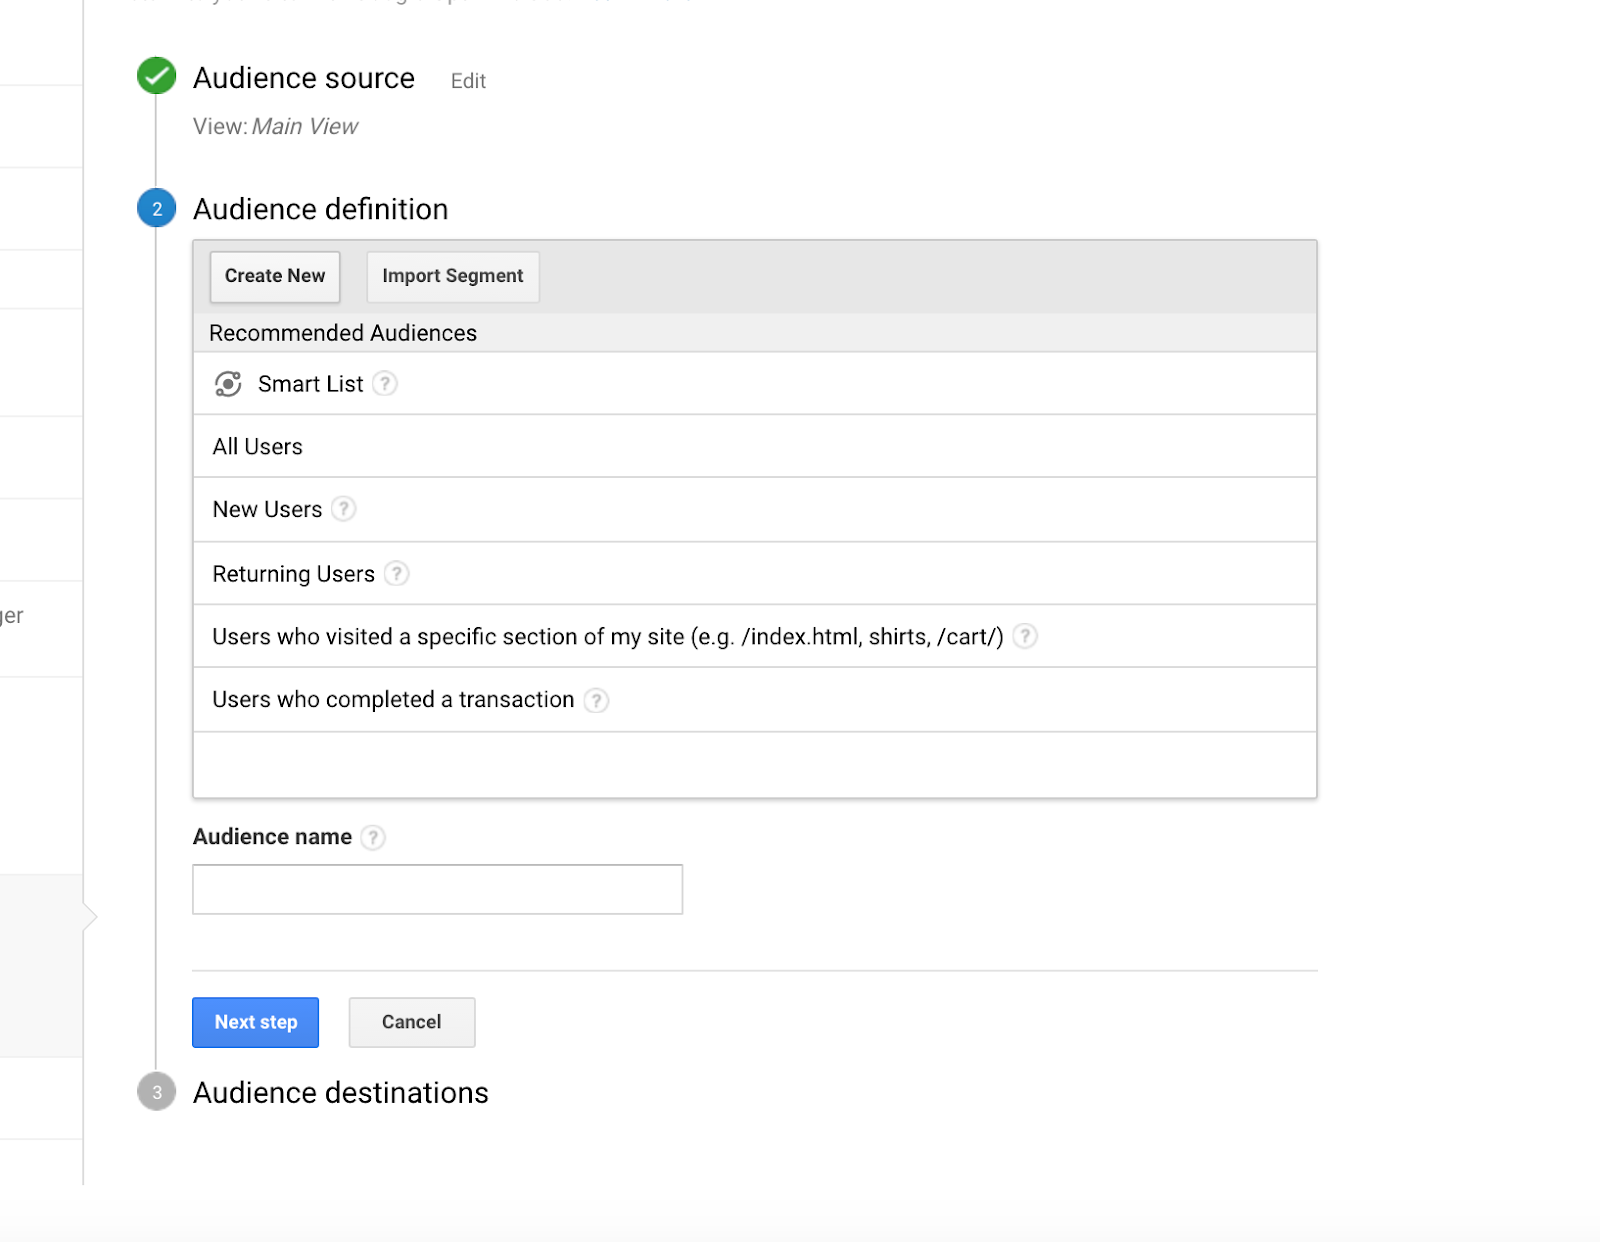
You can choose those if you want to stay within those bounds--but for fun, let’s click the “Create New” button. You’ll come to a familiar view:
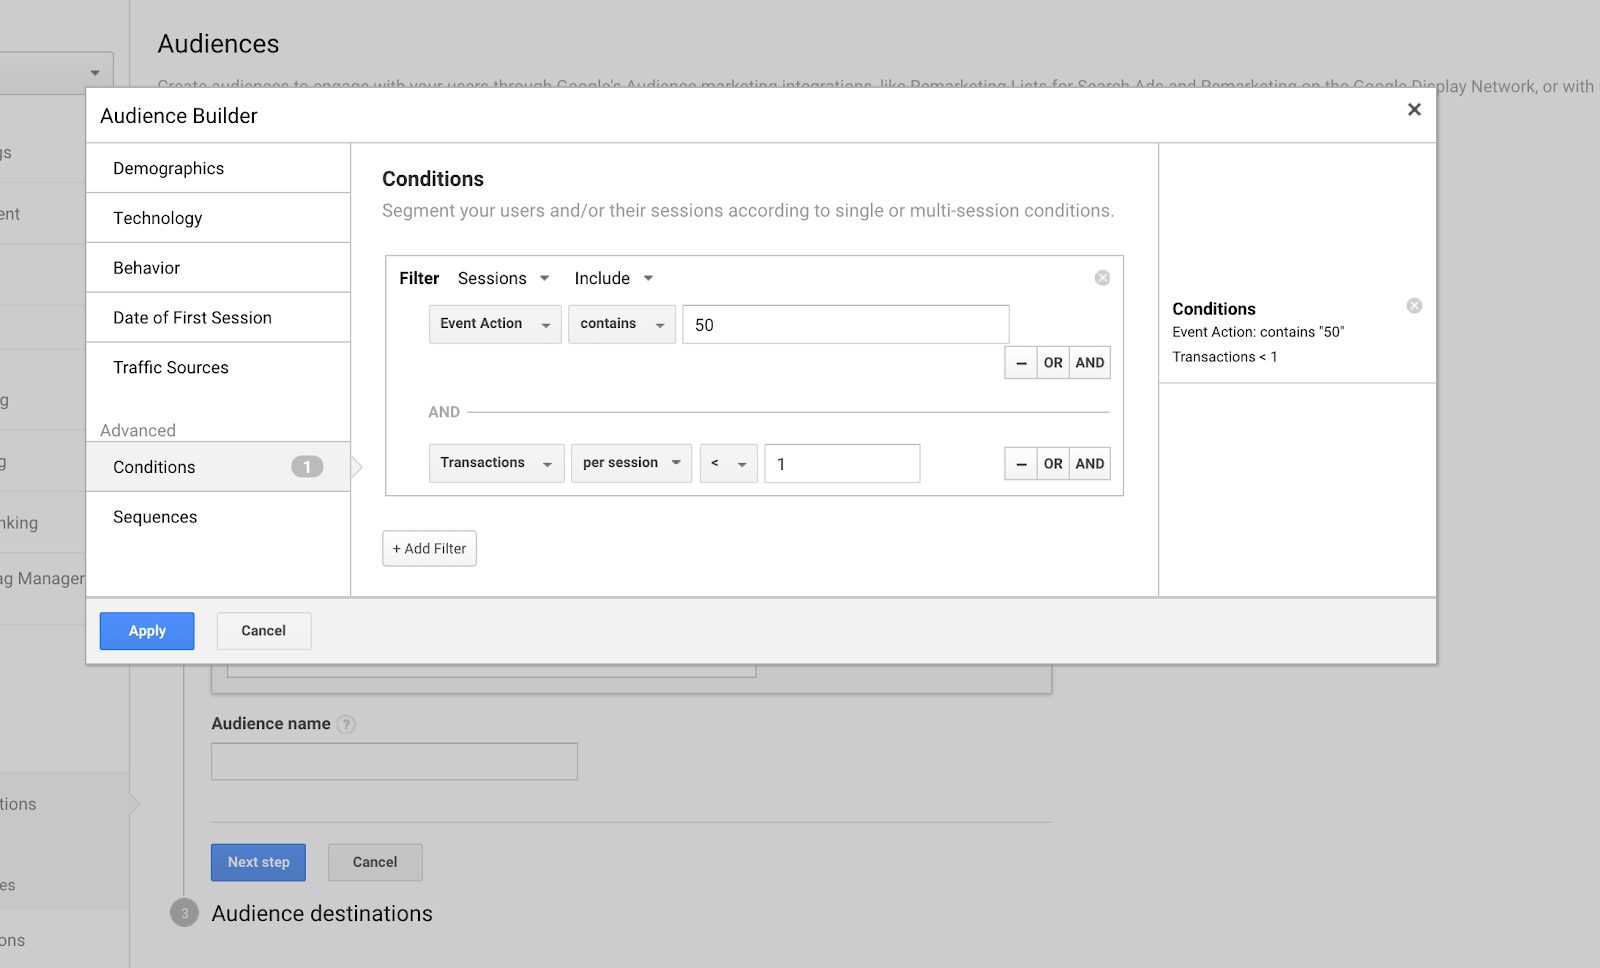
That’s right.
It’s just a Google Analytics segment builder, complete with all the options we’ve already covered. Here, I’ve created a random conditional segment, but you can choose pretty much any options that strike your imagination (or better yet, your business imperatives). When you’re done, click “Apply” and you’ll be brought back out to your options page:
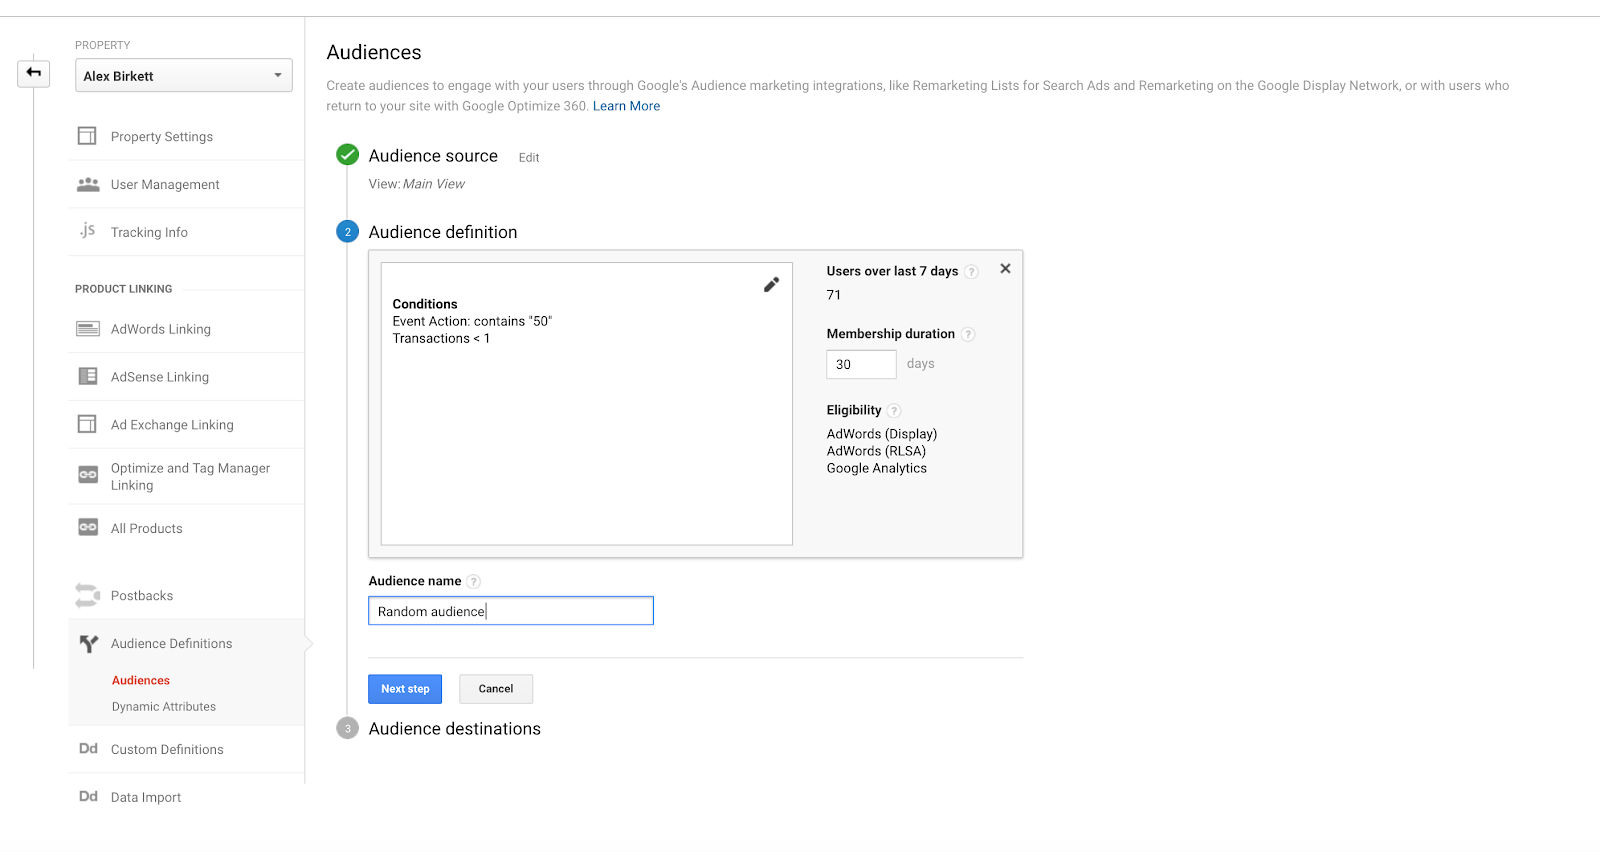
Once everything looks good, you just need to tell Google Analytics where to send this audience. For our use case, we’re sending it over to AdWords (again, to reiterate, you need to have linked your accounts).
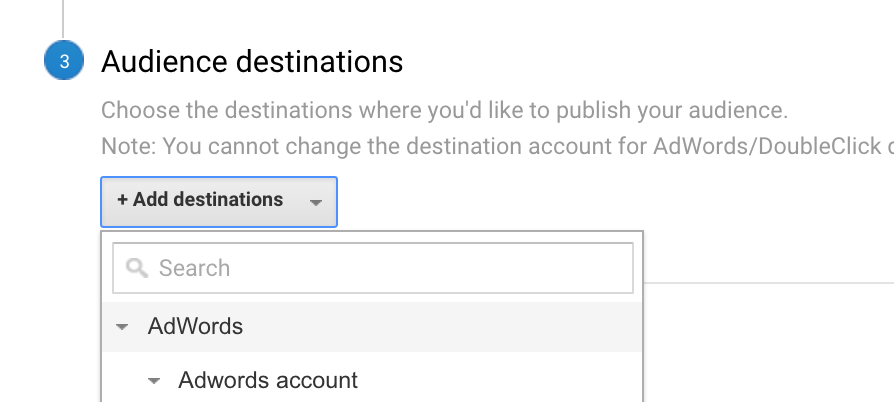
Now you’re good to go. You can then jump over to AdWords and use that audience for targeting.
Google Analytics Segments Mistakes & Guidelines
Another use case for segments is to go deeper in your A/B testing analysis.
Often times, an insignificant test can hold value when you analyze the segments and realize one segment was massively positively affected while another negatively affected segment balanced it out. This is valuable information, especially when you start to think about personalization.
While I don’t want to discourage you from looking into your segments after an A/B test, you should still adhere to statistical best practices.
By that, I mean that you still need to hold the same assumptions true for your segments that you did while setting up your experiment -- sample size, effect size, etc. -- in the first place still fit in when analyzing segments.
Specifically, the more you cut up your data, the more you run into the multiple comparisons problem.
Here’s how Dr. Julia Engelmann, Head of Data Analytics at Konversionkraft, puts it:
“The probability of error increases exponentially the more segments you compare to one another. Consequently, you should avoid going randomly through all the segments you can think of. They should always remain interpretable, exploitable, relevant to your test concept.
Additionally, you should take care that the segments are adequately large enough.
If, for example, only those visitors are included who access a category page with their tablet, go to a product page, are female and purchase on weekends, this will lead to seeing only a fraction of the visitors. Therefore, always be careful that the test size is also sufficient in the segments.”
Lots more technical information about the multiple comparisons problem in this article. Long story short, be careful shouting “winner!’ by going back and looking into segments, especially if they weren’t planned ahead of time and they’re small samples.
Jakub Linowski, founder of GoodUI.org, put forth a solid solution in a CXL article: reproduce the test on said segment. Here’s how he explains it:
“If the test was designed with a segment in mind, the setup usually has enough statistical power to allow a decision. If on the other hand, some signal is detected by slicing and dicing random segments, it becomes important to ensure that enough power exists (by extending the test duration or re-testing).”
If you don’t know beforehand that you’ll be breaking up your results into segments, launch follow-up tests for specific, well-performing segments until you get a proper sample size to figure.”
Another more general principle to keep in mind is to be detail-oriented when you’re setting up your parameters for Google Analytics segments. Small changes in whether you’re defining things by sessions or users matter a lot sometimes.
Here’s how Johannes Mehlem, Sr. Web Analyst at HubSpot, explains it:
“Be aware of the difference in count of Sessions vs. Users. "Sessions" means it really only filters for behavior that occurred during a given visit, while "Users" takes the lifetime of a user's cookie as basis.
In practice, a Sessions-based count is more of interest to really understand granular behavioral patterns, while a Users-based count is usually more telling for broader analysis and research and how people behave over time and several visits.”

The same rule applies when you’re thinking about how to set up sequences. There are a few parameters you need to consider and nail down to get accurate segment. Here’s Johannes explaining:
“Also important is whether stages of a sequence can happen at anytime during a session ("Any user interaction") or does the first stage of the sequence also need to be the first action during a session ("First user interaction")?
A sequence requiring its first stage to be the "first user interaction" can potentially be a cleaner indication of the user's intent as you are cleaning for general "flow-through traffic.”
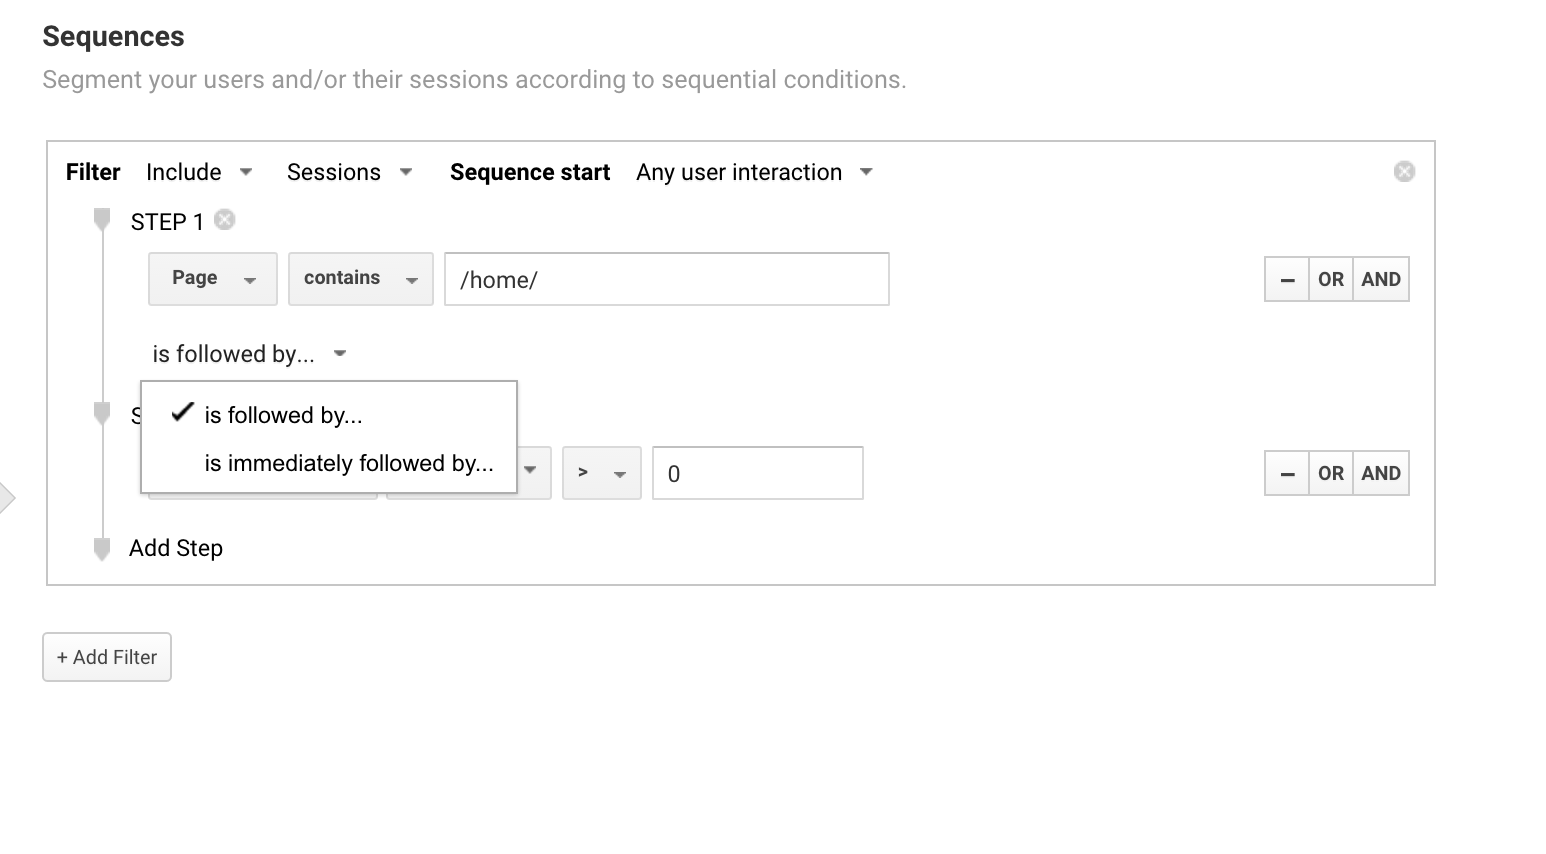
Another similar point when building sequential segments: you need to set the “tightness” of the sequence (i.e. whether or not a step is immediately followed by another). Here’s what that means (according to Johannes):
“Immediately followed by it is the next hit, which is usually an event or a pageview and commonly most relevant when building a sequence for a session.
Be aware here that 'is followed by...' can mean that there are many other things happening in-between two stages.
The more restrictive filtering, which lends itself to marketing funnels is to select 'immediately followed by...'.
All of these considerations above are really important as the results they yield can be very different.”
Wrap Up On Google Analytics Segments
If you stick to looking at data in aggregate, you’ll miss out on most of the interesting and valuable insights that Google Analytics segments have to offer.
Even worse, your paid advertising will be left to what is basically a spray and pray methodology; Google Analytics segments allow you to target ads based on on-site behavior, creating an ultimately better experience for everyone.
It’s pretty easy to get started with segments. Google Analytics provides many basic examples right out of the box.
And as you age in data maturity, you’ll find that you’re approaching most of your analysis using some form of segmentation. It’s simply a result of aggregate data’s limited use case in revealing any deep insights. The gold really is in the segments.