


I wish someone had laid out a list of Google Analytics tips or best practices when I started in digital marketing. See, the interface seems quite intuitive when you dive in and it’s easy to click around, so you’re fooled into thinking that Google Analytics itself is largely straightforward.
Well, that’s usually not the case. There are many ways to fail with Google Analytics analysis.
No matter how many guidelines and heuristics you follow, you’ll surely still hit walls and discover inefficiencies in the system. But hopefully, if you study some hard-fought Google Analytics tips to start, you’ll avoid the most damaging mistakes.
That’s where this article comes into play. I’ve organized 25 Google Analytics tricks and tips learned from many, many hours of time spent in the tool and discussing GA as well as data in general with analysts (a fun cocktail party conversation, I must say). These google analytics tips for beginners will turn you into a pro by the end.
So, let’s get you up to speed with the insight gathered in those conversations...
- Google Analytics Tip #1: Start with business questions
- Google Analytics Tip #2: Set up goals
- Google Analytics Tip #3: Map out your event tracking strategically
- Google Analytics Tip #4: Question your definition of bounce rate
- Google Analytics Tip #5: Set up funnels
- Google Analytics Tip #6: Review horizontal funnels
- Google Analytics Tip #7: Integrate Google Analytics with your testing tool
- Google Analytics Tip #8: Utilize custom segmentation
- Google Analytics Tip #9: Learn RegEx
- Google Analytics Tip #10: Explore Google Analytics custom reports
- Google Analytics Tip #11: Automate your reporting
- Google Analytics Tip #12: Analyze website performance for tech fixes
- Google Analytics Tip #13: Set up your views correctly
- Google Analytics Tip #14: Implement Google Analytics accurately
- Google Analytics Tip #15: Review cross-domain & sub-domain tracking
- Google Analytics Tip #16: Conduct a campaign tracking audit
- Google Analytics Tip #17: Configure custom dimensions
- Google Analytics Tip #18: Use calculated metrics
- Google Analytics Tip #19: Make use of filters
- Google Analytics Tip #20: Set up custom alerts
- Google Analytics Tip #21: Get past sampling limits
- Google Analytics Tip #22: Analyze data in R
- Google Analytics Tip #23: Use site search to come up with content ideas
- Google Analytics Tip #24: Integrate your pre- and post-purchase data
- Google Analytics Tip #25: Explore attribution models (...or don’t)
- Wrap Up on Google Analytics Tips
Get brand new analytics strategies straight to your inbox every week. 23,739 people already are!
Google Analytics Tip #1: Start with business questions
Digital analytics is a means of extracting insights that will translate into business value. To put that more simply, your analysis work should be driven by important business questions.
This will come as a slight contrast to the title of the article, but one of the top Google Analytics tips is that you shouldn’t just rely on guidelines or checklists; rather, it’s all about asking smart, important questions.
The mark of a good analyst isn’t an advanced knowledge of a tool’s interface, either -- though it does help to know where you’re clicking and what the screens mean.
It’s being able to step back and think critically, ask important business questions, and answer them with a high enough degree of precision in order to take action.
The challenges each business faces are quite unique. If you try to follow a formula or a best practice, you begin to have the illusion that you’re gathering insights--but you’re just taking the easy way out.
I think Avinash Kaushik put it best:
“You need business questions, because:
1. Rather than being told what metrics or dimensions to deliver you want business context: What’s driving the request for that data? What is the answer the requestor looking for? Then, you apply smarts, because you have context.
2. Best practices are highly overrated. If this is your first day on the job, sure, go ahead and puke out what “industry experts” recommend. But know that it won’t impress anyone, because you don’t actually know what the business is doing / cares about / is prioritizing.”
What are the right questions? It’s highly contingent on your business and your situation. I could rattle off important business questions that I’d like to know endlessly:
- Do customers that purchase X tend to purchase more products down the line? In any common order?
- What are the common on-site behaviors of our most valuable customers?
- What’s the marginal value of our display campaigns? How can we improve their impact?
- What’s the behavioral difference in cohort A and cohort B, since we made X changes to the product?
...and on and on. But lead with the question, don’t just “data puke” a report.
Google Analytics Tip #2: Set up goals
We can't cover Google Analytics tips without covering Goals. You can’t use Google Analytics if you don’t use goals.
You may think you’re using Google Analytics -- you look at your traffic numbers, you see your bounce rate and how it changes over time, you can discover what devices your audience is using. But if you haven’t set up goals, you’re missing out on 95%+ of the value that Google Analytics offers.
Setting up goals in Google Analytics forces you to take a strategic approach to your measurement. It makes you ask, “what’s the purpose of this site?”
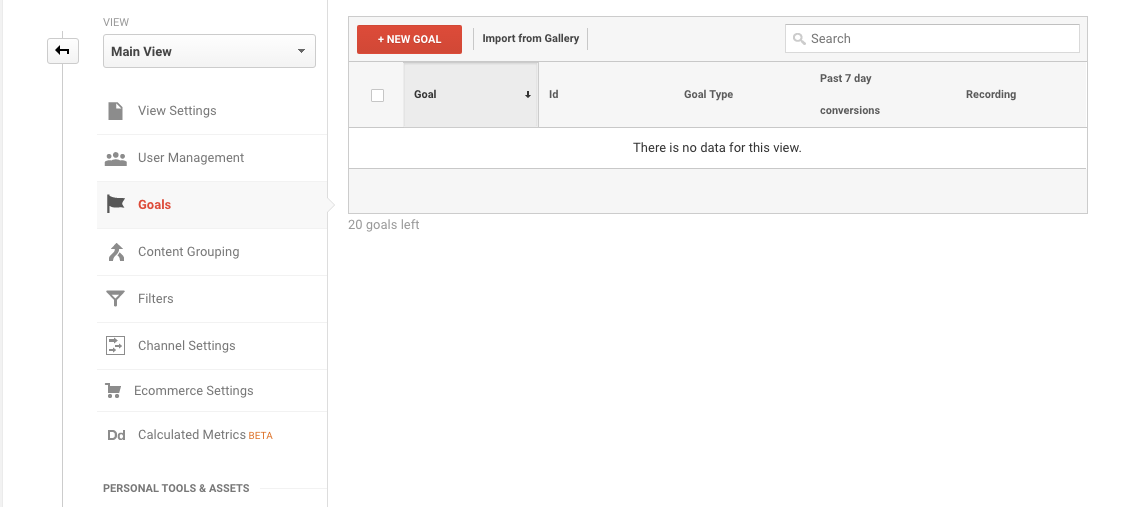
Luckily, it’s incredibly easy to set up goals in Google Analytics. Just log into your Google Analytics account and then:
- Click Admin, and navigate to the desired view.
- In the View column, click Goals.
- Click +NEW GOAL or Import from Gallery to create a new goal.
You have 3 basic options for creating goals:
- Using a goal template
- Creating custom goals
- Creating Smart Goals
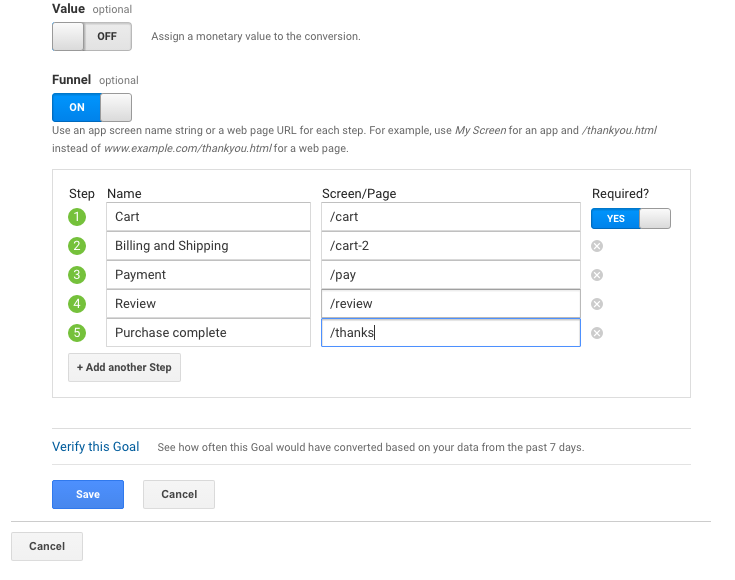
I won’t go too far into the different types of goals (here’s a great guide for that if you want to read more), but for basic and prototypical business cases, the goal templates tend to suffice. You can easily set up a Goal for a thank you page, for instance. Let’s pretend we’re doing that for an ecommerce site here:
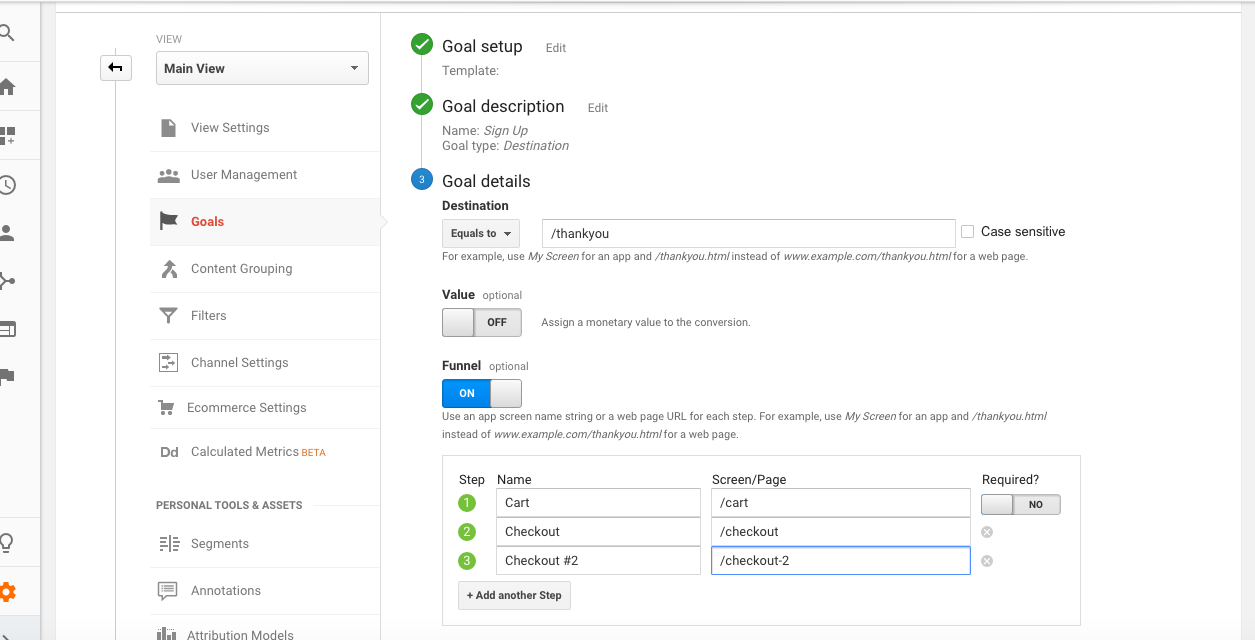
You’ll notice in the image above that I also added steps under “Funnel.” This is important, and can add a ton of value when you start thinking about conversion optimization. More on that later, though.
Think about what matters to your business and set up goals in Google Analytics to track for it.
Google Analytics Tip #3: Map out your event tracking strategically
Events in Google Analytics help you fill the gaps between traffic analysis and goal analysis. Essentially, they let you see nuance - what are users actually doing on the site?
Here’s the Google Analytics’ official definition:
“Events are user interactions with content that can be tracked independently from a web page or a screen load. Downloads, mobile ad clicks, gadgets, Flash elements, AJAX embedded elements, and video plays are all examples of actions you might want to track as Events.”
Once you’ve set up events, here’s what an example report may look like from within the GA interface (accessible via Behavior > Events > Overview):
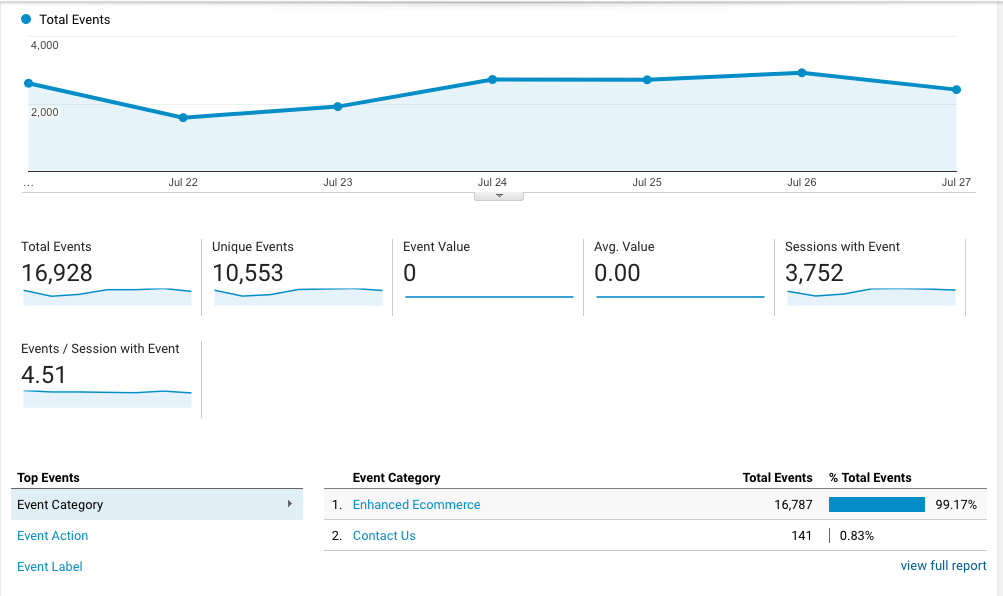
You’ll notice that there are three components that make up events in GA:
- Category
- Action
- Label (optional, but recommended)
For example, if you have a video on your homepage and want to track interactions with it, the following values could be in play:
- Category: "Videos"
- Action: "Play"
- Label: "Home Page"
Google Analytics events is a massive topic. It’s also a strategic one. It’s an area where, again, you need to step back and think about your business goals. What user interactions matter to your site? Perhaps, it could be that users:
- Download an ebook
- Play a video
- Interact with a slider
- Interact with a menu
- Play a song
The list is limitless. There are also platforms that are built around event-based tracking, like Amplitude and Heap, that you can check out (usually used by software products or mobile apps, but also by ecommerce, too).
Read up more on Google Analytics events here.
Google Analytics Tip #4: Question your definition of bounce rate
People often take bounce rate at face value. They think that a high bounce rate is bad and a low bounce rate is good. It’s not that simple, though.
If that were the case, the easiest way to lower your bounce rate would actually have nothing to do with user behavior; the easiest way would be to set up an adjusted bounce rate.
The definition of a bounce rate is basically a single-interaction session on your site. Most people forget the “interaction” part, and they just assume that a bounce is when someone 1) lands on a page and then 2) leaves.
But look at the rest of the description from Google Analytics:
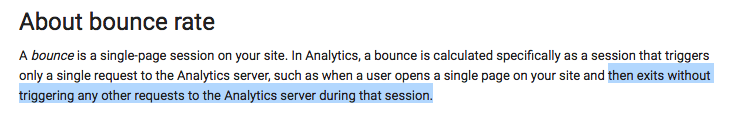
“Without triggering any other requests to the Analytics server during that session,” is what matters. Because, depending on how you have events set up in Google Analytics, someone could actually come to only one page and exit, and not be counted as a bounce.
It’s a somewhat complicated topic, but there are essentially two types of events you can set up:
- Interaction Events
- Non-Interaction Events
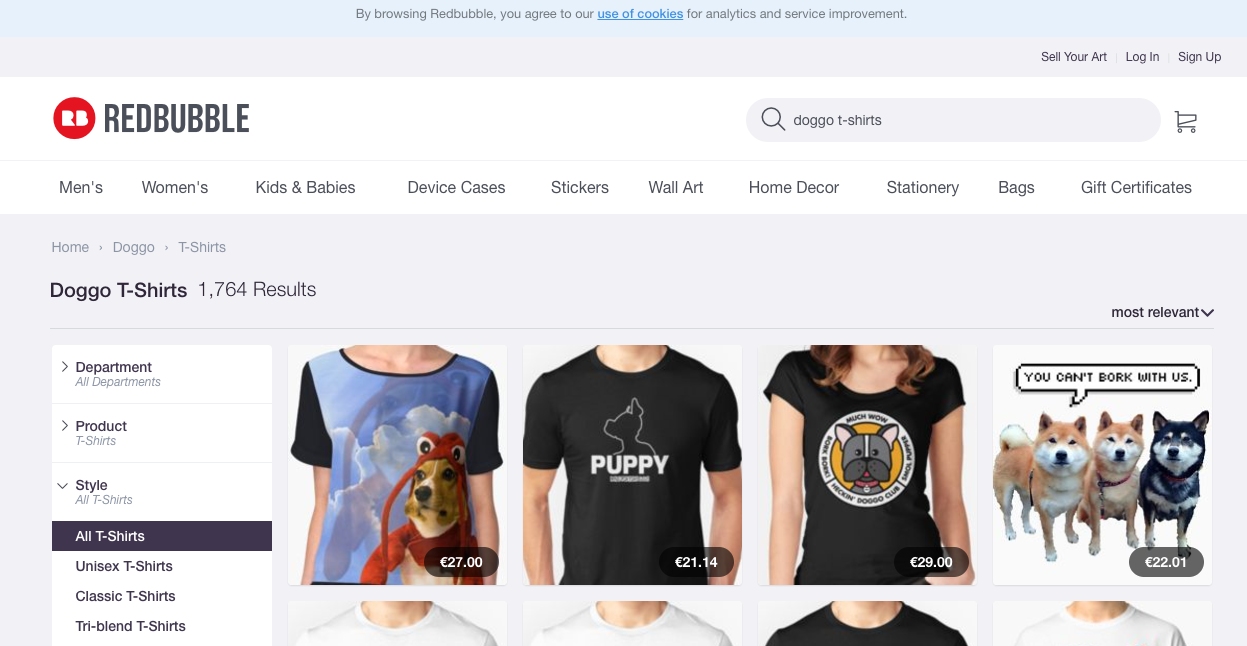
To explain these two, imagine a hypothetical website, let’s say an ecommerce site that sells doggo tshirts. A user lands on the homepage, watches a product video, and then leaves. Should that count as a bounce? Well, it depends how you set up that product video event.
If you set it up as a non-interaction event, it won’t affect your bounce rate. The session will be counted as a bounce. If it’s an interaction event, then by playing that video, the user sends an additional request to the Analytics server during the session, and it will not be counted as a bounced session.
You can see how this is a strategic decision. You can select what counts and what doesn’t as interactive events.
It’s a somewhat confusing topic, so I encourage you to read Yehoshua Coren’s guide on the subject here.
Google Analytics Tip #5: Set up funnels
Let’s bring the conversation back to goals for this another one of our Google Analytics tips. With any goal, we can set up a funnel in order to view the journey that our users, in aggregate, took to reach the goal. With that, we can view the steps at which people fall off, effectively finding the leaks in our conversion funnel.
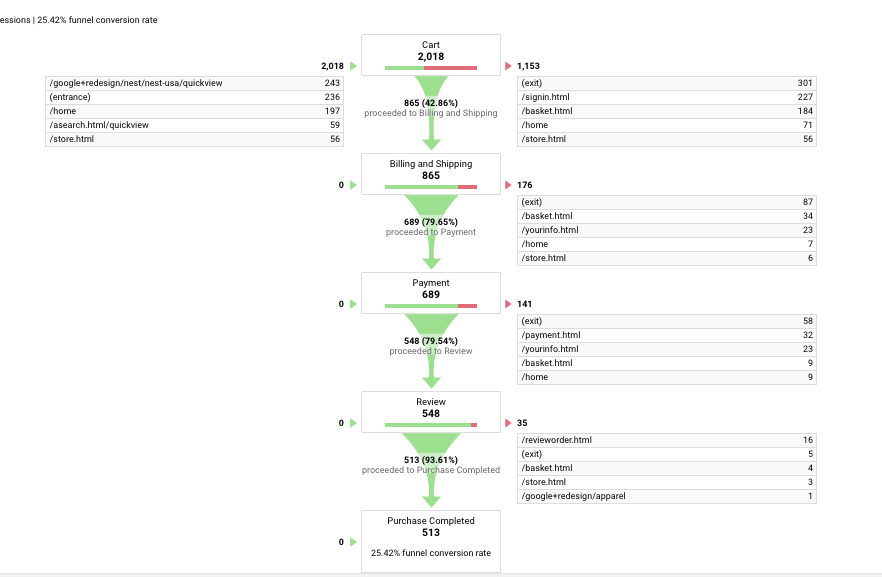
It’s easy enough to set up funnels, especially when you have a simple page-based goal. You just work backwards at steps the user would need to follow to get there. In the example above, the user goes from:
- Cart
- Billing and Shipping
- Payment
- Review
- Purchase Complete
Yours may differ, but it usually follows a similar format (at least with ecommerce). You set up funnels while you’re setting up your goal:
If you want to read more on funnels, check out this section of a CXL article.
Google Analytics Tip #6: Review horizontal funnels
As part of Google Analytics’ Enhanced Ecommerce feature set, you’re able to squeeze a lot more value out of funnels.
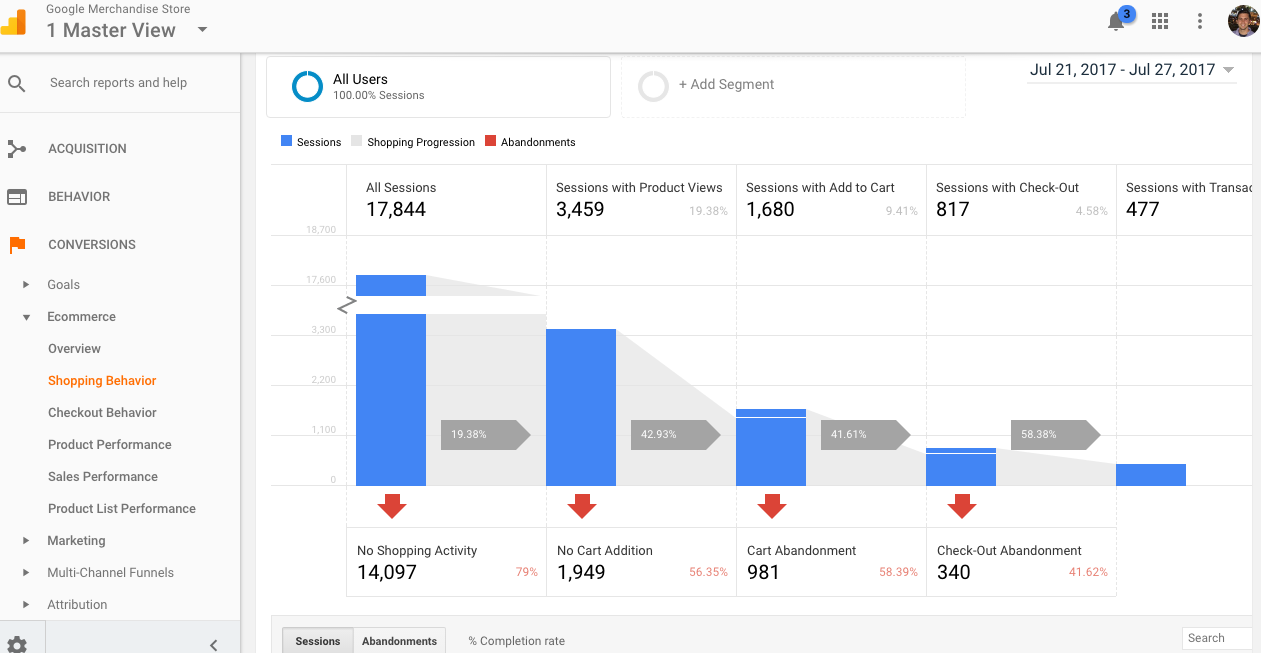
This works mainly through the Shopping Behavior report (Ecommerce > Shopping Behavior). Of course, you have to enable Enhanced Ecommerce as well as configure how you want your funnel to display. But this is what it will look like:
Essentially, you get to access a horizontal funnel, which is actually quite customizable in its use cases (check out this article for a tutorial on using it for content engagement analysis).
In addition, there are many problems and limitations with the classic Google Analytics funnel (including backfilling, and the lack of segmentation capabilities).
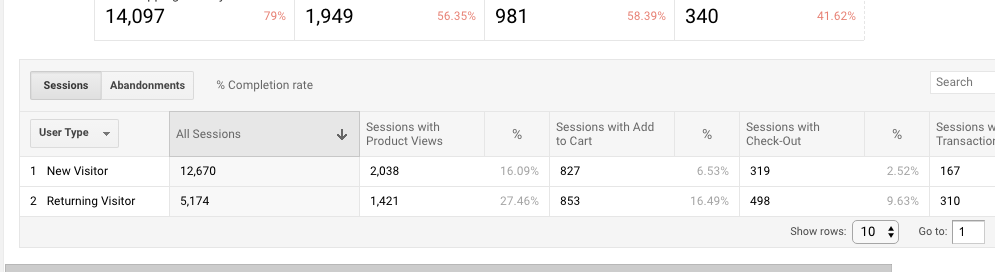
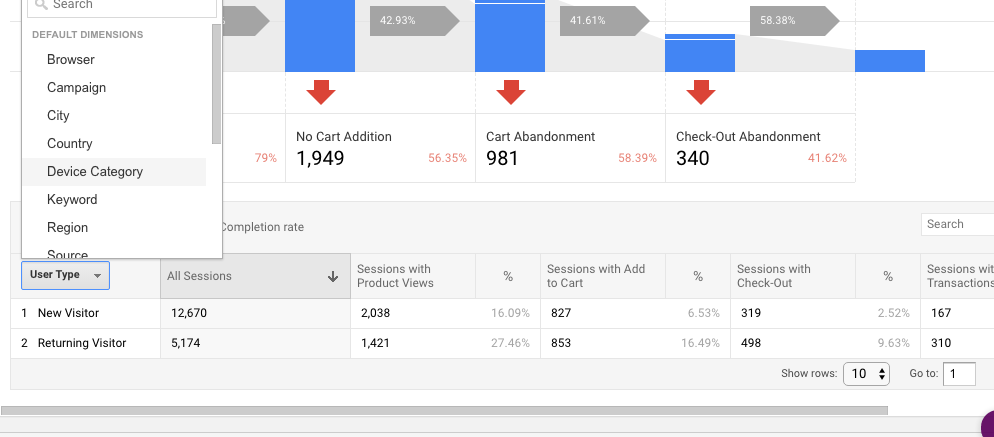
So, the above funnel shows you a lot. It shows you that out of 17,844 total sessions, 3,459 of them viewed products. From there, 1,680 sessions included an “add to cart” action, etc. We can mix it up further, still, and change our “Sessions” to “Abandonments,” giving you an inverse way of viewing the data:
You can also view the funnel using different dimensions. For instance, to view behavior by Device Categories, just click on “User Type” and select “Device Categories” from the drop-down menu:
In addition to the previous Google Analytics tips (a tip within a tip, if you will), you can add customer audiences, which is super powerful. Just click + Add Segment at the top of the screen as you usually would, and select whichever audience you’d like to analyze.
Another cool feature of this Enhanced Ecommerce funnel feature is that, if you’re integrated with Google AdWords or Doubleclick, you can create an audience off of anyone who abandons at a particular step and use them in your AdWords campaigns. This enables more advanced targeting for your ad campaigns.
Google Analytics Tip #7: Integrate Google Analytics with your testing tool
If you’re running A/B tests, make sure you’re bringing the data somewhere other than just your testing tool.
It’s not that your testing tool is untrustworthy; it’s just that you want a second look at your data. In addition, there’s a ton of limitation with how you do post-test analysis if you’re only using your testing tool to do it.
For instance, you won’t be able to dig into different segments and see how they were affected by the test. You also (usually) have to ask for the raw data when it comes to revenue analysis, which is a pain. By integrating with Google Analytics, you can get a second take on your data, and you can also view user behavior at a more granular level.
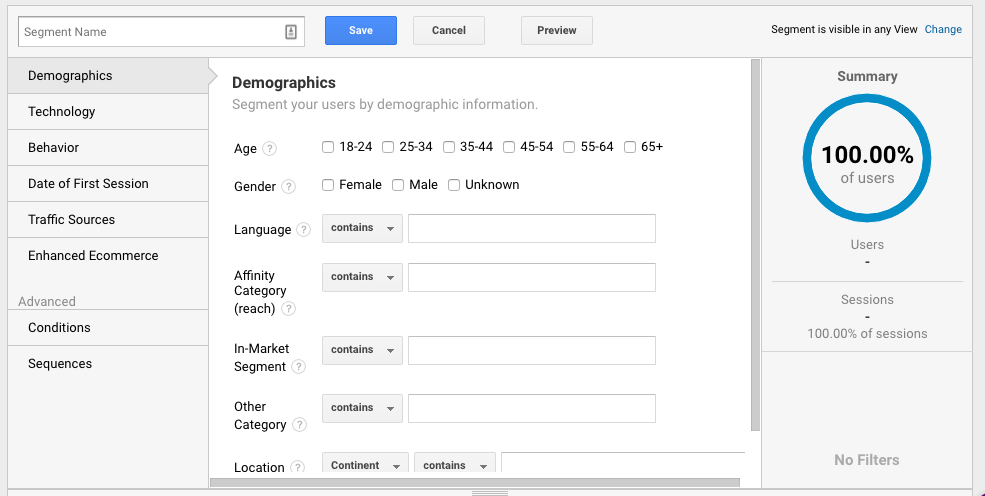
Google Analytics Tip #8: Utilize custom segmentation
You’ve heard it before: averages lie. As Avinash Kaushik put it, “All data in aggregate is crap.”
If you’re only looking at Google Analytics reports from a high-level birds-eye view, you’re missing out on so much information. In addition, most important business questions rely on your ability to dig into advanced segments (not all, but most, I’ve found).
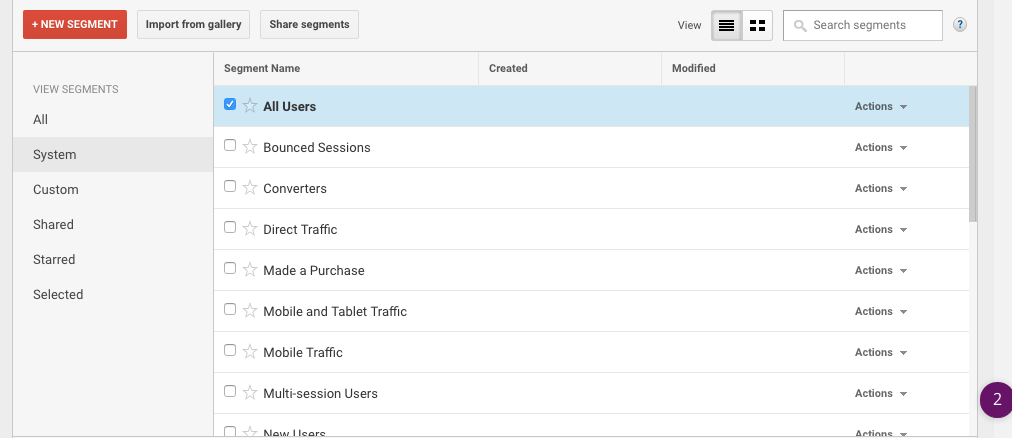
Google Analytics has a whole bunch of out-of-the-box segments. You can find them when you click on + Add Segment and then click “System.” They include segments like “Bounced Sessions,” “Direct Traffic,” and “Made a Purchase.”
These can be helpful, but shouldn’t limit the scope of your analysis. For further insights, you can use custom segments. To create one, you just click the red + New Segment button on the top left. Once there, you can pretty much set any parameters you may want to dive into.
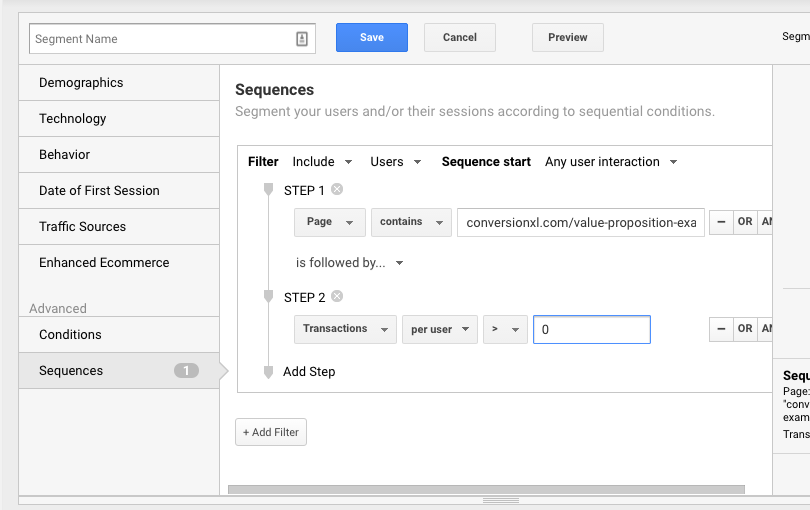
Now, there are pretty much unlimited possibilities here, but I’ll give you a concrete example to really drive home the value of this Google Analytics tip. Let’s say we want to see the behavior of all those who landed on a given blog post and then made a purchase. To do that, we’ll go under “Advanced” and click “Sequences” (given that we care about the order of actions).
The actual set up will look like this:
For an in-depth explainer on creating custom segments and more Google Analytics tips, check out this guide from Google, or check out a guide Shanelle Mullin wrote on CXL’s blog.
Google Analytics Tip #9: Learn RegEx
RegEx (or a Regular Expression) is a sequence of symbols and characters expressing a string or pattern to be searched for within a longer piece of text. What’s the importance of RegEx to Google Analytics? There are a lot of use cases. You can…
- Create filters. Many filters require Regular Expressions.
- Create one goal that matches multiple goal pages.
- Suppose your Thank You page has many names, but they’re essentially the same goal. You can use Regular Expressions to “roll them up.”
- Fine-tune your funnel steps, so that you can get exactly what you need.
Learning RegEx will boost your skills as an analyst, without a doubt. There are many good resources to learn from, but this PDF from LunaMetrics is my favorite one. Here’s a good forum with many other resources.
My advice is to chip away at it piece by piece. Learn something and try it out in Google Analytics, then repeat until you’re an expert.
Google Analytics Tip #10: Explore Google Analytics custom reports
Another way to get more out of Google Analytics is to use custom reports. I talked about this a bit in a previous KlientBoost article, but to reiterate, custom reports allow you to create reports and dashboards directly in their interface. You can find this feature in the Customization section under “Custom Reports.”
There are three types of reports:
- Explore
- Flat Table
- Map Overlay
Without diving too deeply into complexities or nuance, here’s an example of a very simple custom report that shows conversions by device type:
Google Analytics custom reports are super easy to make, and when you figure out how to do it, you’ll be using them all the time. To learn more, read this post from the KlientBoost blog (specifically the custom reports section)--or if you’d just like some quick ideas for custom reports, this is a good CXL article on the topic.
Google Analytics Tip #11: Automate your reporting
While I think analytics should largely be a function of asking important business questions, there are certain reports that you’re constantly running. When a task is repetitive, it only makes sense to automate it.
With Google Analytics, you can do this a few ways, most of which include bringing your data to a third-party tool. We go over this extensively in a previous KlientBoost post on GA reporting, but two of my favorite ways to automate reports are:
Realistically, the API/Sheets strategy may give you some number crunching capabilities that you can’t get in Data Studio, but Data Studio is so easy to use and share that I couldn’t recommend anything else if you’re looking for a simple an effective way to automate reporting.

Take a few hours and learn how the interface works. CXL Institute put out a class on Data Studio if you’d like to dive a bit deeper.
Google Analytics Tip #12: Analyze website performance for tech fixes
Though it’s not the sexiest part of conversion optimization, one of the most important factors in on-site website optimization is making sure that your site runs fast. Another factor is whether you have technical bugs on certain browsers and devices. If your site isn’t usable, persuasion triggers and pretty design don’t matter.
Luckily, there are a few simple reports you can run in Google Analytics to see if you’ve got a speed problem (everyone can improve). It can also show you if you have bugs on individual devices or should focus on any specific technical fixes.
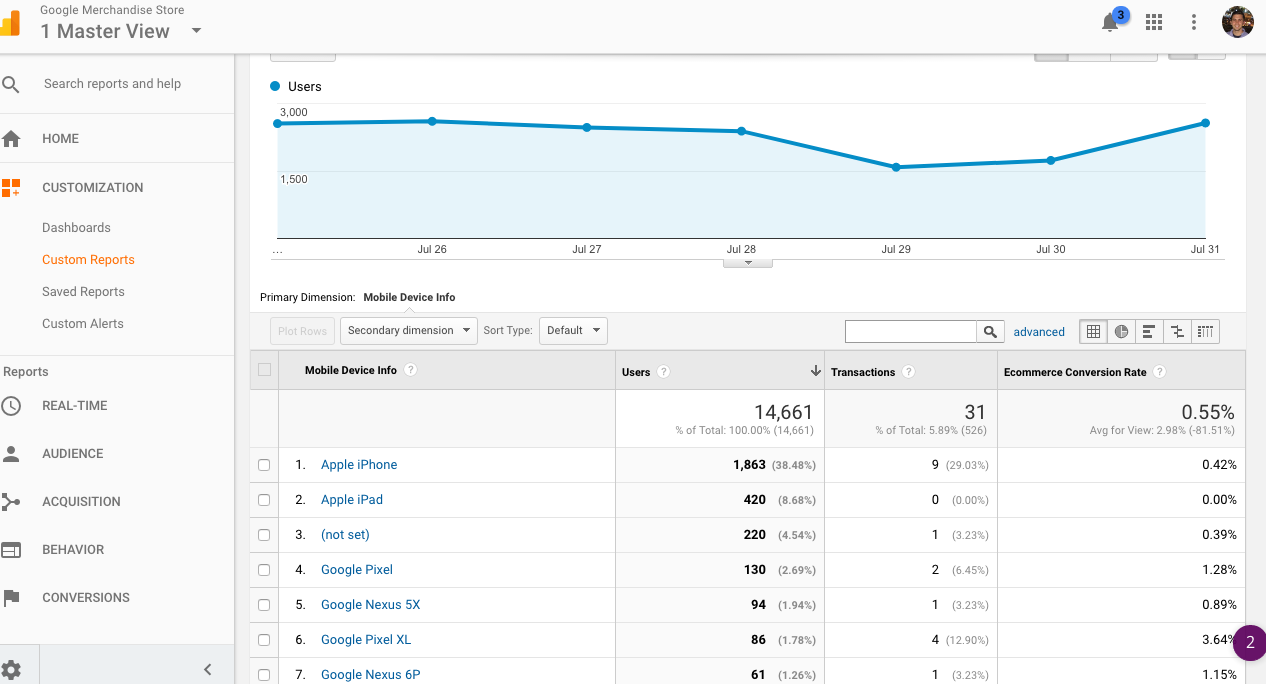
We’ll start with a cross-browser and cross-device testing.
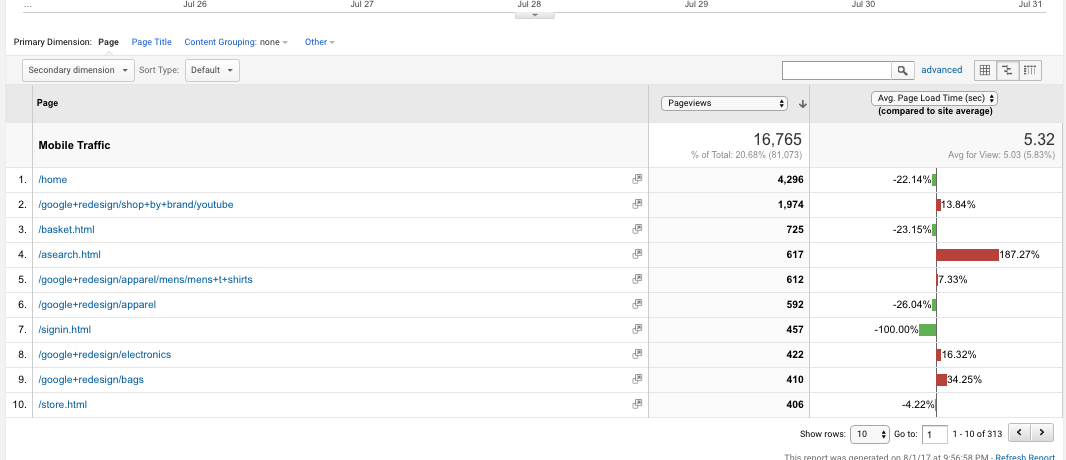
Open up your Google Analytics and go to Audience -> Technology -> Browser & OS report.
You will see conversion rate, bounce rate, etc., for each browser. Make sure you look at one device at a time, so you don’t get fooled by averages. Apply a device segments first: desktop only, tablet only and mobile only.
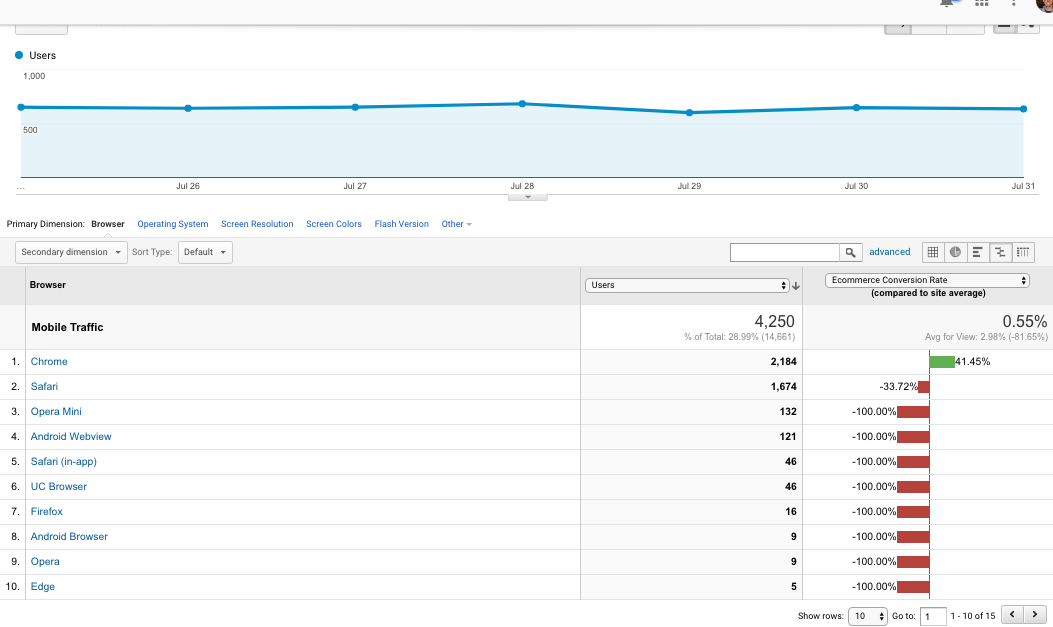
In this report, I organized mobile traffic by a comparison view. That way, we can see which ones are underperforming. In general, though, look for the anomalies.
As Peep Laja, founder of CXL, wrote in a blog post:
“While it could be that people using older versions of IE are just some stupid old people not spending money, but it might also be that you’re the stupid one losing money due to some bugs or UX issues.”
Next, let’s look at speed. Go to Behavior → Site Speed → Page Timings. Turn on the ‘comparison’ to easily spot slower pages:
Again, look for all entries that load with a sub-optimal speed. Then, you can use a tool like Google PageSpeed Insights to find issues to repair.
Google Analytics Tip #13: Set up your views correctly
While every organization operates differently, there are some Google Analytics tips and best practices when it comes to setting up your Google Analytics account. There will always be aberrations with good reasons, but generally, it’s advised to set up three views right away:
- A Master View
- A Raw Data View
- A Sandbox View
The Raw Data view, as suggested, should remain untouched. Once you add a filter to a view, it alters the data permanently, therefore you should have some insurance in the form of a Virgin view.
Next, the Sandbox view should be used to test new implementations, filters, etc. Anything that you eventually plan on implementing in your usable, workable, Master view, you should first try out in Sandbox view. This is sort of a “measure twice, cut once” method that prevents you from creating needless mistakes.
Google Analytics Tip #14: Implement Google Analytics accurately
This is easily the most important tip on the list, so I apologize for the buried lede. However, it’s also the most complicated to talk about. How you implement Google Analytics should be largely prototypical, but there will be slight nuanced based on your situation.
The important thing is that you and your organization can trust the data that you’re getting from the system. If you don’t trust the numbers, they’re absolutely worthless.
To fortify your trust in the system, I recommend doing a Google Analytics audit. Be critical. Ask important questions about your data, and try to maintain your data integrity and accuracy.
Google Analytics Tip #15: Review cross-domain & sub-domain tracking
One of the most common problems in a Google Analytics setup is the lack of correct cross-domain or subdomain tracking. This fundamentally fractures your view of the customer journey and how users interact with and convert on your site.
An example that I’ve written about before…
I could listen to Spotify’s web app all day every day. I could be a power user, a paying customer, and yet, I still may want to wander over to their developer’s site every once in a while, because I want to discover the most depressing Radiohead song using their API and some wizard-like R skills.
Thing is, Spotify sends this data to another Google Analytics property. What this means for the analyst is that I become a new user according to the developer’s site. In this way, there’s no way they can track my complete customer journey and total behavior with Shopify’s web properties.
You can see this by using GA Debugger, a free Chrome extension that is useful for doing analytics audits without even opening up the GA interface.
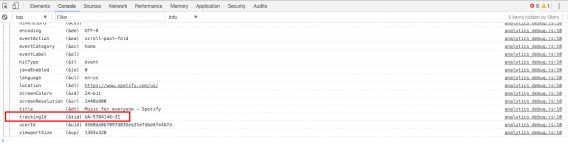

They’re different tracking IDs.
If you have subdomains or other domains, you should look into cross-domain and sub-domain tracking implementations. Especially if you’re running an ecommerce shop, some cart solutions fracture the journey, which makes analytics quite useless.
Here’s a good guide from Google Analytics on the topic, and here’s an even better one from Optimize Smart.
Google Analytics Tip #16: Conduct a campaign tracking audit
If you’re a marketer, one of the most important analytics-related things you need to pay attention to is your campaign tracking. That is, how are you analyzing which channels are bringing in results? With Google Analytics, we use UTM tags for that. They usually look something like this:
http://www.example.com/?utm_source=adsite&utm_campaign=adcampaign&utm_term=adkeyword
There are five UTM tags used by Google Analytics:
- Medium
- Source
- Campaign
- Content
- Term
The “Medium” and “Source” tags are required, but it’s also recommended that you use the “Campaign” tag to track different marketing campaigns. You can use a “Content” tag to differentiate between different versions of a campaign (such as when you’re A/B testing messaging). Finally, the “term” tag is used to identify paid search terms that led to clicks.
To start off, you should run a high-level audit of your Acquisition reports, looking at it from a common-sense lens.
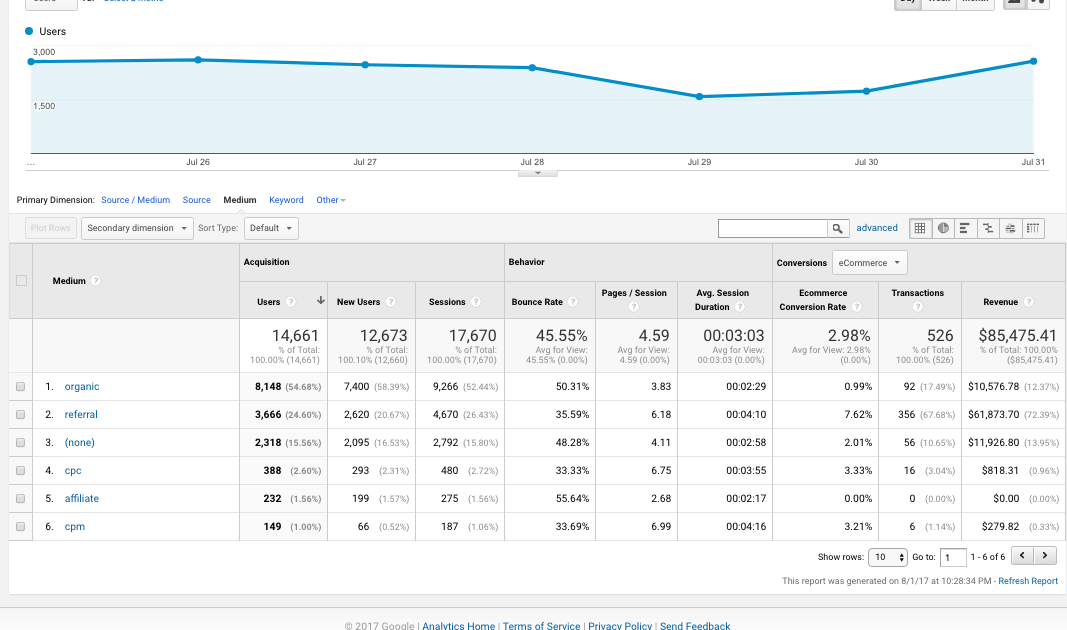
Go to Acquisition > All Traffic > Source / Medium and then select “Medium,” and just see if things make sense. Does your social, email, or CPC traffic look super low? Direct (none) looking way too high? It’s a common problem, and one usually caused by lack of proper campaign tagging.
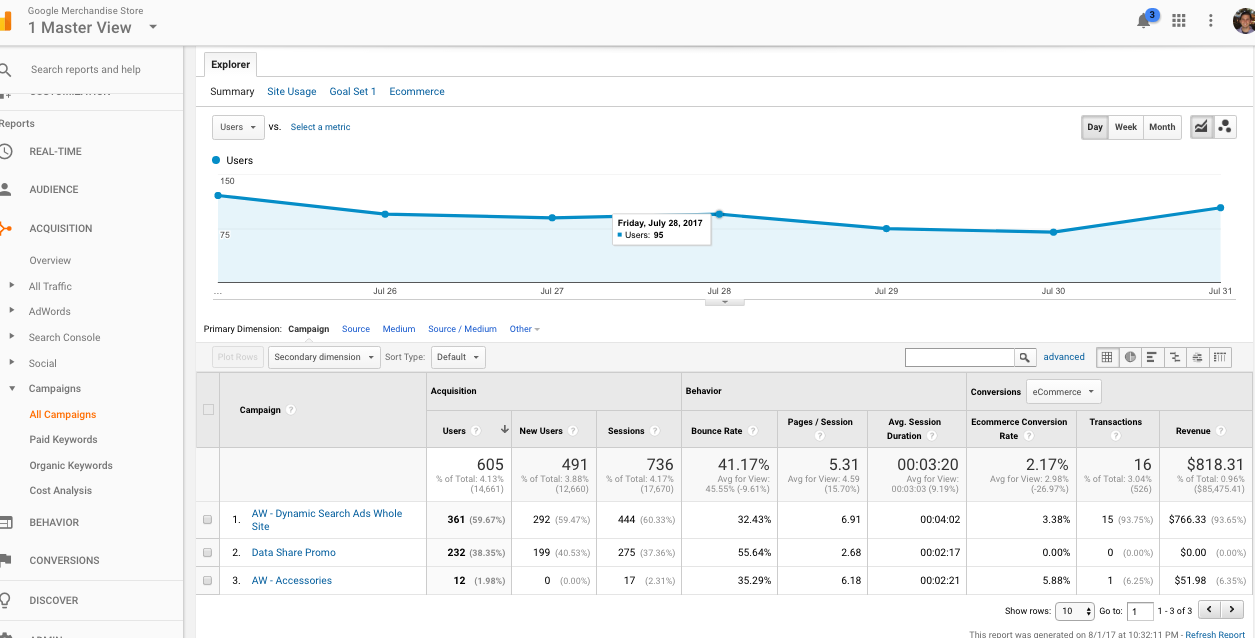
Next, if you’ve got a campaign tracking plan in place, go to Acquisition > Campaigns > All Campaigns:
You can usually find some funkiness by doing an audit, but campaign tagging is really a strategic as well as an organizational issue. If you think about all the different types of campaigns and touchpoints your brand has - Facebook, Twitter, display ads, email, etc. - you can see how a little organization could solve some big problems.
The best way to do this is to get everyone on the same spreadsheet. Luckily, Cardinal Path has a fantastic spreadsheet template (with instructions) that you can use to create and organize all links.
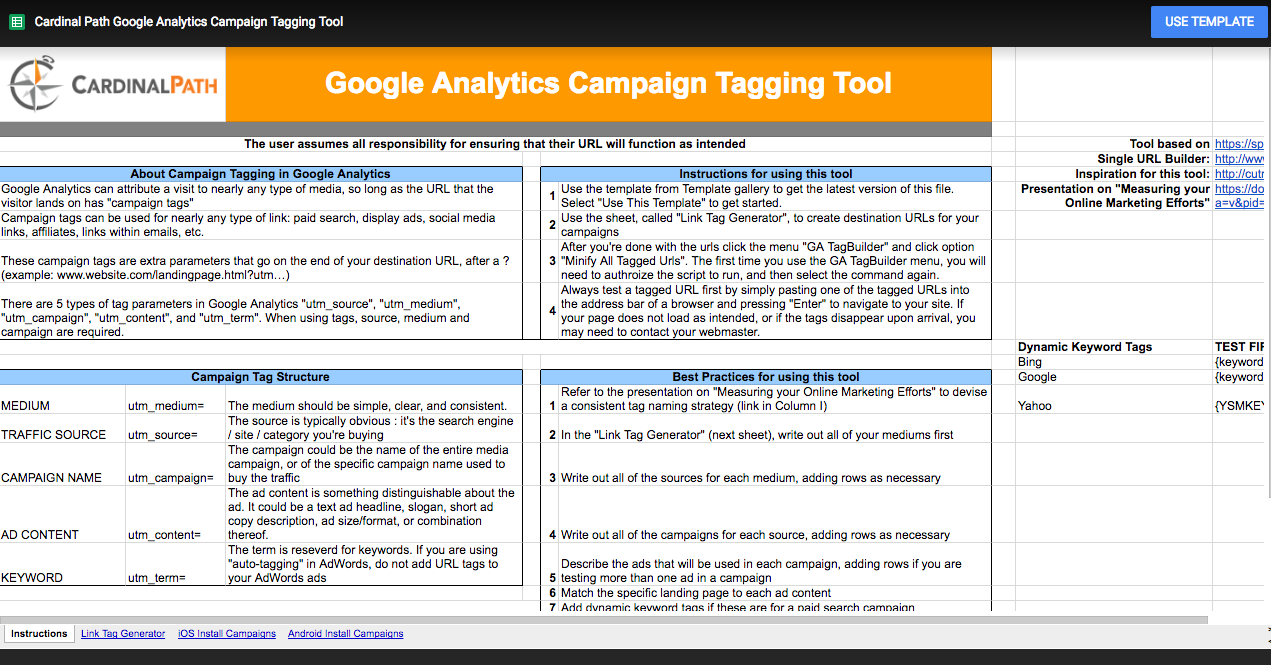
A best practice is to create all of your tracking links in the spreadsheet, so you can 1) keep track of what tags you’re using and 2) make sure you don’t break links.
There’s a lot to know about proper campaign tagging, best practices, and common mistakes, but fortunately, Annie Cushing has written an impressively definitive guide that you can check out.
Google Analytics Tip #17: Configure custom dimensions
When you get a little more advanced, custom dimensions become incredibly useful for your measurement strategy.
Dimensions are things that describe your data. These are the “rows” in your data. While there are hundreds of built-in dimensions, you can also create “custom dimensions.” In almost all cases, the out-of-the-box ones won’t be entirely sufficient for your use case.
Most often, custom dimensions are used to combine GA data with non-GA data (like data from your CRM). Common use cases for custom dimensions include logged-in vs logged-out users, phone call data, and CRM demographic or firmographic data. They work the same way that the out-of-the-box dimensions work (they, too, have to have a specific scope such as hit, session, user, or product), it’s just that you have to set them up yourself.
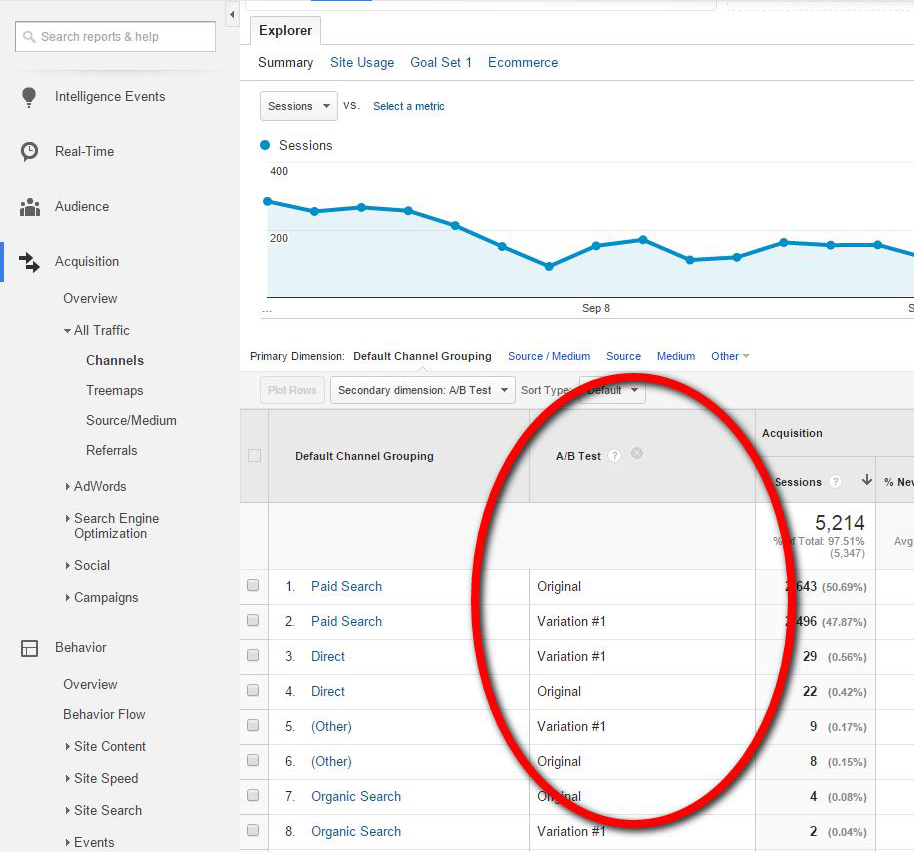
Another common (and recommended) use case is passing a/b test variations as custom dimensions so you can analyze a/b test behavior in Google Analytics.
Google Analytics Tip #18: Use calculated metrics
Similarly, as you become more advance, calculated metrics will certainly be a part of your Google Analytics experience. They’re just one more way that Google Analytics gives you the power to customize your analysis and measurement.
As an example of where you may need calculated metrics, think about how you determine ecommerce revenue. Does it include shipping? In Google Analytics standard ecommerce (or enhanced ecommerce) reports, it doesn’t show this. So you could, if you so desired, create a calculated metric for Revenue - Shipping.
A calculated metric is just what it sounds like. You can set them up quite easily as long as the data as available. For instance, a calculated metric for Revenue Per User could be setup by using {{Revenue}} / {{User}}. This article gives some other great ideas for calculated metrics.
Like anything else in Google Analytics, especially those things that take configuration time and are limited by GA in quantity (the free account limits you at 5 calculated metrics), you should approach this strategically, and first think about what type of calculated metrics would help you answer business questions.
Google Analytics Tip #19: Make use of filters
If there’s a theme in this post (outside of basic data integrity), it’s that the specific and focused is better than the broad and undisciplined. The more you can scrutinize the numbers that really matter, the less noise there is to distract your analysis.
Filters are just one more way of accomplishing that mission.
Basically, they're used by Views to segment your data into smaller groups. You can use them to include specific sets of data, exclude other sets, or to search for or replace certain data. It’s a customized view essentially.
It’s not too difficult to create filters. You can create all the filters at the Account level, then assign them to different views. Remember, always use your Sandbox (or Test) View first, and then later apply it to your desired View when you know it doesn’t break things.
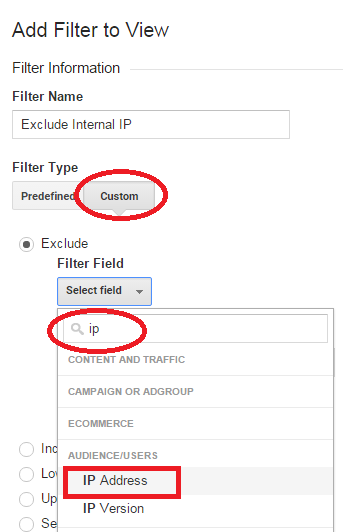
Some reasons to create views include:
- Including internal IPs
- Excluding internal IPs
- Excluding Dev site traffic
- Lowercase search terms
- Lowercase URLs
- Removing query strings
...and on and on. There are many reasons to include, exclude, or consolidate certain data in a view. Use filters to do it. This Lunametrics article is an amazing overview of the topic if you’d like to read up.
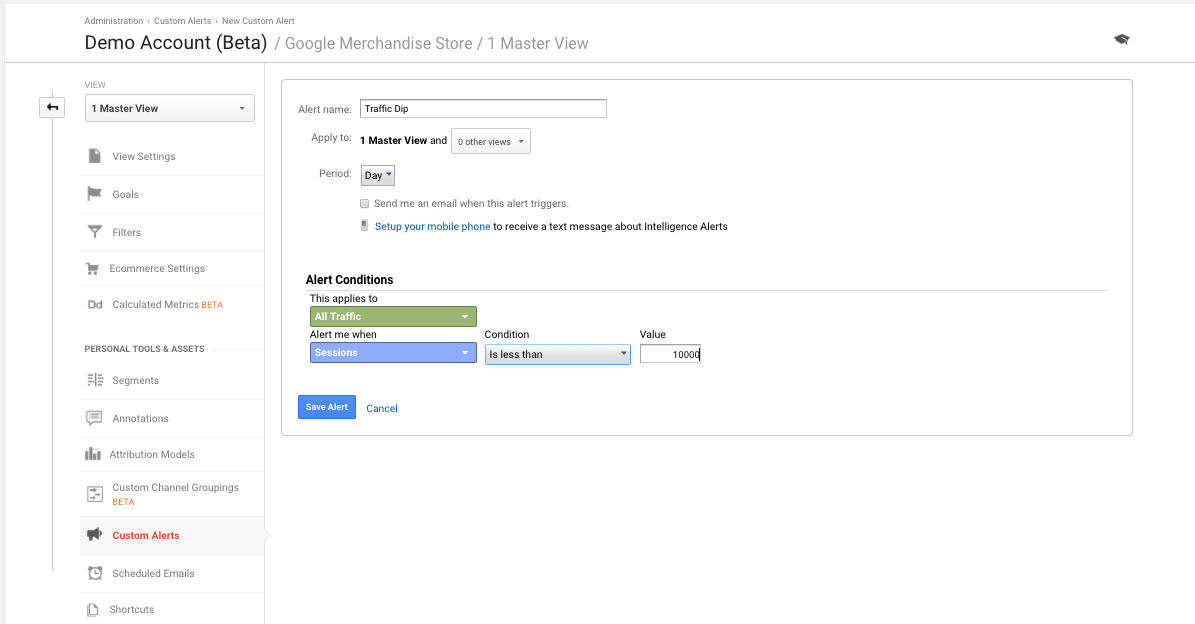
Google Analytics Tip #20: Set up custom alerts
This tip is super short, but it’s worth noting. I use alerts for tons of things in my life, from personal finance to calendar events and more. If you care about managing and using your data, why not apply the same concept?
You can use custom alerts to do this. To create a custom alert:
- Sign in to Google Analytics.
- Navigate to your view.
- Open Reports.
- Click Customization > Custom Alerts.
- Click Manage custom alerts.
- Click + NEW ALERT.
Then, you simply set up the alert to track what you wish. Usually, this is for managing drastic dips in traffic, conversions, or revenue. It’s a good way of monitoring when things are weird with your site (like broken pages). You could get pretty technical as well and track when an a/b test is seemingly broken by passing the values into GA from your testing too. Anything’s possible. Start simple though with these initial Google Analytics tips.
Here’s a traffic-based alert:
Google Analytics Tip #21: Get past sampling limits
Sometimes, Google Analytics pulls a random (and hopefully representative) sample of your data instead of the full thing.
Sampling is an issue you’ll deal with only if you have large amounts of traffic or if you’re doing some pretty narrow segmentation. For many people, it’s not an issue. You can tell if it’s an issue for you by looking at the right hand corner of your screen on a given report.
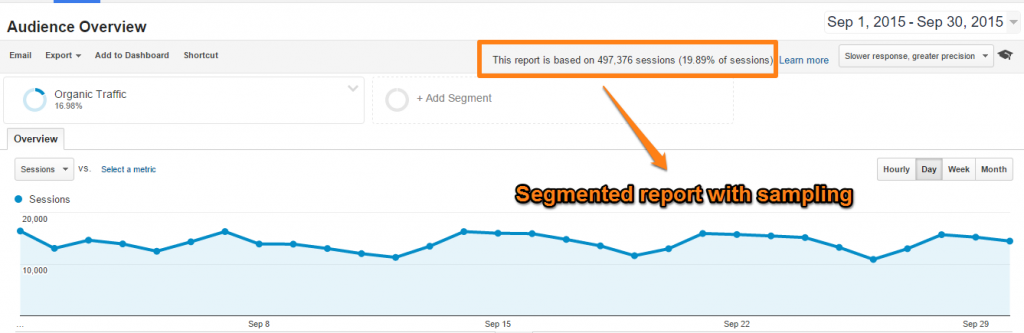
Depending on your risk profile, you may be okay with sampling. Especially if the sample is based on 90%+ of your data, it’s easy to take this as more or less representative. But when it drops to <25% of your data, maybe you want to look into a workaround (of course, I’m simplifying the decision making around the numbers here). Yes, there are many workarounds.
Here are 8 as listed by Online Metrics:
- Adjust Your Data Range
- Use Standard Reports
- Create New Views with Filters
- Reduce the Amount of Traffic per Property
- Sample Your Data by Modifying Tracking Code
- Use Google Analytics API
- Use Google Analytics Premium or Adobe Analytics
- Use BigQuery
The option I like the best? If you can’t afford Premium or BigQuery, and you’re technically able, use the Google Analytics API and something like R run smaller reports and aggregate them to avoid the problem. But if you’re consistently dealing with this problem, it may be fruitful to look into something like BigQuery.
This is a rather large topic, so here’s a great article from Moz to learn more about sampling.
Google Analytics Tip #22: Analyze data in R
Yet another deeply complex topic that I’ll try to brush over rather quickly. The summary: I think it’s useful (and fun) to learn R to analyze your Google Analytics data in other ways.
We’ve already established that a language like R will help you get past data sampling. It can also help you produce impressive visualizations, automate reports, build interactive Shiny Applications, and run models that you couldn’t do very easily in Excel.
For instance, in R you can:
- Build user personas using clustering and PCA/Factor Analysis
- Build good looking time of day data heat maps
- Build Markov attribution models
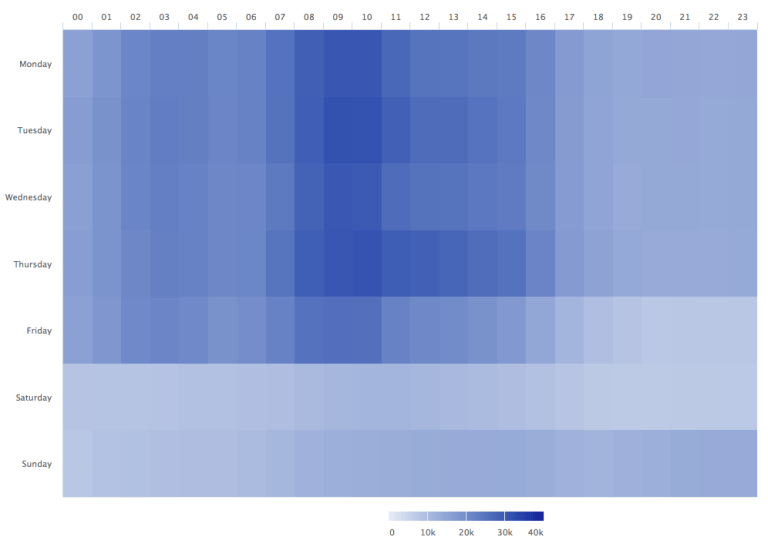
The best place to get started here is dartistics.com. In addition, this article from Analytics Demystified is aimed at beginners and it’s the perfect place to get in at ground level.
This tip isn’t really specific to Google Analytics, as R (or similar statistics-focused programming languages) will help you with other things. But it will definitely expand your capabilities as an analyst.
Google Analytics Tip #23: Use site search to come up with content ideas
Here’s a quick tip for better UX and content ideation. How do you know what users want on your site? Well, your search bar might be telling you a story.
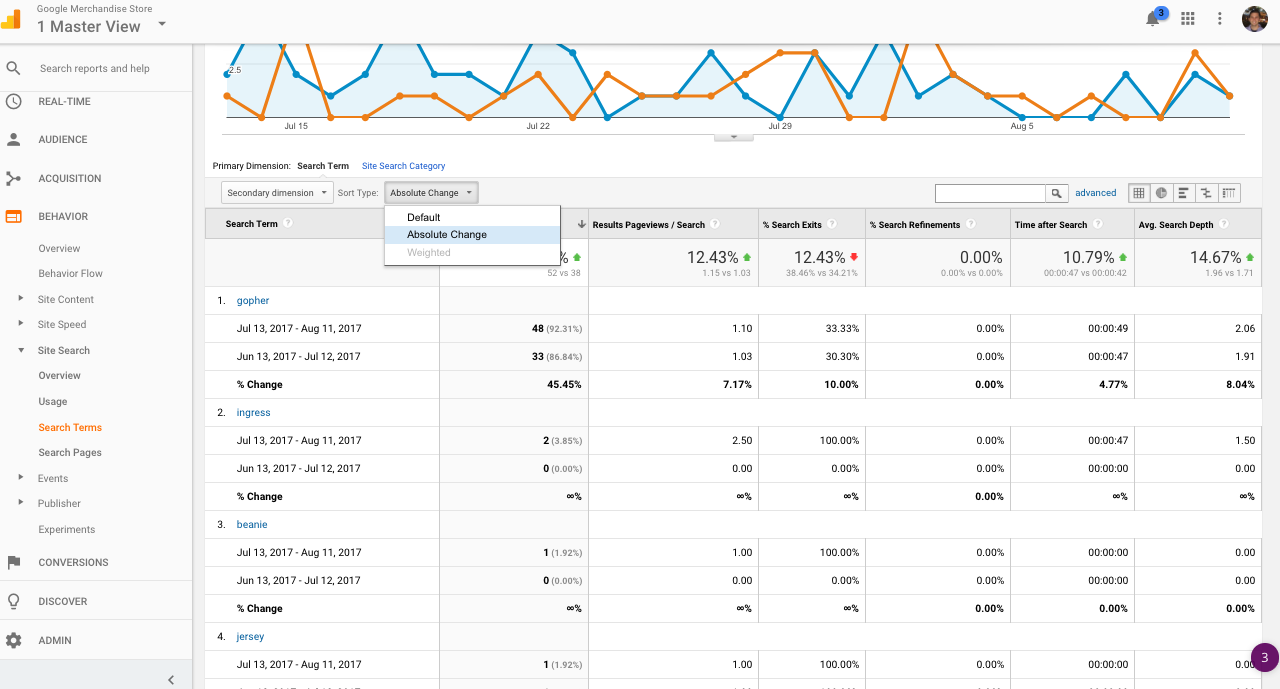
It’s easy enough to see what people are searching for (assuming you have site search setup. If you don’t, read this article on Google Analytics Audits). You can simply go to Behavior > Site Search > Search Terms.
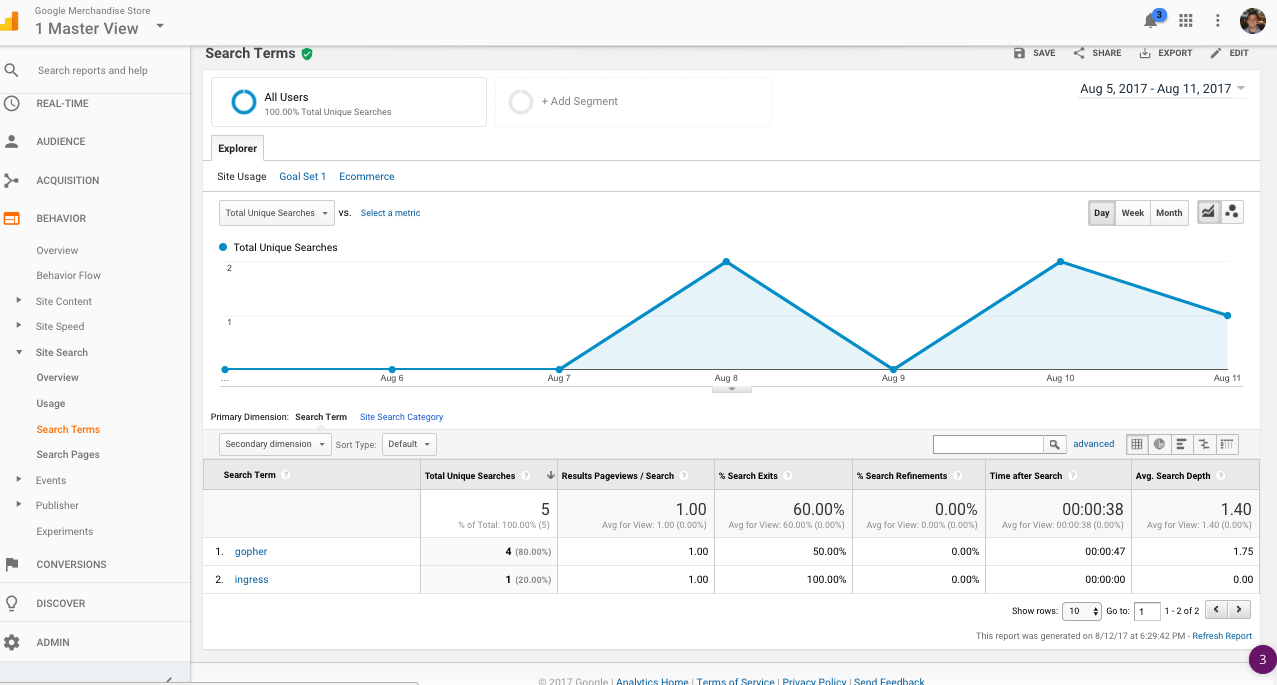
This will give you some good insight into what your users are searching for. Sure, you should definitely run this report. But let’s turn up the heat and see if there are any rising trends in searches.
To do this, do a time period comparison (for example, compare to the previous period), and then sort by “Absolute Change” instead of Default. This will show you what searches are appearing new and more often compared to the previous period (and if there’s anything surprising, perhaps you should consider creating content around that topic):
Google Analytics Tip #24: Integrate your pre- and post-purchase data
If you’re not integrating your pre- and post-purchase data, you’re missing a lot of the story. One, it can help you predict user behavior indicators before people purchase. Two, it can help you with attribution and paid spend (more on that in a second).
Ryan Farley put it really well in a recent blog post:
“In the loan industry – where I first cut my teeth in marketing and analytics – it’s typical that customers who actually read terms and conditions before hitting the ‘apply’ button are less risky. By less risky, I mean less likely to default on their loan.
For the lending institution, this is a big freaking deal. First of all, they have to decide whether to approve this borrower or not. Secondly, they have to decide which line of credit to extend, at what interest rate. That, combined with their assessment of the borrower’s riskiness, dictates capital requirements. At an aggregate level, we’re talking billions of dollars here. All this is driven by a few click and scroll events on whether a person read terms or not.
So what’s my point? Well for one, be sure to take 5 minutes to read (or pretend to read) the terms when applying for a credit card.
But the bigger point is, pre-purchase behavior can be highly correlated with post-purchase behavior, and make really freaking big differences.”
If you’re looking at website behavior in isolation, that’s a problem. That why, no matter your business type, you should be integrating your web analytics data with your customer data as well. In the context of this Google Analytics tips post, it means passing CRM data into Google Analytics, as well as pulling it all to a centralized database to explore pre and post-purchase behavior.
This isn’t easy, and it’s not a one-click decision. There are tons of tools available to help you with this. Farley recommends FiveTran in his blog post, but you can also do this with newer digital analytics tools like Amplitude, to a certain extent.
Point is: don’t look at data sources in isolation. Link your pre- and post-purchase data for the full story.
Google Analytics Tip #25: Explore attribution models (...or don’t)
Attribution is usually regarded as a fundamental question in digital analytics. It attempts to answer the question, “how effectively are my resources being spent?” You’re trying to attribute specific values to given touchpoints and channels. This turns out to be quite challenging, so we rely on models to tell us a story about our attribution.
I want to say, first, that this is a big topic. We won’t cover it in detail here (though, we did in this post if you’re curious). The important thing to note is that Google Analytics actually offers a lot of useful tools on the topic of attribution.
First, you can view time to purchase. Second, and related, you can view touch points to conversion. These help you determine if you even need to worry about attribution (if everyone purchases in 1 day and after 1 or 2 touchpoints, probably no need to bother).
Third, Google Analytics has several different attribution models embedded in their product, such as last click, first click, time decay, and linear models (all of which tell a different story about your marketing efforts). Again, we won’t dive too deeply into the specifics here, so read this post to fully understand ecommerce attribution.
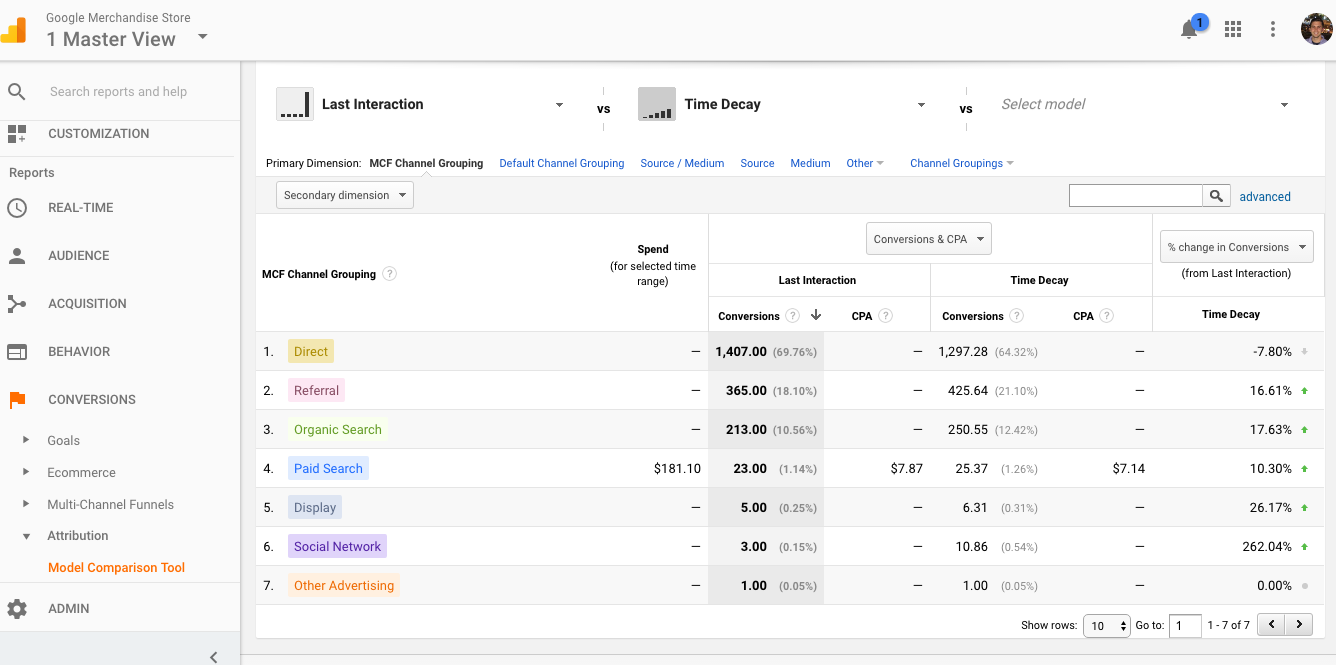
Finally, Google has announced that they will be democratizing their “data-driven” (read: algorithmic) attribution model for everyone to use. For those on the free service that engage in multi-channel marketing with lots of paid (especially display), this is big news.
Attribution is a big topic, and it’s not really useful for everyone to spend a lot of time thinking about. But at least pose the question to see if it’s right for your business to explore, and if it is, read this Klient Boost post on the topic.
Wrap Up on Google Analytics Tips
There you go: 25 Google Analytics tips.
It’s one thing to read about them; it’s another thing to make sure the advice plays out in the real world.
Set up your tracking, ask critical business questions, use the data to spur action. Follow these Google Analytics tips to avoid common mistakes along the way.