


The way you set up attribution analytics will help you answer the question: What value do my marketing channels and campaigns have?
That’s the fundamental question that attribution attempts to answer.
To put it more bluntly, as Bill Macaitis, former CMO of Slack, says, marketing attribution is about answering the question: “Are you spending your money wisely?”
Of course, it’s highly technical and a bit more complex than applying a discrete value to individual channels. Attribution analytics is based on models and is, therefore, not a perfect representation of reality. Rather, it’s an approximate understanding and is used to help us make better decisions.
Similarly, it’s often the case that one channel is impacted by the interactions of other channels. Robust attribution analytics models account for this, but even if you’re not using the most data-driven approaches, you can still get an idea of different user journeys.
Attribution is a huge subject, and the rabbit hole runs deep.
Therefore, I’ll do an overview of what
A lot of it will be Google Analytics specific, because that’s what most people use -- and also because I learned a lot of this in CXL Institute’s Google Analytics Master Course and Intermediate GA course.
But first thing’s first: do you even need to look into attribution analytics?
Get brand new analytics strategies straight to your inbox every week. 23,739 people already are!
Do I Need to Worry About Attribution?
Should you think about attribution analtyics? Probably. Is attribution complex? It certainly can be.
Though, depending on your business consideration cycle, attribution can be more or less important to you. Essentially what you want to know is, “how long does it take my visitors to purchase or convert?”
If you look at your data and find out that all of your visitors convert after one session, you don’t need to worry much about attribution. But if you discover that the period is more like two weeks, and there are a variety of touch points between that time, attribution analytics becomes important.
How do you discover consideration cycles for your business?
Open up your Google Analytics account and go to Conversions > Multi-Channel Funnels > Time Lag. Make sure you also select whichever goal matters to you (if you don’t have goals set up, do that first before thinking about attribution).
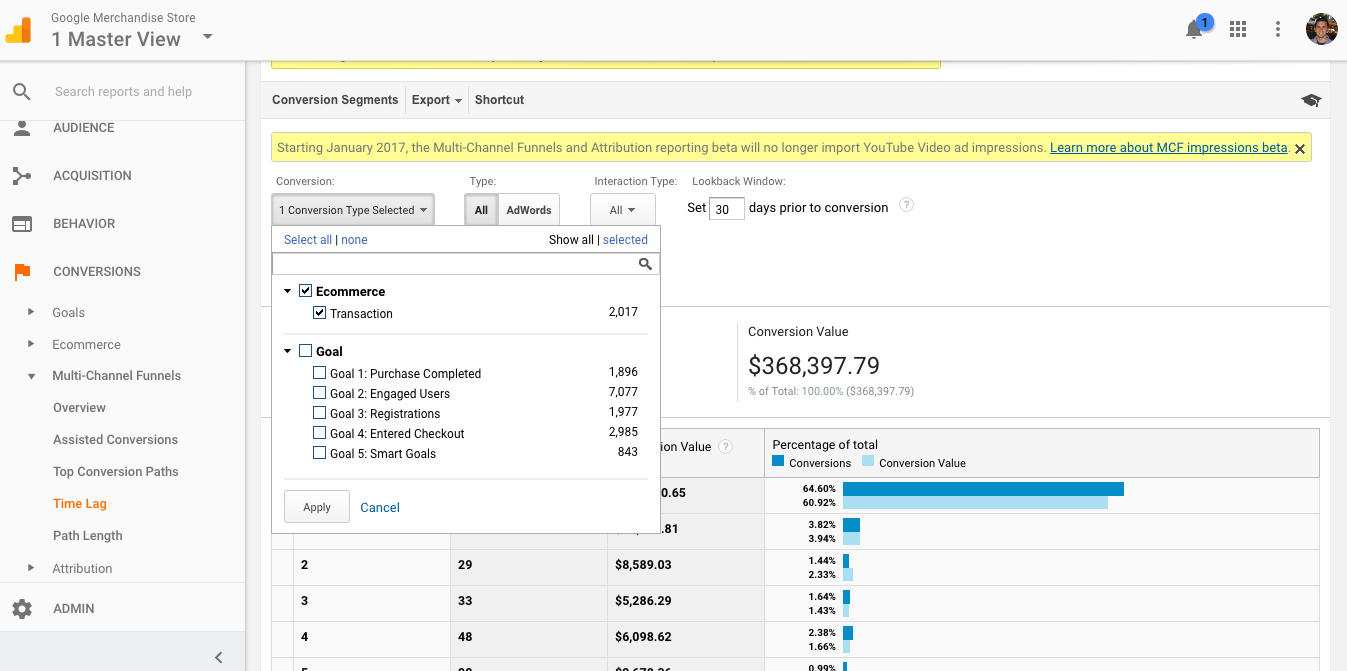
You can see in the image above that 64.60% of visitors in this data set convert in the first day. Similarly, down the chart, it shows us that 17.85% of visitors convert after 12-30 days. The longer the purchase cycle, the more necessary it is to invoke multiple touch points to eventually reach a conversion. If it’s a one-day purchase path, you can just look at your most efficient marketing channels and reinvest in them.
But if there is a longer purchase path, it’s likely that more than one touchpoint carries the weight in pushing the user to convert.
Therefore, you also want to know how many touch points occur to lead up to a conversion. If it’s just one touch point, remember, attribution doesn’t matter much. But if there are many interactions before a visitor buys,
To do this, we open up Conversions > Multi-Channel Funnels > Path Length (also making sure to select the proper goal from the drop down):
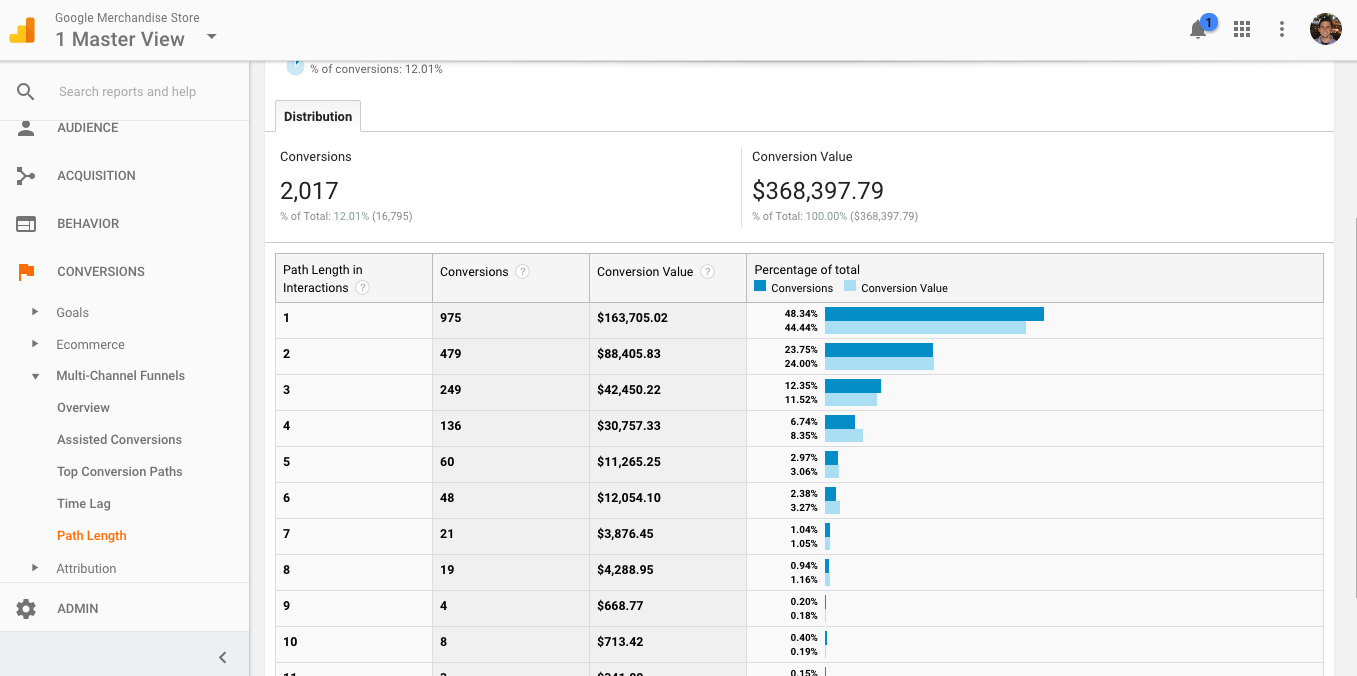
As you can see in the above image, about 48.34% convert with only one interaction and the rest have multiple interactions before converting. So, again, attribution is important and insightful.
Now that we know the majority of our conversions happen due to multiple touch points, the question is, how are our channels working together? You’re likely running a multitude of campaigns, ranging from email to organic to display to search. What are the interaction effects among these channels and how do users navigate their way to making a decision using these channels?
Important: Do This Before Attribution
Make sure you’re tracking everything accurately.
No matter the analytics platform you use, it will have some unique quirks in how it deals with campaign attribution and traffic credit. For instance, if you don’t put much thought into campaign tagging and you use Google Analytics, your direct traffic conversions will likely look extremely high. In most cases, this is inaccurate.
Google Analytics sorts any traffic it can’t otherwise attribute into direct, which can launch your direct traffic well beyond your organic traffic and any other channels you have set up without properly tagging and tracing.
Redirects between clicks and content are a common culprit, stripping away medium tags and other attribution, so Google doesn’t have a referrer to count on. This can make anything, from paid, email, social, etc., show up as direct.
What’s the solution? Do an audit of your current campaign tagging strategy and make sure you’re using UTM tags for all campaigns.
There are five UTM tags used by Google Analytics:
- Medium
- Source
- Campaign
- Content
- Term
The “medium” and “source” tags are required. It’s recommended you use a “campaign” tag as well, so you can track individual marketing campaigns. “Content” is used to differentiate between multiple content versions in a campaign (as in A/B testing messaging). Finally, the term “tag” is used to identify paid search terms that led to clicks.
Most email platforms integrate well with Google Analytics and set up automatic tags, but if yours doesn’t, this could be a big problem for attribution. A typical email tag usually just has the first three tags:
utm_source: getresponse
utm_medium: email
utm_campaign: julynewsletter
The final URL would look like this:
www.example.com/?utm_source=getresponse&utm_medium=email&utm_campaign=julynewsletter
For more information, read this incredibly detailed guide from Annielytics. Here’s a spreadsheet template Annie gives out free as well.
Seriously, read up on this stuff first, because if your data isn’t trustworthy coming in, it certainly isn’t going to be valuable when you try to attribute any monetary value to it.
Getting Started: Basic Conversion Path Analysis
One of my favorite reports in Google Analytics is the Top Conversion Paths report. It will help you see the exact linear paths visitors took to finally purchase. This can help answer questions like, “are my display ads doing anything?” and “how does email interact with direct?”
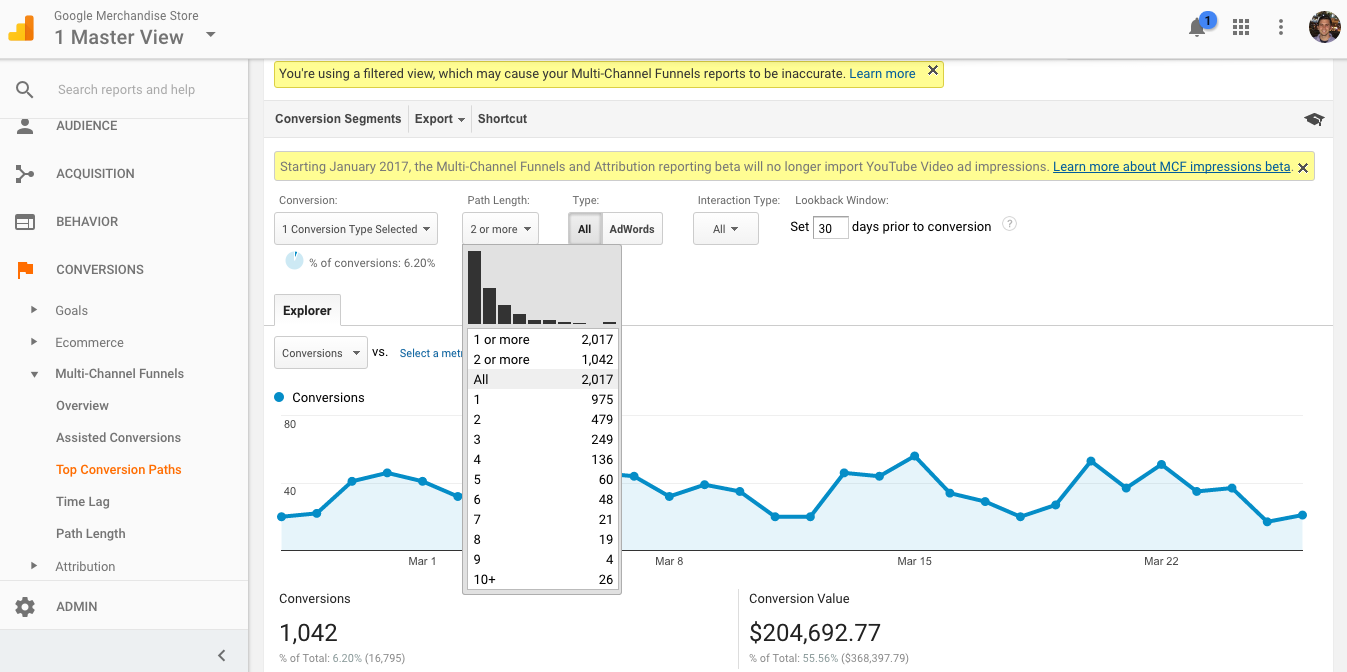
To do this, go to Conversions > Multi-Channel Funnels > Top Conversion Paths. At the top, make sure you select “All” for the “Path Length”, as GA defaults to 2 or more interactions. This way, you can see all of your data.
You can also get more granular here by using the “secondary dimensions” feature. I like to select the campaigns or source/medium option, and then further drill down by searching only for Paid paths.
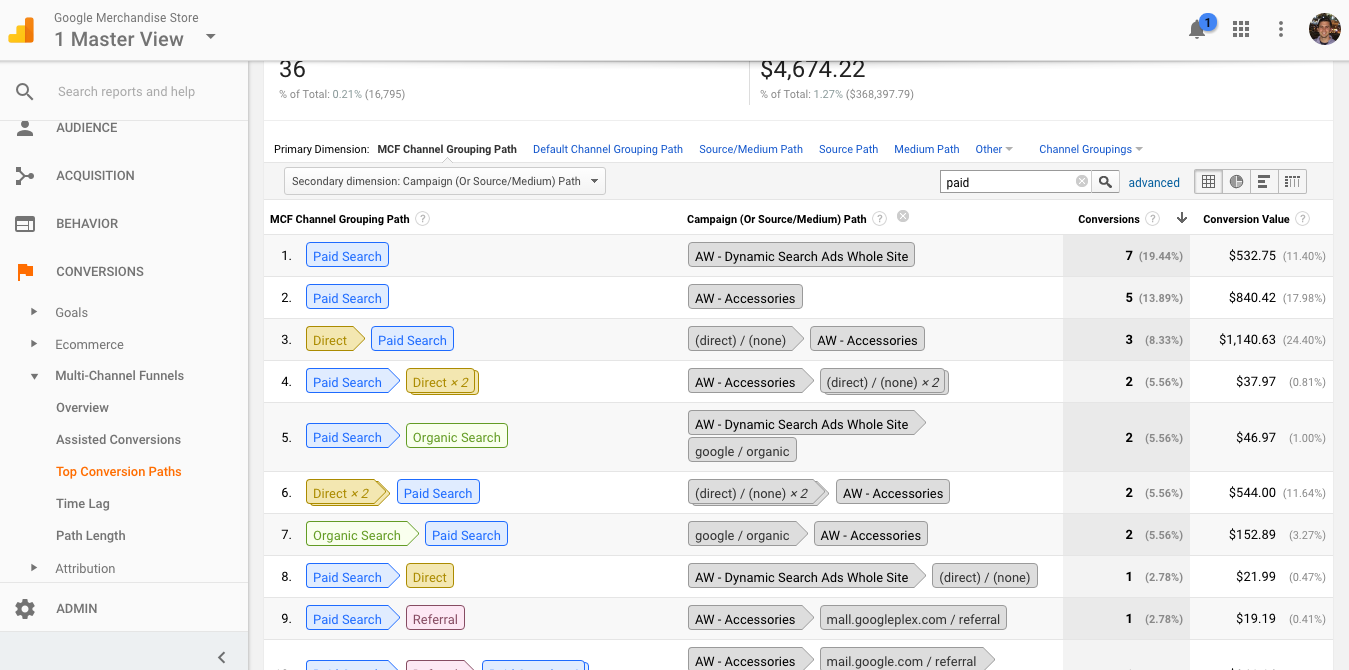
This allows you to see when in the purchase path people saw particular ad campaigns. Are these campaigns bringing in net new customers, or are your users seeing them late in the conversion path?
This report doesn’t necessarily model
Basic Attribution Models in Google Analytics
After you’ve explored your typical conversion paths and user behavior, you can explore preset
attribution models within Google Analytics.There are many different business-logic models. They all have some pros and some cons, so you’ll just have to weigh them in relation to your company’s abilities and needs in choosing the appropriate model (Google has a help document that is actually pretty good at explaining the relative pros and cons based on your goals).
You can also compare different models. Just go to Conversions > Attribution > Model Comparison Tool.
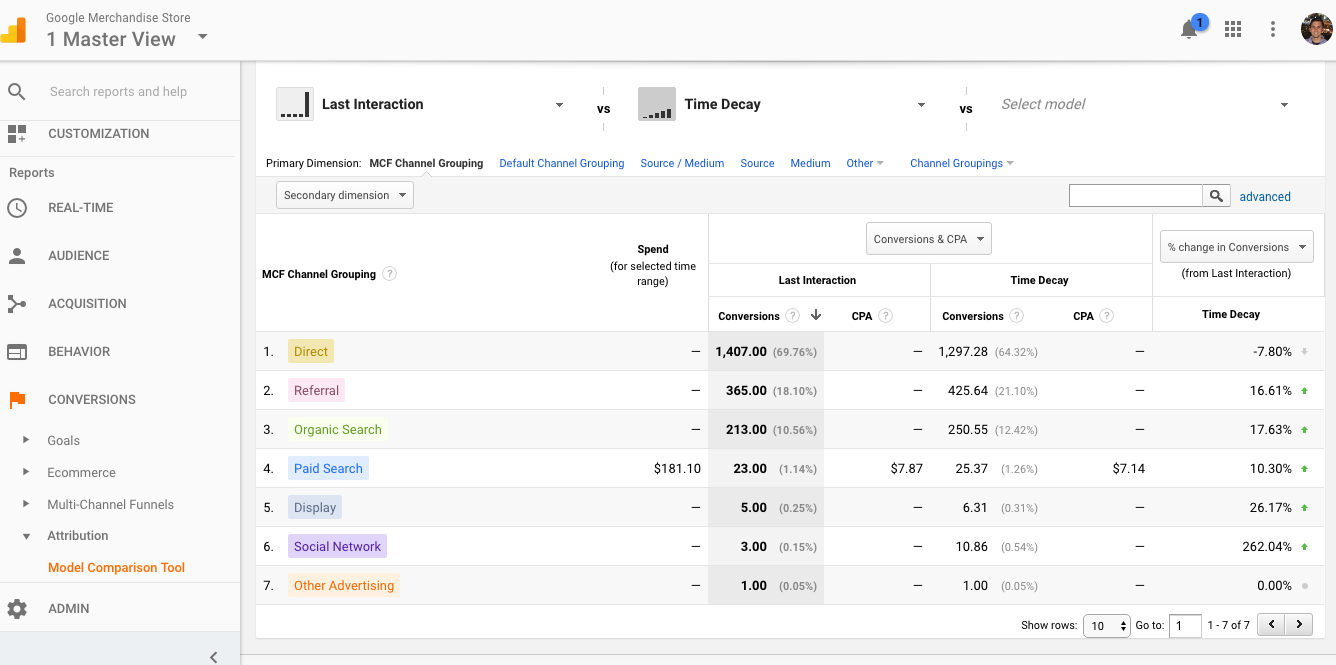
The following are the models you can access out-of-the-box with GA.
1) Last Click Attribution
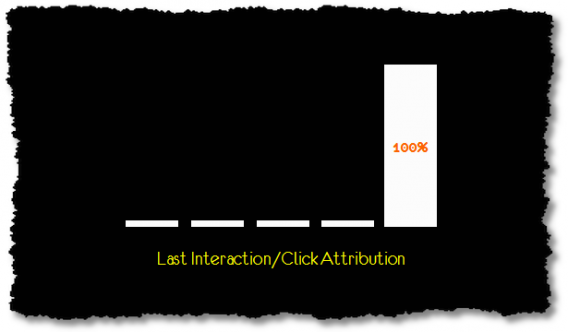
Last click attribution is probably the most common
As you can see from the image above, last click attribution is a transparently simple and inherently inaccurate model. It weighs all of the credit to the absolute last interaction. So, if that last interaction was direct traffic, it ignores any efforts you’ve put into social, email, etc.
As Avinash Kaushik put it, “The only use for last click attribution now is to get you fired. Avoid it.”
2) Last Non-Direct Click Attribution Model

Same deal with this model – it gives all the credit to the interaction before the last click.
Pros: it’s simple. Cons: it tends not to reflect the reality of marketing very well.
It will also almost always undervalue awareness touchpoints, because it will avoid crediting direct more often than not (given that direct visits often have some sort of precedent built by awareness campaigns).
3) Last AdWords Click Attribution

This model gives all the credit to your AdWords campaigns. It should be easy to see the inherent problems/conflicts of interest with this model. Of course, Google would like to attribute more value to AdWords campaigns, but what if a user is coming in from another channel other than AdWords?
4) First Click Attribution
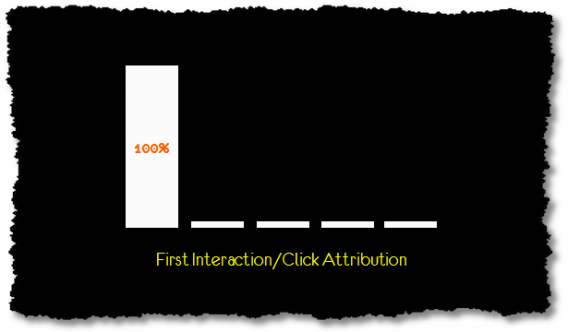
First click is the opposite of last click attribution. It comes with all the problems usually inherent with these narrow-focused models.
Only one touchpoint getting all the credit just feels wrong, unless your business has an incredibly simple marketing approach. As Avinash wrote, “First click attribution is akin to giving my first girlfriend 100% of the credit for me marrying my wife.”
5) Linear Attribution
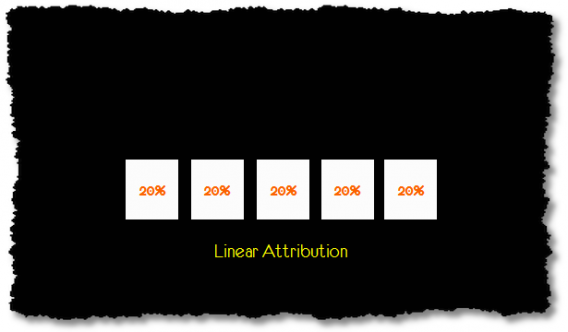
Here’s a model that distributes credit among more than one channel. The linear attribution model simply gives the same amount of credit to every touch point.
Of course, this is a highly idealistic model. Do you really think email weighs the exact same significance as paid, as organic, as social, etc., whether it’s the first, third, or last step before conversion? It is highly unlikely that is the case, but at least it incorporates other touchpoints.
6) Time Decay Attribution
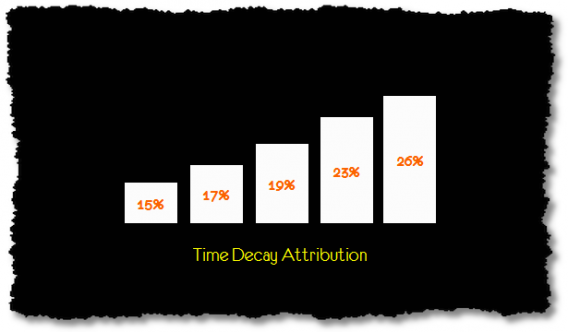
Time decay makes a bit more sense to me. The closer to the conversion, the more weight you give the channel in terms of credit.
7) Position-Based Attribution
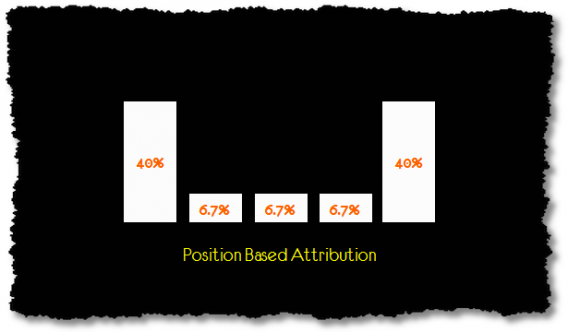
This model, sometimes known as the “bathtub model,” because it assigns greater weight to the interactions that occur first and last.
While you can tweak this, according to your beliefs and assumptions in your own data, the most common iteration of this divides 80% of the conversion value between the first and last interaction, and then gives 20% for everything in between.
This, however, is customizable within Google Analytics, if you feel there are different underlying assumptions with your data set.
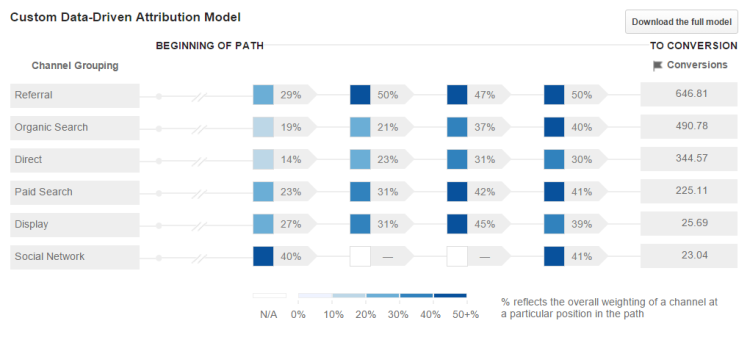
Custom and Advanced Attribution Modeling
There’s a chance one of the preset, business-rule-based attribution models will work with a high degree of accuracy for your business. However, I like to explore algorithmic, data-driven models in addition to these.
It’s actually fairly easy to run a Markov-based attribution model in the R Programming Language if you’ve got an analyst that can do so.
On a similar note, if you want the benefits of algorithmic attribution, but don’t want to learn R or Python--or you just want a smarter dashboard and reporting tool to integrate with your analytics suite--there are tools for that.
Google Analytics 360 offers algorithmic attribution in both the online and the offline arenas, meaning you can, to a certain degree of accuracy, gauge the effectiveness of your television campaigns.
There are other products than the ones Google offers (Convertro is one, Impact Radius another). There’s a whole ecosystem of products or suites that are trying to solve this problem, and the sales pitch for each is often compelling (though usually quite expensive).
Okay, but what can I do with this information?
You know analytics is important for conversion optimization, but you can also use this data to make better marketing and acquisition decisions. Essentially, you can make better decisions as to what marketing channels and campaigns to invest in.
If you’ve only ever relied on your out-of-the-box last click attribution model, you may never know the full value of specific display campaigns or referral campaigns. They’re often not given enough credit on such models. But if you’re using something equally simple but in the opposite direction, like first click, perhaps you’re giving too much credit to “awareness” campaigns.
Thinking about
As an example, at CXL, we believed certain community and referral traffic was not valuable, because of the extremely low volume of conversions attributed to last-click.
However, exploring the data with different out-of-box models as well as a Markov-chain-based model I ran in R, we could see that these touch points could be credited at assisting conversions, especially in the early stages of the customer journey.
Why Trust These Numbers?
You don’t have to blindly believe the numbers an attribution model spits out at you. In fact, you shouldn’t. You should always question the integrity of your data, especially if it isn’t absolute and is model-based.
If the data seems weird or incredibly surprising, it probably isn’t accurate, in which case you need to investigate.
On one side of the equation, marketers are loathe to trust simple models like last-click because of their obvious incomplete nature (unless your visitors all convert on the first session). On the other hand, it’s tough to trust an algorithmic model, especially if it’s relatively black box like many attribution software products seem to be.
These are two dichotomies of the same trust problem, but there’s a whole grey area in between where marketing and analytics teams should refine measurement processes, define what attribution models work for them, and begin trusting their numbers at a level where it makes it possible to make team and organization-level decisions.
But it begins with a conversation – with your team, boss, any stakeholders. What can you agree on to reach an actionable model, one on which you can inform decisions?
Google will, if not already done so, be democratizing their “data-driven” attribution model for everyone to use. This means that even those on the free platform will get to explore algorithmic attribution modeling.
Wrap Up on Attribution Analytics
Attribution is a rabbit hole. There are simple and probably inaccurate models and there are complicated models that may be more accurate (but also may not be).

Essentially,
It also may not be something you want, or need, to dive into deeply. If you’re primarily driving traffic and conversions with only a few channels, it’s probably superfluous effort. If you don’t have much of a consideration period, same thing.
The important thing is that you have the conversation and dip your toes into exploring attribution analytics. Crawl before you walk (really nail last-click before diving into algorithmic), and get organizational buy-in if you really want to get value out of it.