


Google Analytics for eCommerce isn't an optional thing if you run an online shop. Without measuring your efforts, it’s hard to improve what you’re doing.
But there’s some fog around the what Google Analytics can do. Most of us know how to find our conversion rate and transaction account, but these surface level insights don’t really give us much to base decisions on.
In reality, Google Analytics eCommerce tracking has tons of features beneath the surface that, if you implement and analyze correctly, will give you analytical superpowers.
There are some basic Google Analytics
So that's what we'll cover in this article.
Note: this article focuses exclusively on Google Analytics for eCommerce. There are, of course, many other tools of the trade, and there are also native Google Analytics for
Get brand new analytics strategies straight to your inbox every week. 23,739 people already are!
Google Analytics for eCommerce: The Basics
There are two types of
eCommerce implementations in Google Analytics:- Standard eCommerce reports, which allow you to see product and transaction information, average order value, eCommerce conversion rate, and other basic data.
- Enhanced eCommerce, which includes all of the standard features, plus more advanced information such as seeing when customers add items to their cars, seeing when they start the checkout process, and building more advanced funnel visualizations.
For the majority of this article, we’ll discuss cool stuff you can do with enhanced ecommerce, because the standard stuff is limited in its scope and power to fuel decisions. If you need a refresher on some of the standard e-commerce tracking features, check out this article.
Before that, though, we need to set up Google Analytics ecommerce tracking.
How to set up tracking
- Sign up for Google Analytics if you haven’t already.
- Implement the GA tracking code across your site (preferably with Google Tag Manager).
- Integrate your shopping cart (e.g. Shopify, Magento, BigCommerce) with Google. Analytics. Your shopping cart almost certainly has documentation on how to do this (just Google “Google Analytics + {Your Tool}” and you should be good to go).
- Enable eCommerce tracking in your Google Analytics View:
- Sign in to Google Analytics.
- Click Admin, and navigate to the view you want.
- In the VIEW column, click eCommerce Settings.
- Set Enable eCommerce to ON.
- Click Next step.
- Click Submit.
That’s the basic version of the story. There’s a lot more between the lines as well as a lot more complexity regarding a complete enhanced eCommerce setup.
Instead of stewing on the technical details in this article, we’ll brush over them in favor of explaining the features of
To really implement enhanced
eCommerce, you’ll need a developer or implementation specialist, anyway.Implementation resources
If you’re really interested:
What Google Analytics for eCommerce Metrics Matter?
Now for metrics. Let’s start with the basics. Everyone should be able to implement, analyze, and make decisions based on the following metrics. They’re quite common, and you’re probably familiar with most of them already--but let’s briefly review them, so we’re on the same page.
These are the standard

A few of the most important metrics are...
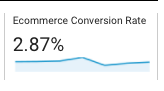
eCommerce Conversion Rate
You’re almost certainly familiar with a conversion rate. Here it is: Total
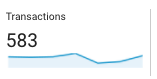
eCommerce Transactions
Transactions is equally straightforward: the total number of purchase orders on the site.
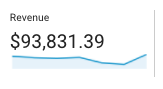
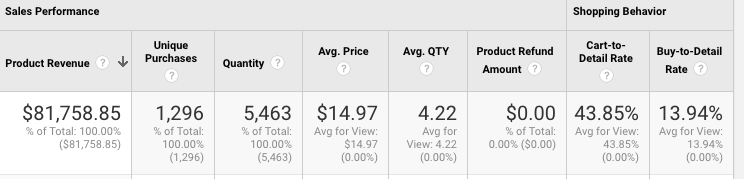
eCommerce Revenue
Revenue is the total amount of top line revenue that has been processed in that time period. This may include tax and shipping or it may not. It all depends on how you’ve set up your
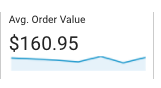
Average Order Value
Average Order Value = Total Revenue/Total Transactions.
Of course, the entirety of Google Analytics capabilities are also applicable to
Things like traffic acquisition analysis, user demographics, behavioral analytics, and device reports matter. So, when you’re diving into an Acquisition or Behavior report, the insights can clearly be applied to ecommerce--so we won’t cover the entirety of the Google Analytics interface in this article.
Rather, because of the unique Google Analytics ecommerce tracking features available, we’ll now focus on Enhanced Ecommerce and how you can go beyond basic traffic and conversion numbers.
Enhanced Google Analytics for eCommerce
The above features are standard
eCommerce features, but Google Analytics also has a newer implementation known as “Enhanced eCommerce.”Enhanced eCommerce is a complete redesign of eCommerce capabilities that allows you to better track the entire customer journey with more granularity.
All the classic (old) Google Analytics did for
But there are tons of interactions that eventually lead to a purchase or a checkout (or an abandonment). Enhanced eCommerce covers almost every interaction that could occur within a customer journey pathway.
Enhanced eCommerce Reports You Should Know
As I mentioned in the beginner of the article, implementing enhanced
eCommerce is straightforward.Implementing Enhanced eCommerce is simple. There’s a checkbox in settings where you can simply turn it on to get your additional reports.
However, just clicking the checkbox doesn’t fill in all of the reports with data. It will fill in the products and sales performance, which are largely the same, but the rest of them require additional code to get the data. This work will definitely require a developer or implementation specialist, so make sure you involve some technical talent in your Google Analytics eCommerce tracking setup.
Assuming you’re set up accurately, let’s briefly go over the individual reports. First up, there’s the overview:
Overview

As you would assume, this report gives you a bird’s eye view of your
Just a good glimpse at this report gives you solid view of your site’s performance, especially when you couple it with advanced segments and time period comparisons.
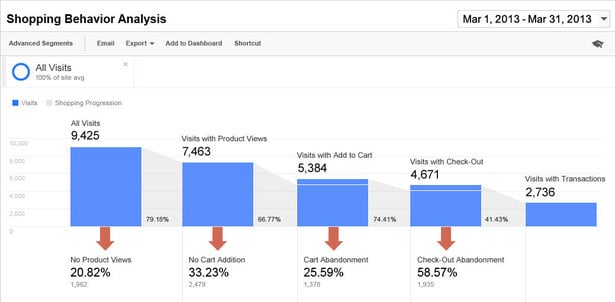
Shopping Behavior
Where things get interesting, and a bit different with Enhanced Ecommerce, are in the Shopping Behavior section (the second one in the left-hand navigation menu - we’ll move down one-by-one in this article):
Essentially, this report will show you a horizontal funnel, which is actually quite customizable in its use cases outside of
This funnel is worlds better than the typical goal funnel visualization in Google Analytics.
You see, here are many problems and limitations with the classic Google Analytics funnel (including backfilling of data, and the lack of segmentation capabilities). The horizontal funnel here largely avoids those limitations.
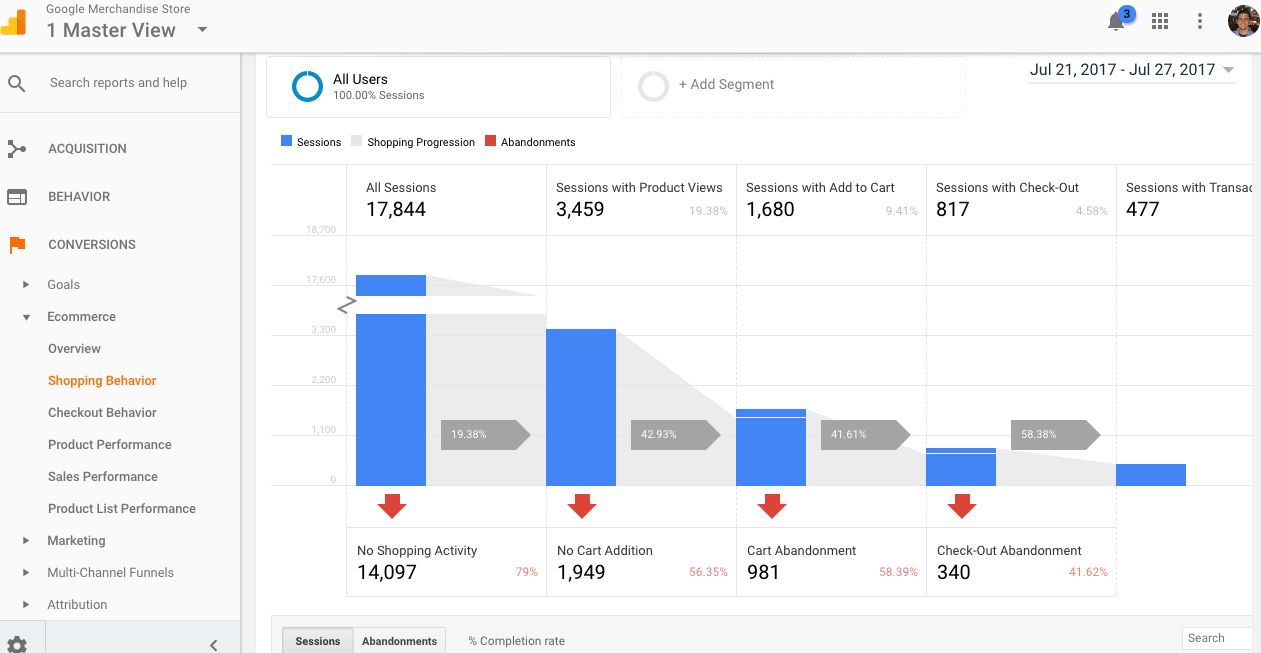
Return your attention to the horizontal funnel screenshot above. It shows you a lot.
It shows you that out of 17,844 total sessions, 3,459 of them viewed products. From there, 1,680 sessions included an “add to cart” action, etc.
We can mix it up further, still, and change our “Sessions” to “Abandonments,” giving you an inverse way of viewing the data. You can find this option directly underneath the funnel visualization:
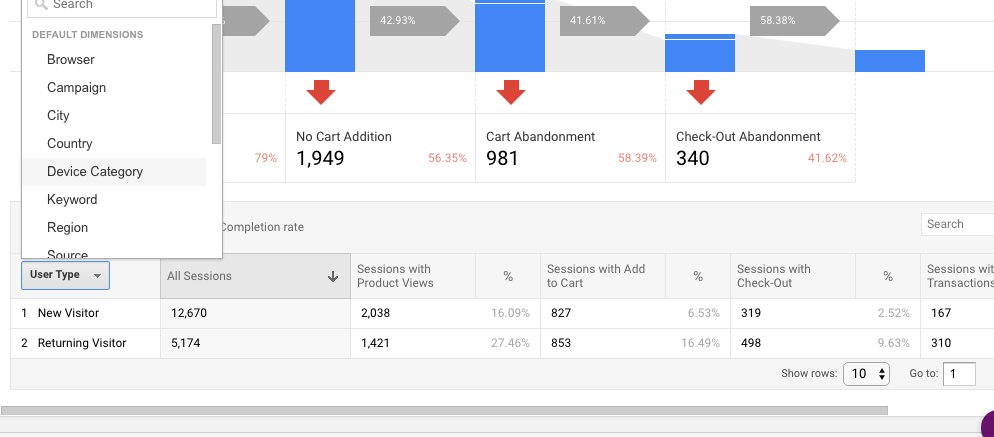
You can also view the funnel as a function of different dimensions (like browser, country, device category, or source).
For example, it’s very important to see what the performance of different devices are (maybe tablets are severely underperforming, so you’d like to see their funnel abandonment rates to find which step is tripping them up).
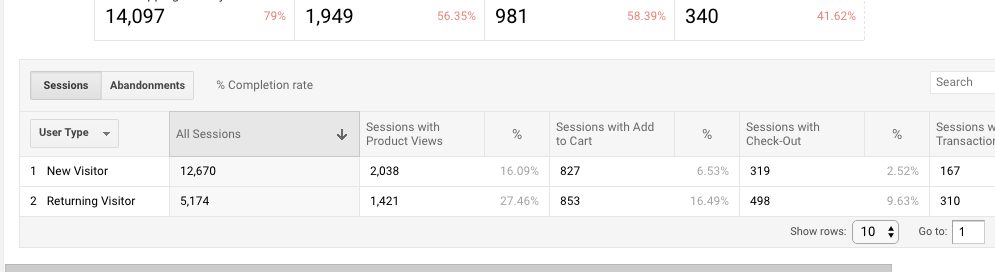
To view that, just click on “User Type” and select “Device Categories” from the drop down menu:
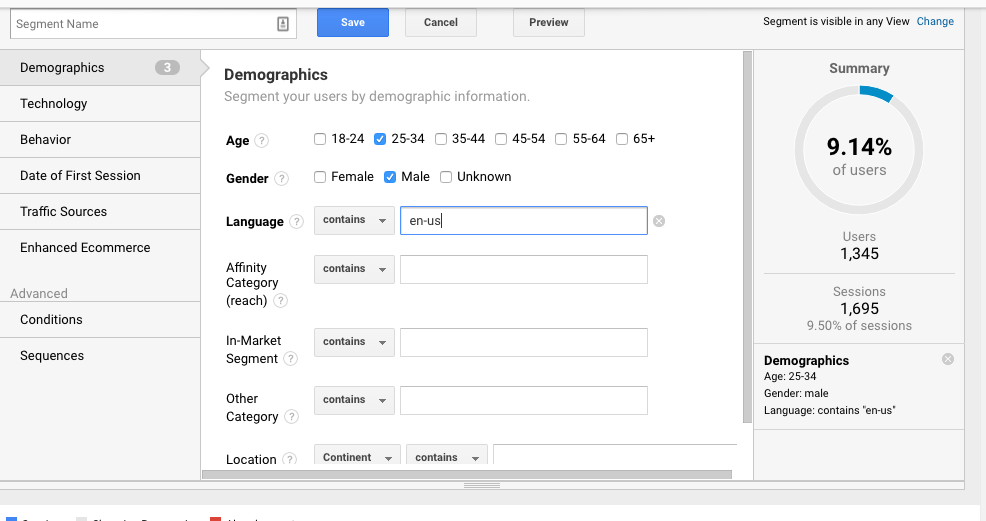
In addition, you can add custom audiences and view your
Another cool feature of this Enhanced
Checkout Behavior
Okay, let’s dive into the Checkout Behavior section, which acts as your standard checkout funnel visualization.
This is where you can see the beginning of the checkout process all the way through the transaction (also visualized horizontally).
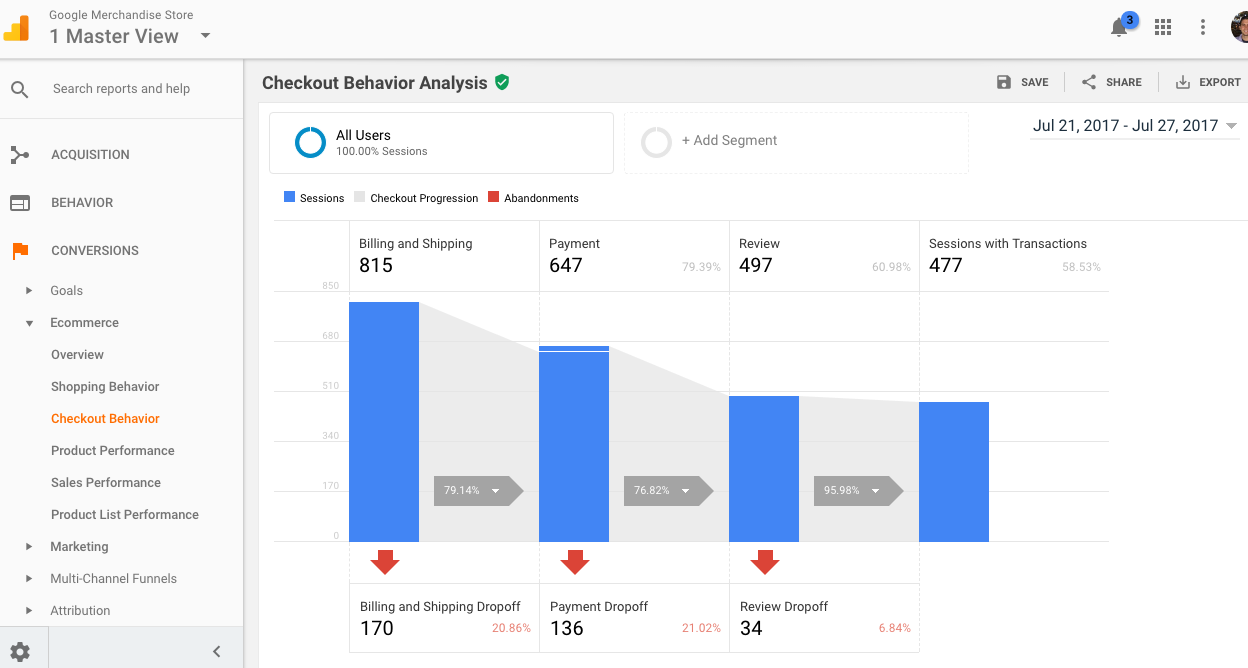
These are session based funnels, and you can customize them for your own setup. You can see here that Google’s store uses Billing & Shipping → Payment → Review → Sessions with Transactions (which is quite prototypical of an eCommerce site).
All of the same functionalities exist in the Checkout Behavior funnels that I showed above in the Shopping Behavior section (segmentation, dimensions, etc.), so we won’t dive too deeply in the Checkout Behavior report.
Product Performance
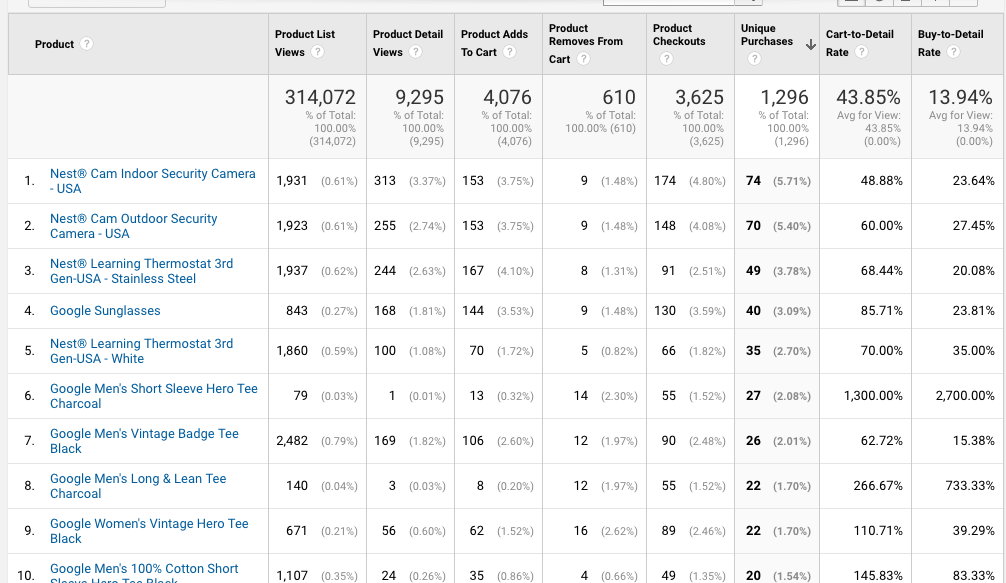
Moving onto the Product Performance section, we get to see individual products and product details at a granular level...
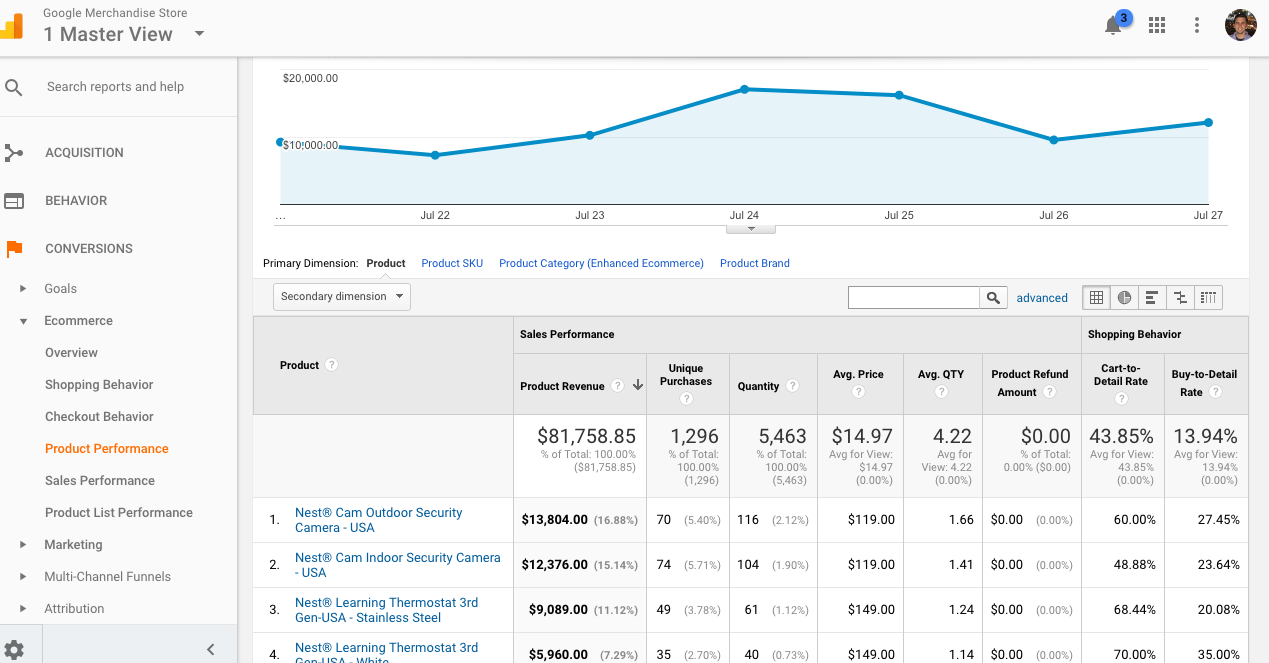
There are a lot of pretty typical metrics here like product revenue, unique purchases, and average price, but there are also some that are unique to Enhanced
For instance, cart-to-detail rate is what percentage carted the product versus viewed the detail, and buy-to-detail rate is what percentage bought the product versus viewed the detail. Refunds are self-explanatory.
With Product Performance reports, you can also filter by other primary dimensions, including Product Category, Product SKU, and Brands.

One of the coolest parts of the Product Performance report, however, is when you scroll back to the top to “explorer” and instead of viewing the “summary” report, change it to the “shopping behavior” report.
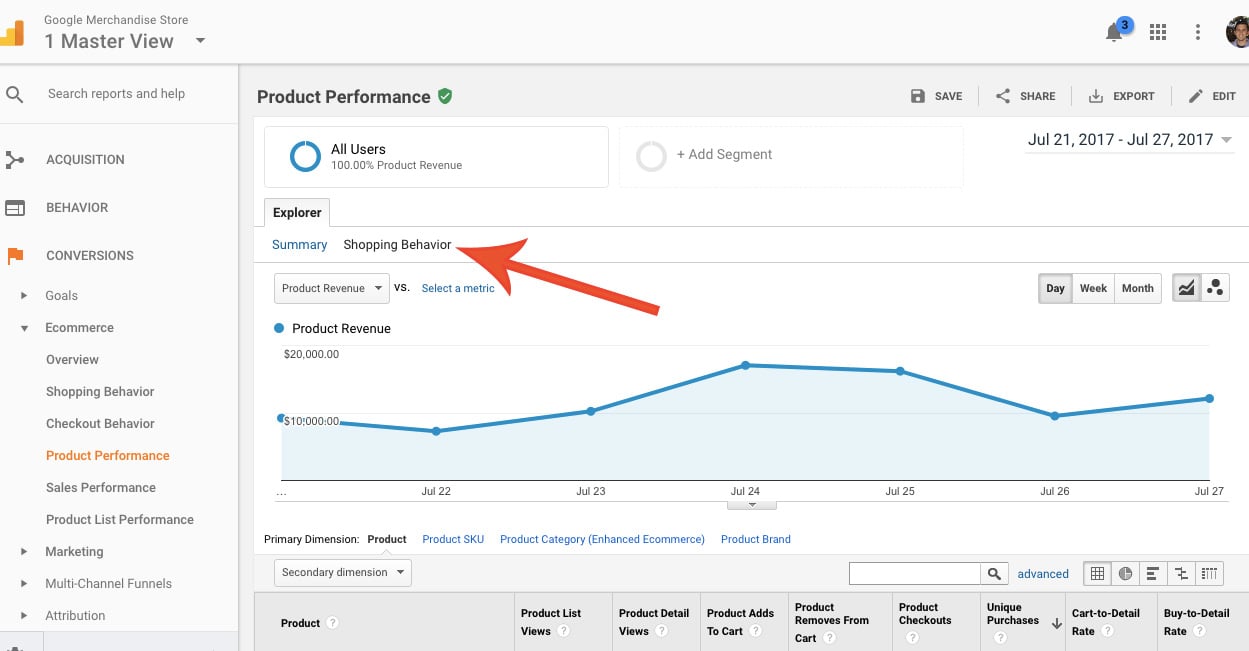
This opens up a new report where you can view pretty much any interaction related to all of your products. This includes Product List Views, Product Detail Views, Product Adds to Cart and more. This allows you to answer questions such as:
- Which products are being viewed the most?
- Which products are being added to cart the most?
- Which products have the highest drop-off once they’re added to the cart?
...And almost any other product related business question you care about.
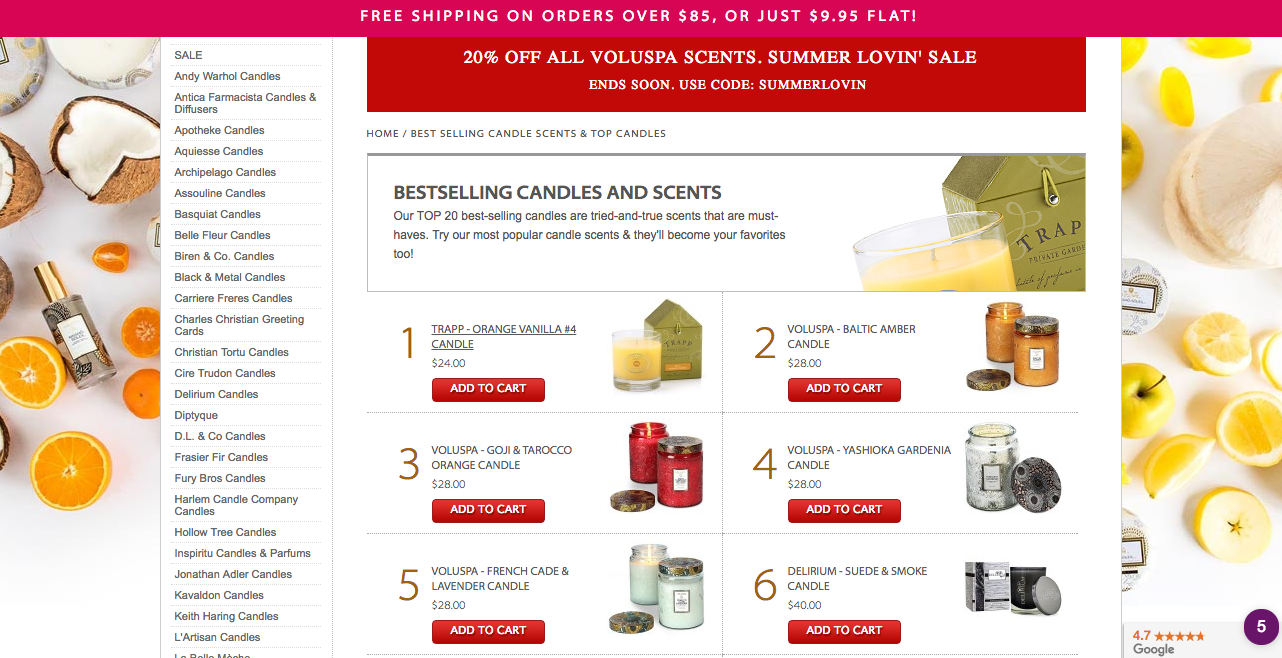
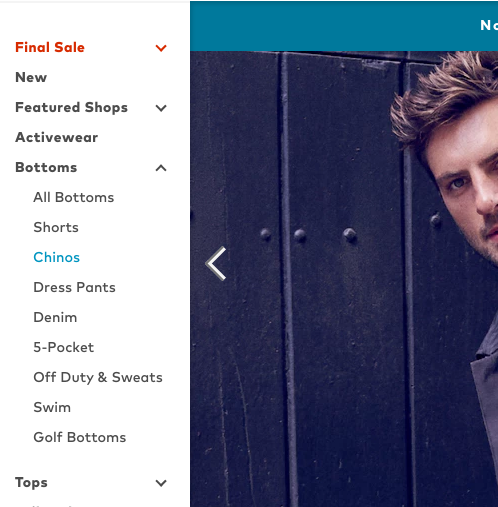
The one metric here that may be a bit confusing or new is “Product List Views.” This, essentially, is an impression, and it’s when a product is seen on any given “list page” (read more about Product Lists here). For instance, if I’m shopping for candles and navigate to the Bestsellers page and see the Trapp - Orange Vanilla #4 Candle, that counts as a Product List View.
In other words, if we were shopping on Bonobos.com, all of the below items would be considered Product Lists (Final Sale, Bottoms, All Bottoms, Shorts, etc.):
We can skip Sales Performance for now, and we’ll move on to Product List Performance as it’s an easy transition.
Product List Performance
Product Lists represent a logical grouping of products on your site, based on your ec.js tagging. You can use them to represent:
- Catalog pages
- Cross-sell blocks
- Up-sell blocks
- Related-products blocks
- Search results pages
Here, we can begin to do Product List optimization. You can gain a few quick insights in this area by asking a few questions:
- Are there any Product Lists that are viewed a ton, but very rarely clicked?
- Which Product Lists produce the most revenue?
- Which Product Lists are underperforming when it comes to revenue?
- Which ones are not being engaged with at all?
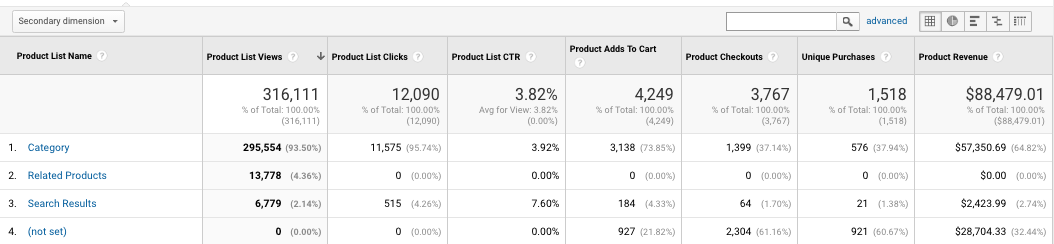
After that, you can drill down into individual lists by clicking on them. For instance, clicking on the “Category” list on the Google Merchandise Store account (the first one in the screenshot above), we get the following:
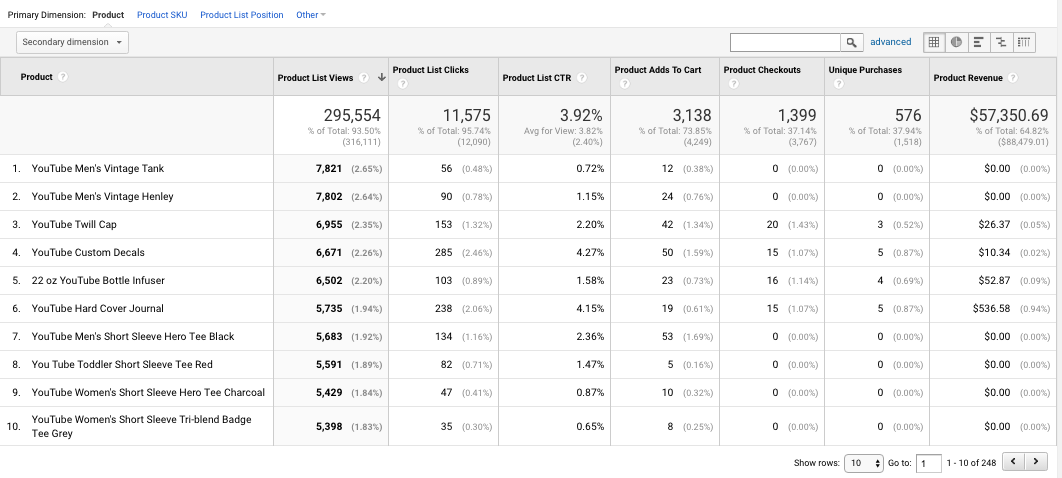
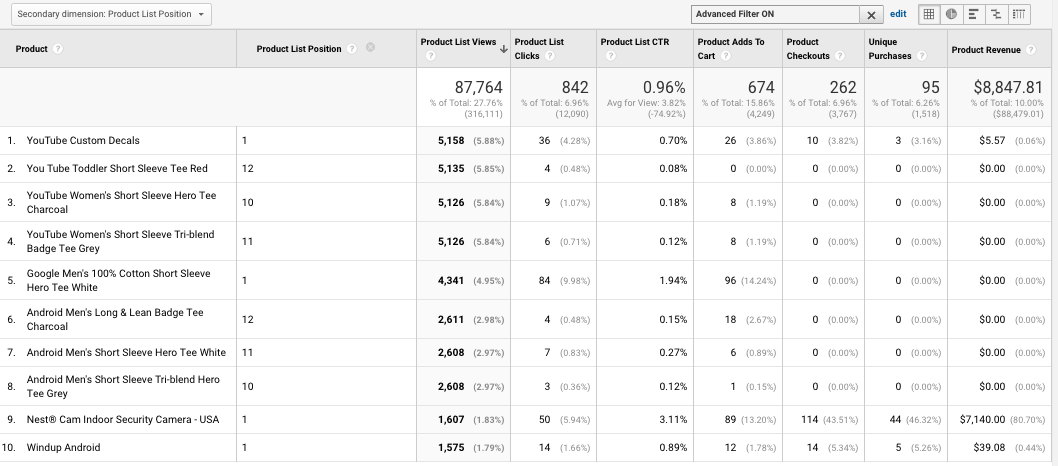
Another thing you can do for further insights (especially regarding optimization) is to add Product List Position as a secondary dimension:
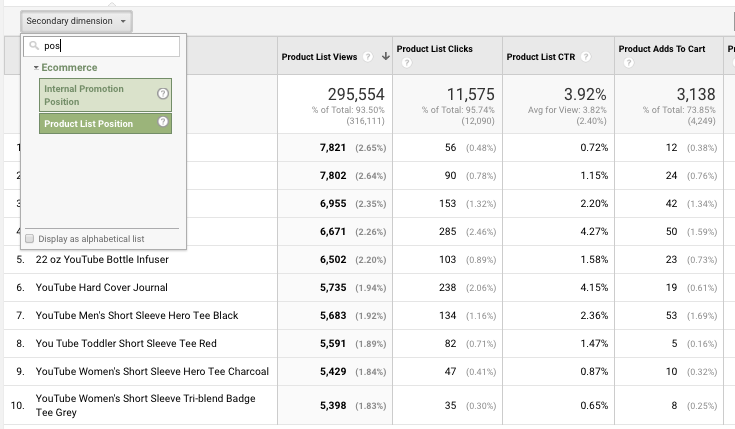
By doing this, you can compare products that were served in similar positions, but may have triggered very different user behavior.
For instance, check out the screenshot below. Even though YouTube Custom Decals and Google Men's 100% Cotton Short Sleeve Hero Tee White were both served in position one, the latter had a much higher click through rate than the former. Additionally, the Nest® Cam Indoor Security Camera - USA had a much a much higher CTR and revenue than both.
This can help you answer business questions like:
- How effective is one product compared to another?
- What happens when we place this product first versus fifth in a list?
- Is our site architecture ideal or are there some obvious inadequacies shown in the data?
Now we can run experiments where we change the order of given products, and see how that affects product and product list metrics as well as user behavior.
Moving onto the next feature of Enhanced
Marketing
One of the most important things that this allows us to do, as marketers, is to view the results of any given on-site campaign or promotion.
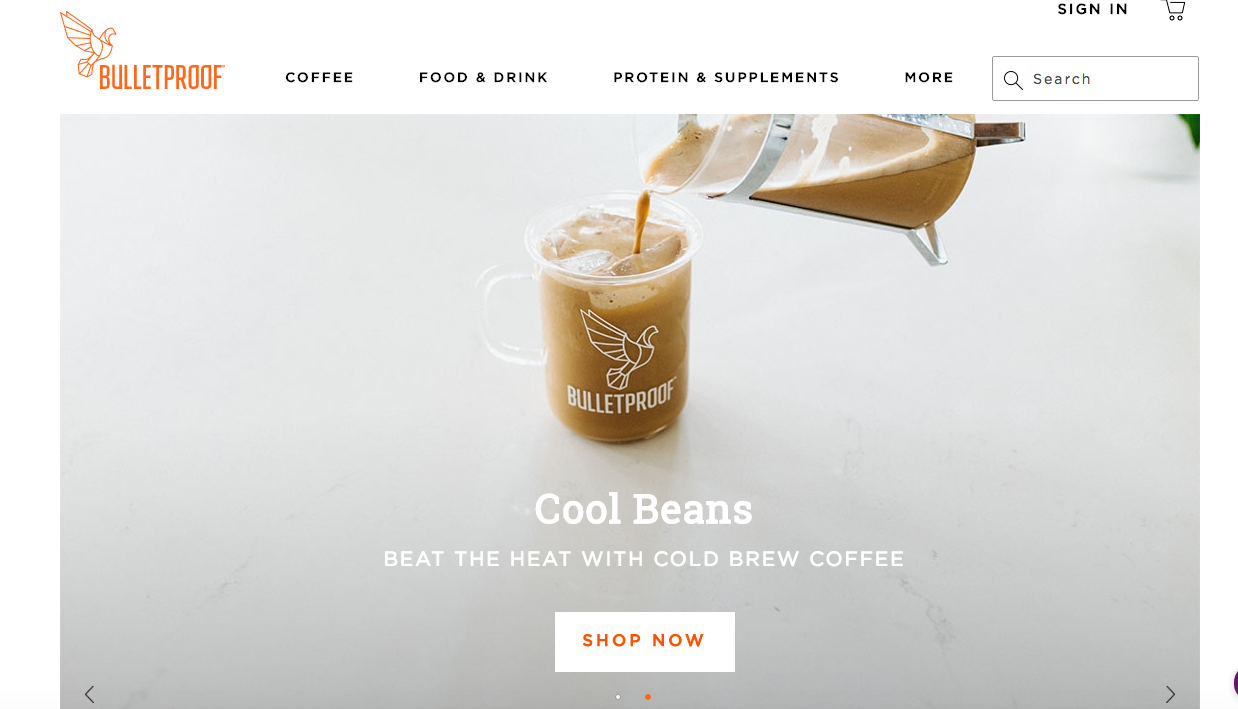
On your site, there are likely calls to action all over your sites, especially on the home page. For instance, BulletProof asks you to “Shop Now”:
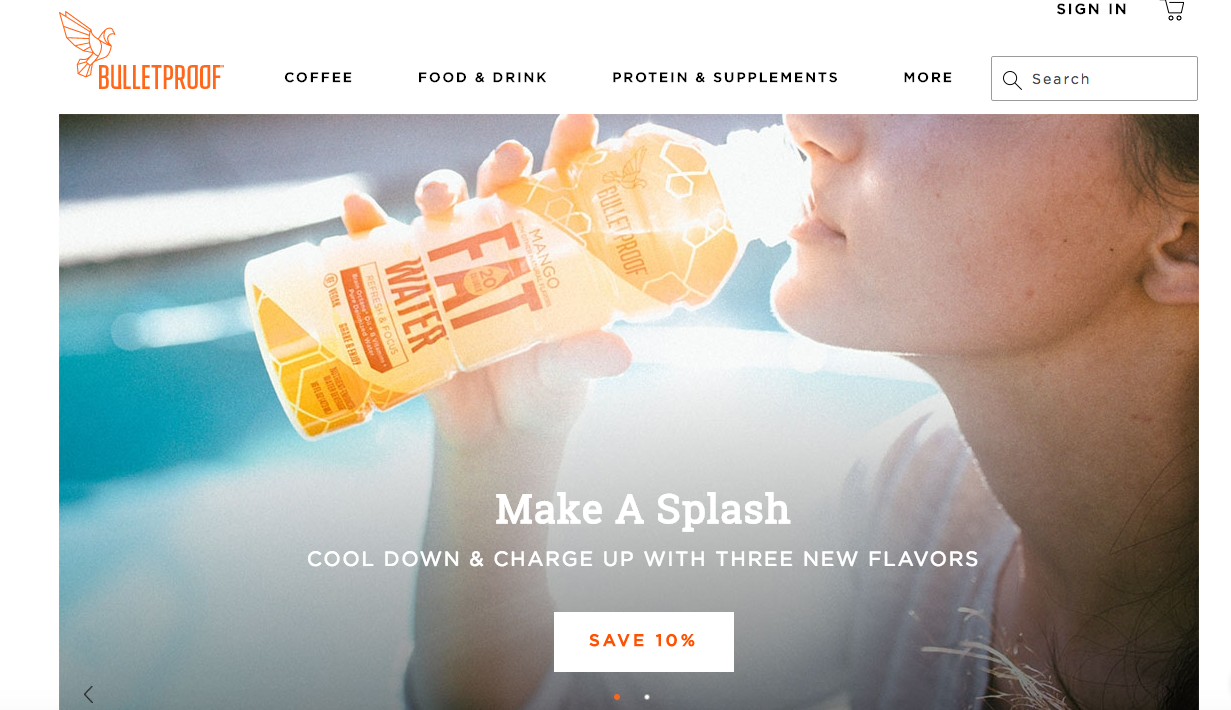
And they also tell you that you can save 10% (they use an auto-rotating slider):
How can we track the performance of each particular call to action? The worst possible way you could do it is by adding UTM parameters to the button - never do that. It breaks the attribution in Google Analytics. Never use UTM parameters when you’re linking one part of your site to another.
No, instead, we can use a new feature of Enhanced
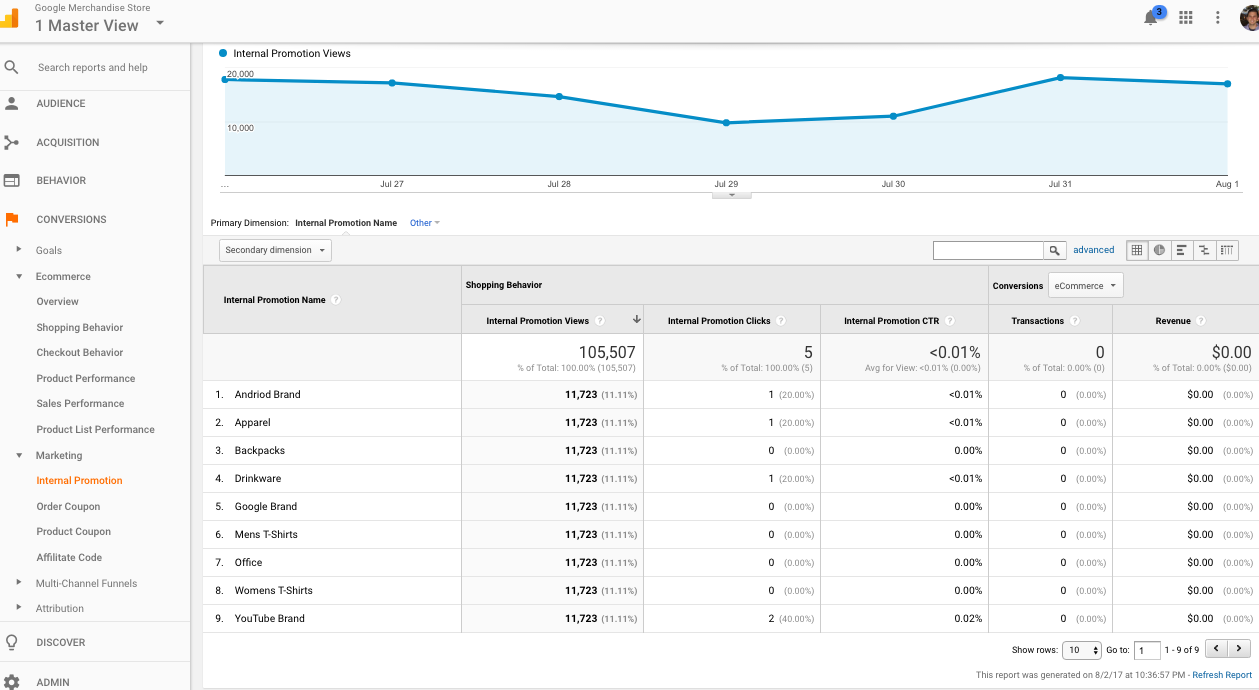
There, you can see impressions, clicks, CTR, transactions, and revenue for each promotion. You can also add a few relevant secondary dimensions, including Internal Promotion Creative, Internal Promotion ID, and Internal Promotion Position. I like to use the position one, because we can then compare promotions based on what position they were in. This allows you to ask business questions such as:
- How effective was that new banner we put on the homepage last month?
- How do people interact with our homepage slider?
- How’s the new seasonal promotion doing?
The other two important features in the Marketing section of Enhanced
The Order Coupon section is where you apply a coupon on the entire cart, and the Product Coupon is where you have product specific deals.
Finally, there’s an Affiliate Code section if you work with affiliates.
I haven’t explored this section as much, but there are many places you can read up on it, including this post.
Going Beyond: Advanced Google Analytics for eCommerce Strategies
While we covered a lot of the features and reports inherent in Google Analytics
eCommerce tracking (both the standard and enhanced versions), we didn’t really traverse the ground of “best practices” or tips.That’s because, like anything in the digital analytics space, it’s almost certain that your situation is unique. That’s why, instead of giving you any hacks here, I tried to lay out example business questions. That’s where it all starts. Approach analytics strategically: scope out what you’d like to track, why it will be important, and use data to answer your important business questions. That’s where you’ll get the most value.
If you want a good article about approaching analytics strategically, this Analytics Demystified article is a great read.
Past that, I want to briefly mention (but not dwell on) that you can customize your setup to a dizzying level. You can set up calculated metrics to more accurately depict your revenue, for instance (say you want it to show Revenu - tax and shipping).
You can also do pretty advanced level stuff like using the related products feature and correlation scores to visualize and showcase related products.
Generally speaking, the top 1% of analysts are constantly innovating and (usually) publishing the cool stuff they make these tools accomplish. So, to keep sharp, follow the top analysts and their work, and make sure you follow key blogs, especially Analytics Pros, Analytics Demystified, and Simo Ahava’s blog.
One final tips: always integrate your Google Analytics data with your ecommerce shopping cart. Look for discrepancies and use both to maintain a view of the whole picture. In addition, always integrate your pre- and post-purchase data. It’s the only way to get a complete view of the customer journey and advertising efforts.
Wrap Up on Google Analytics for eCommerce Tracking
If you run an online shop,
Google Analytics for eCommerce is something that you definitely use. But are you getting the most out of it? Enhanced eCommerce offers tons of features that makes your analytics tracking eminently customizable and able to answer the toughest of business questions.In addition, Google is constantly improving and updating their eCommerce tracking features, and the top 1% of Google Analytics power users are always coming up with innovative ways to use the tool. By its nature, this article is incomplete. The rabbit hole runs deep, my friends. Just keep learning, stay humble and curious, and continue to seek insights and you’ll be fine.