


Steal this framework for a data-driven approach to setting and measuring B2B marketing performance.
Ingredients
Instructions
Most B2Bs pick a random goal that sounds good and hope for the best.
This sets teams up for failure.
The optimal way to set and track goals is to base them on real-world data and tie back to your core business objective.
This makes them challenging yet achievable and helps you communicate impact to senior leaders—a one-two punch combo that stretches your marketing team whilst keeping them motivated.
Here’s the exact goal framework we use for clients and our own marketing at KlientBoost.
Map Out Your Customer Lifecycle Stages
First, map out your customer lifecycle stages into the top row of a spreadsheet to establish a baseline.
For most B2Bs, this will look something like the chart below.
Tweak it based on any lifecycle stages unique to your own business.
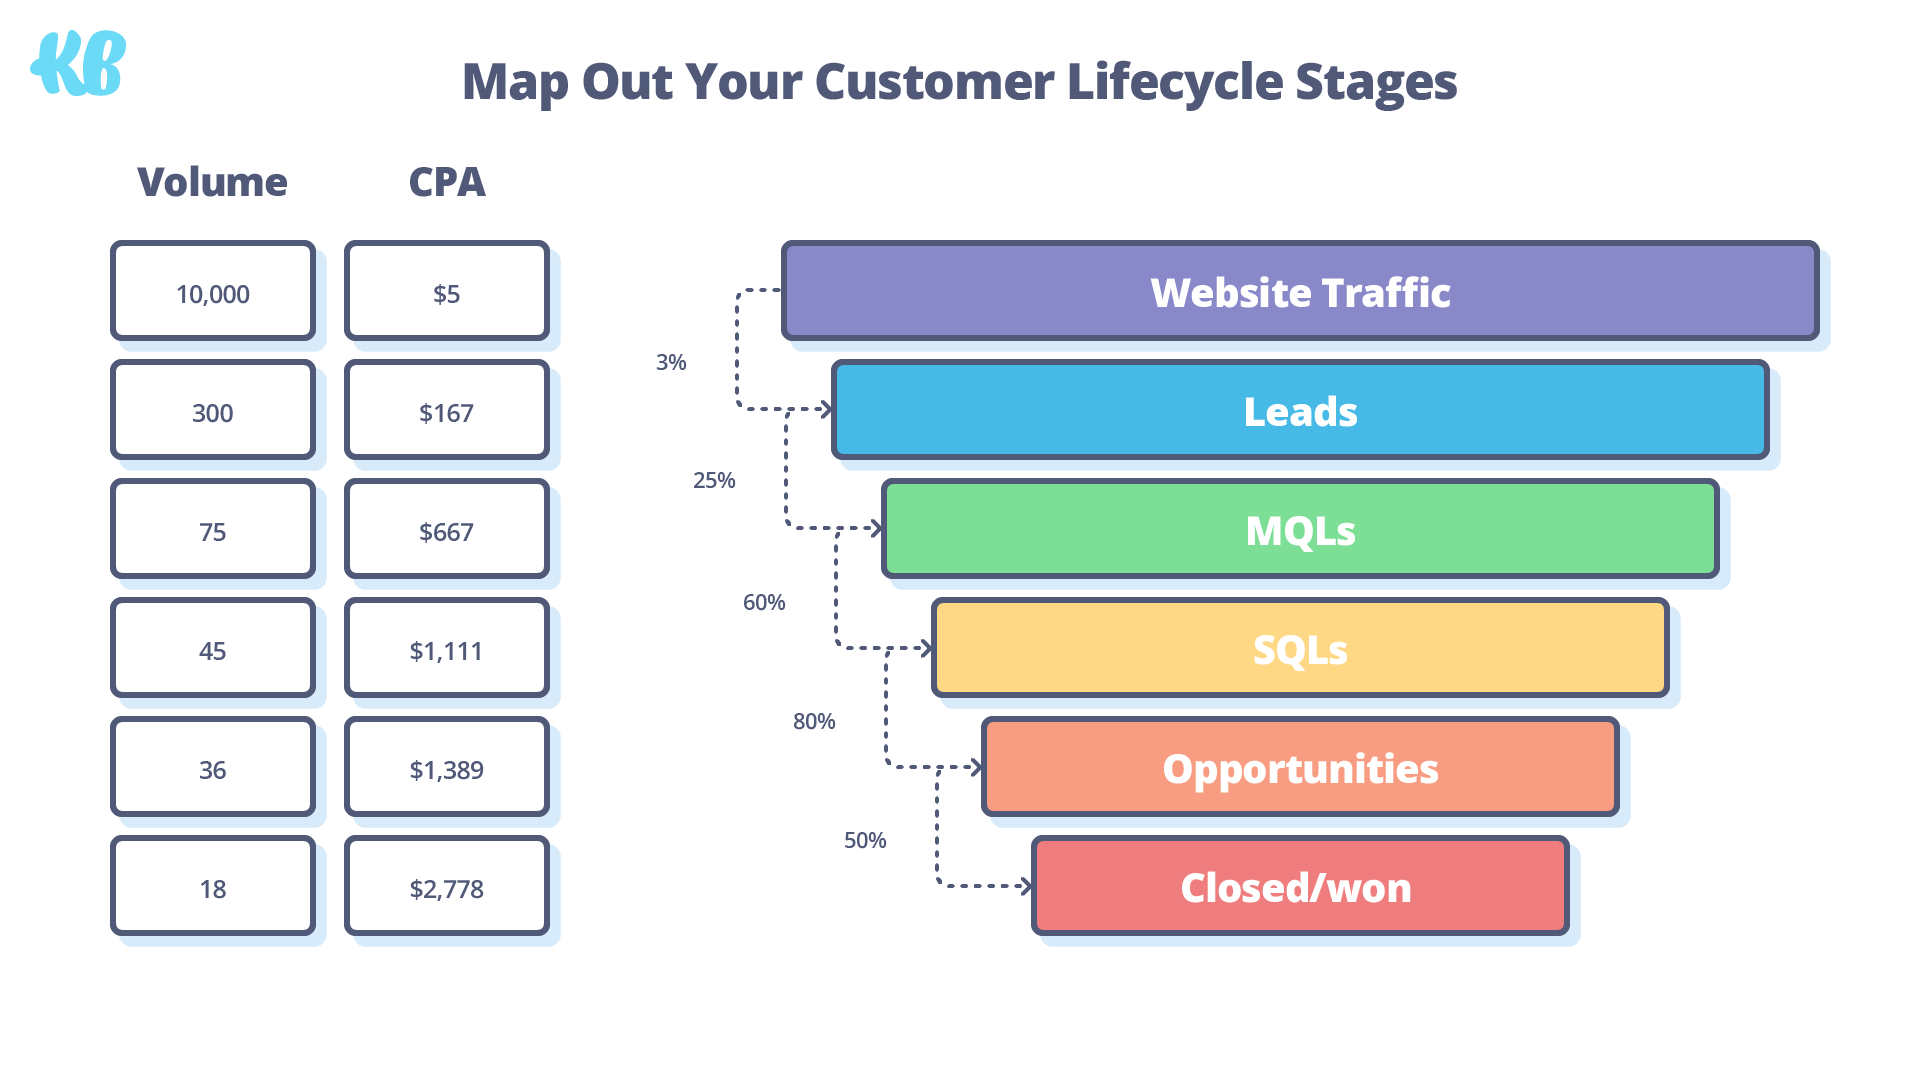
In the subsequent rows, you’ll want to add volume, cost per acquisition (CPA), and conversion rate for each stage.
This exercise allows you to set a baseline based on past performance—super important for setting realistic goals that don’t burnout and dishearten your team.
The baseline period you use as a benchmark will depend on what type of B2B you are:
- Startups with no historical data should use industry benchmarks for CPA and conversion rates. They can then reverse engineer estimated volumes based on the planned marketing budget. The aim should be to transition to using their own data as a baseline as quickly as possible.
- Scaleups in a hypergrowth phase should use either the previous month or quarter as their baseline as they’re less impacted by seasonality than more established B2Bs.
- Established B2Bs who are aiming for smaller incremental year-on-year improvements should use the previous year's data as this accounts for any seasonality. Failing to account for seasonality is one of the biggest mistakes a B2B can make.
Now all your data is plugged into the spreadsheet, you’re ready to move onto step two.
Isolate Growth Levers
Analyze your lifecycle stages to identify the areas where your marketing team can have the biggest direct influence.
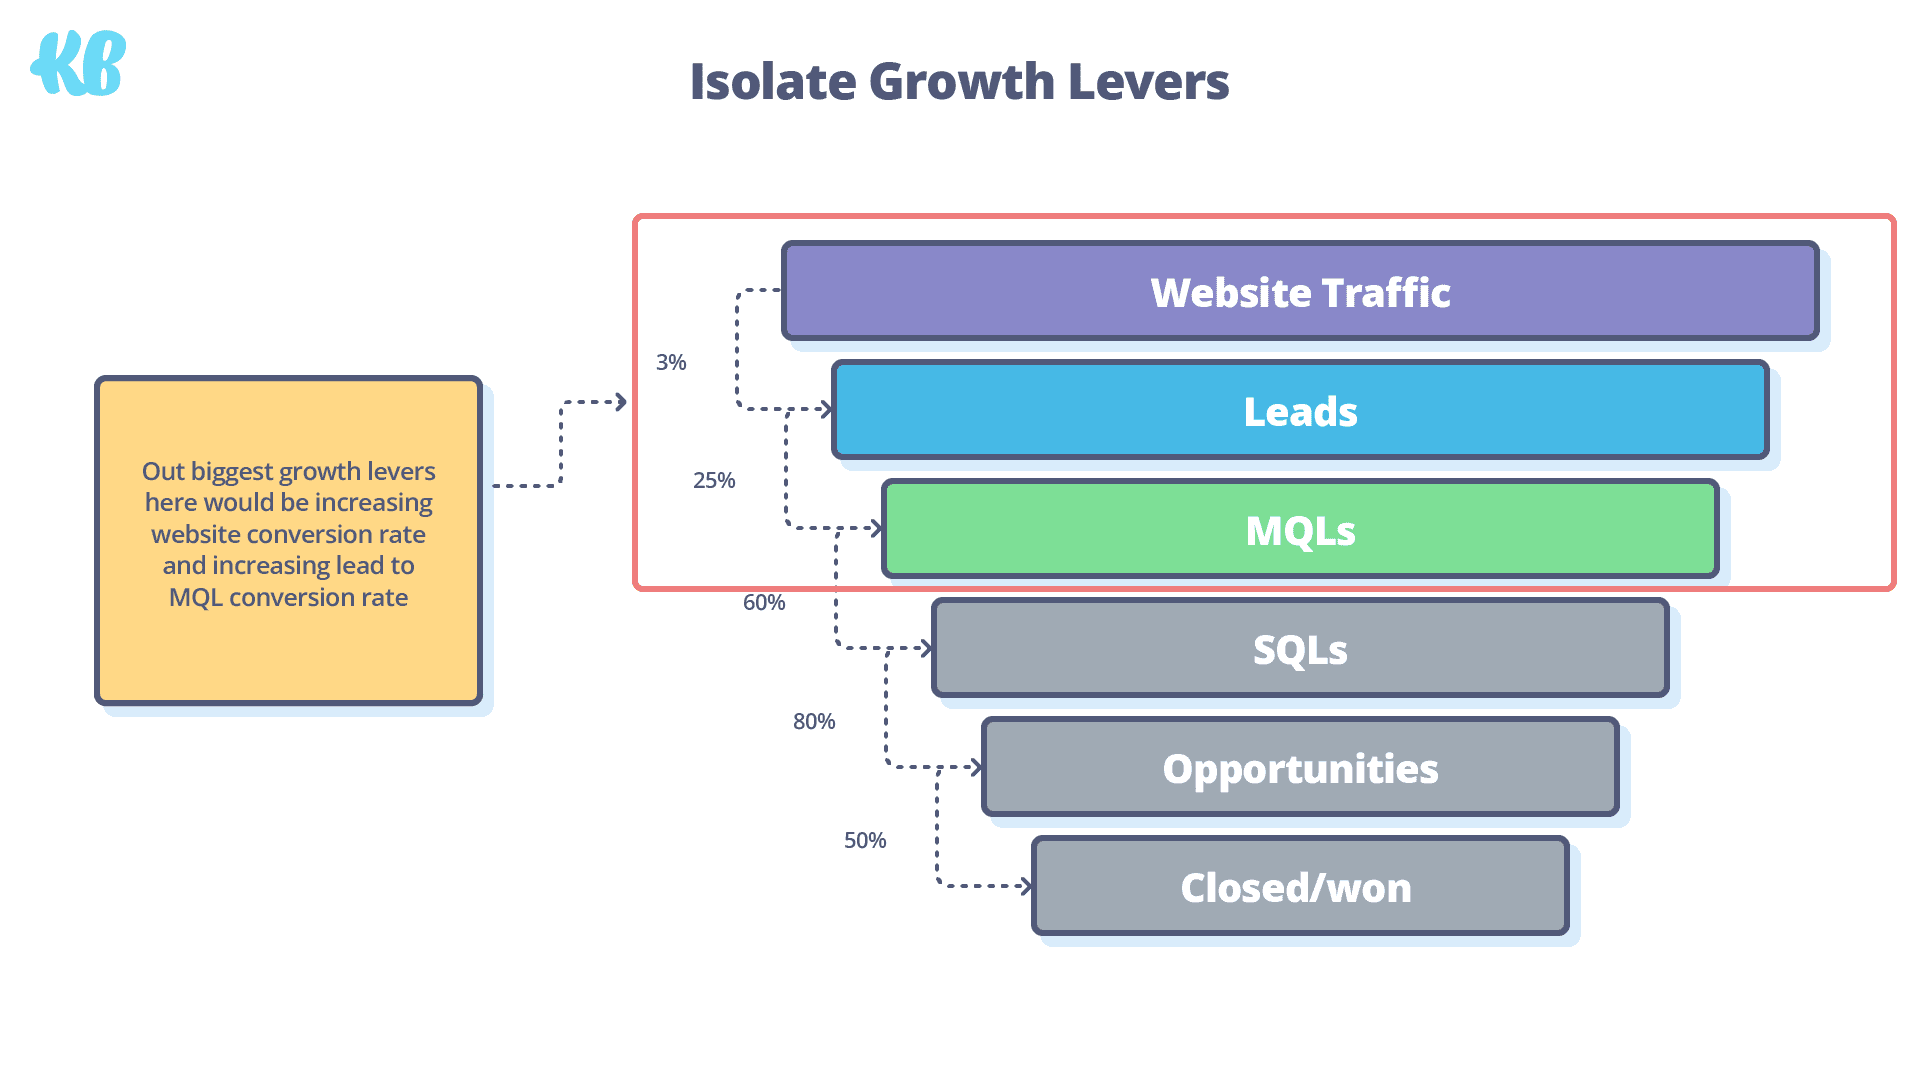
If we analyze the example data from the image in the previous step, here’s what we can conclude:
- MQL to SQL conversion rate is high at 60%. This tells us our MQL quality is good.
- Lead to MQL conversion rate is at 25%. This means 75% of leads aren’t qualified.
- Website traffic to lead conversion is lowest at 3%. This means 97% of website traffic isn’t ready to buy.
Based on this, our two biggest growth levers are improving website lead volume and improving website lead quality.
We need more leads and we need more of them to convert to MQLs.
Now we’ve identified the problem, it’s time to figure out how we’re going to achieve it.
Reverse Engineer Your Goal
Most B2Bs set a goal without first considering how they will achieve it.
Big mistake.
Instead of being strategic, intentional, and data-driven, they’ll throw spaghetti at the wall and hope for the best—a terrible strategy that almost always fails.
Instead, B2Bs should reverse engineer what needs to be true to support your core business objective.
Since you did your baseline setting homework, you have all the data you need to do that (gold star for you 🥳).
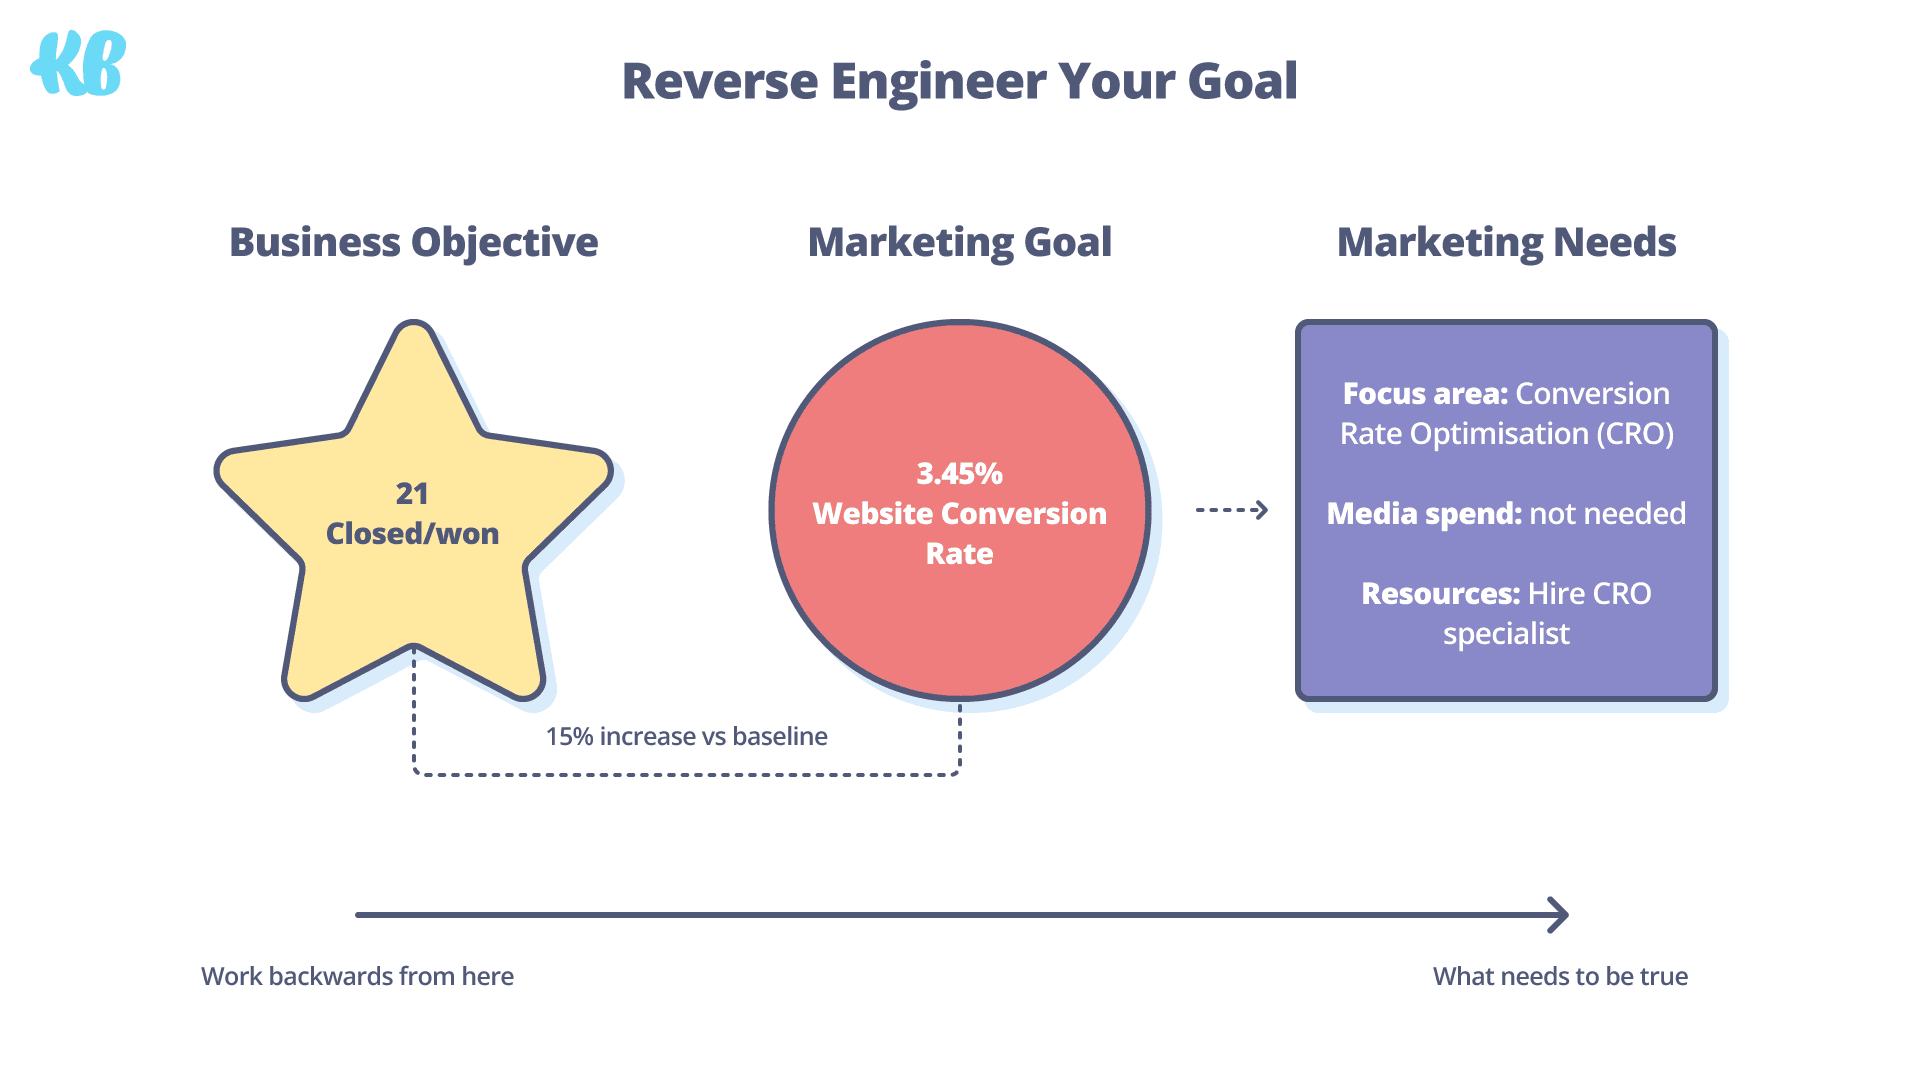
Let’s say your business sets an objective to increase closed/won 15% this quarter.
Here’s what we know:
- A 15% increase from 18 means we need 21 closed/won
- Website conversion rate is marketing’s biggest growth lever
- Forecasted lifecycle stage conversion rates based on baseline
Assuming that our lifecycle stage conversion rates stay the same, a 15% increase in website conversion rate—from 3 to 3.45%—will ensure we hit our business objective.
That’s the goal sorted. Now we can make a realistic plan too.
Since we’re increasing website conversion rate, we won’t need additional media spend—more of our traffic will convert to leads so we don’t need to buy more.
However, if we don’t already have the knowledge or resources to improve conversion rate in-house, we’ll need to source them.
This could mean hiring a Conversion Rate Optimisation specialist, freelancer, or agency.
See below:
Goal ✅
Plan ✅
Now it’s time to learn the best way to measure our performance.
Time vs KPI Tracking Charts
Time vs KPI tracking charts show you what percentage of your goal you've achieved vs the percentage of time that’s elapsed over a given time period.*
They make it easy to visualise whether you’re on or off track to hit your goal:
If you're on track, double down on what's working.
If you're off tracking, it's time to hit the drawing board and reassess your strategy.
Tracking multiple KPIs? Simply duplicate the chart and track them all independently.
The KlientBoost marketing team has goal tracking charts for over 20 KPIs—that’s how we ensure we’re continuously getting better and covering all of our bases.
Regularly Review Your Goal
Business priorities change and demand fluctuates throughout the year.
For this reason, we recommend against setting and forgetting your goal.
Market conditions and audiences you planned for may be completely different in 3-6 months—this will make your strategy ineffective at best and destructive at worst.
Neither are optimal positions to find yourself in.
Reassess your goal based on the most up-to-date data at least once per quarter.
It couldn’t hurt to give it a sense check more frequently either.
Ad costs rising? Reassess.
Changed your audience? Reassess.
Shifted your core business objective? Reassess.
Now—LFG crush those goals 🤘
—