


We all know what infographics are supposed to do. You have a bunch of data that you think is so good that the world should know about it, and now you'd like to make it visually appealing, and at the same time, easy to consume.
So you create a vertical list with images and text that ooohhh and aahhh, and if you do it right, hopefully your infographic will be shared many times over. Creating a viral effect that helps establish you as an authority in your field. Once all the rage, infographics are now far too common to be cool anymore. They're mainstream.
It takes more than just simple templates to create unique infographics. It takes humor, amazing design, and most importantly, information that is worth sharing.
That's why it's important to applaud the beautiful and scold the ugly. And even though I'm actually sharing these infographics, please understand its for the wrong reasons ;)
Get brand new marketing strategies straight to your inbox. 23,739 people already are!
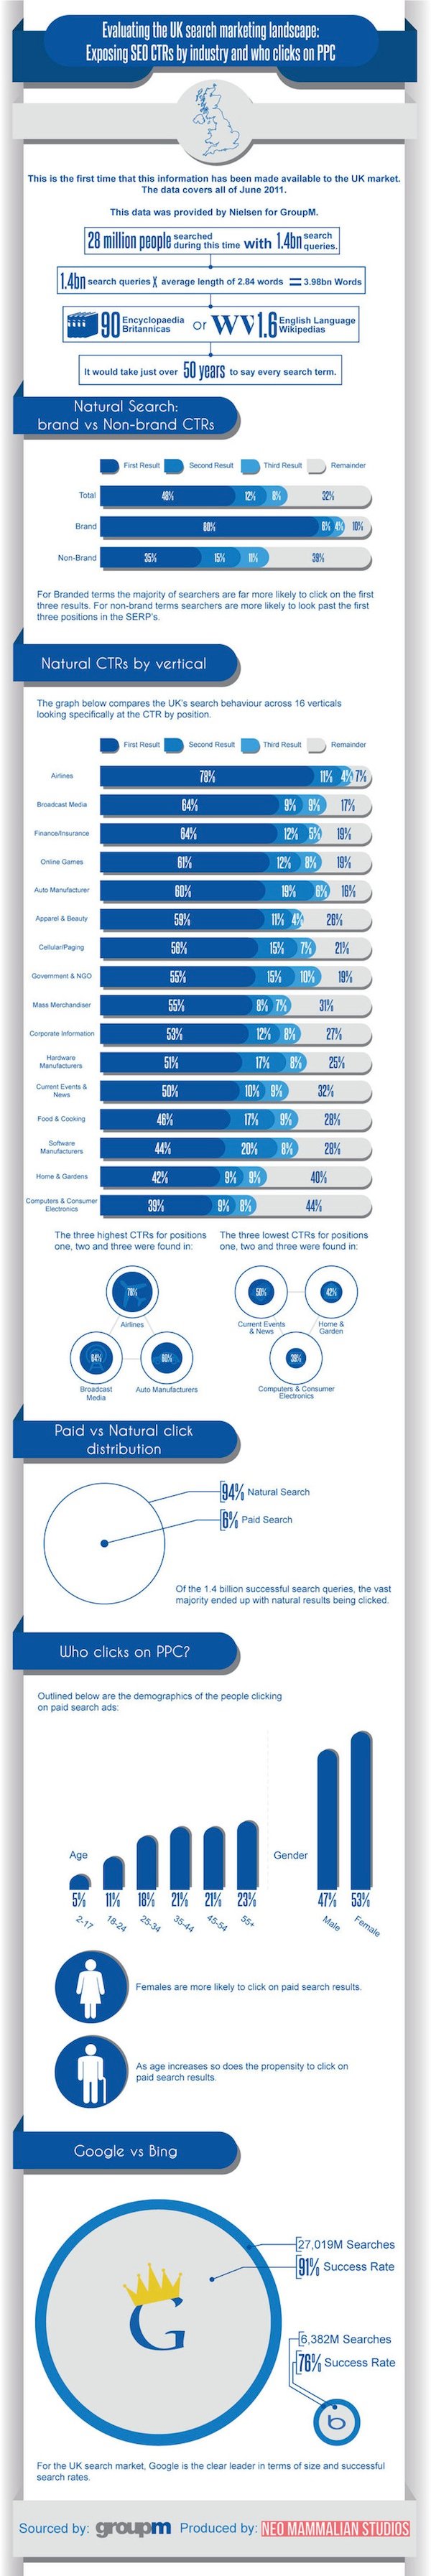
#10) Let's Just Use One Color
Here's the 10th worst infographic ever. Not sure what the page designers (opens in a new tab) were doing with this one. It's long, boring, almost monochromatic, and doesn't have any good visuals. You might as well have written a report with blue font. Thanks for the info though GroupM.
#9) The Answer is No?
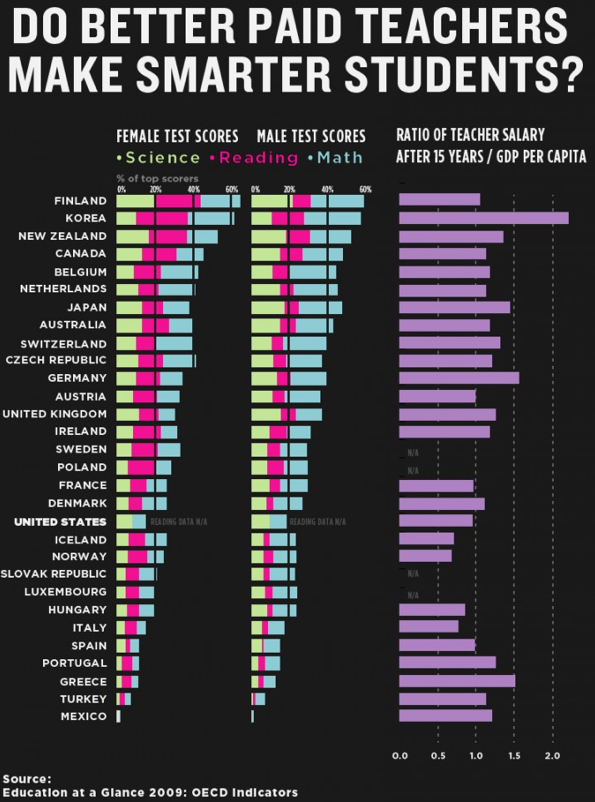
Too much info and not enough fluctuations to make a decision. I'm not quite sure what the answer is to this one.
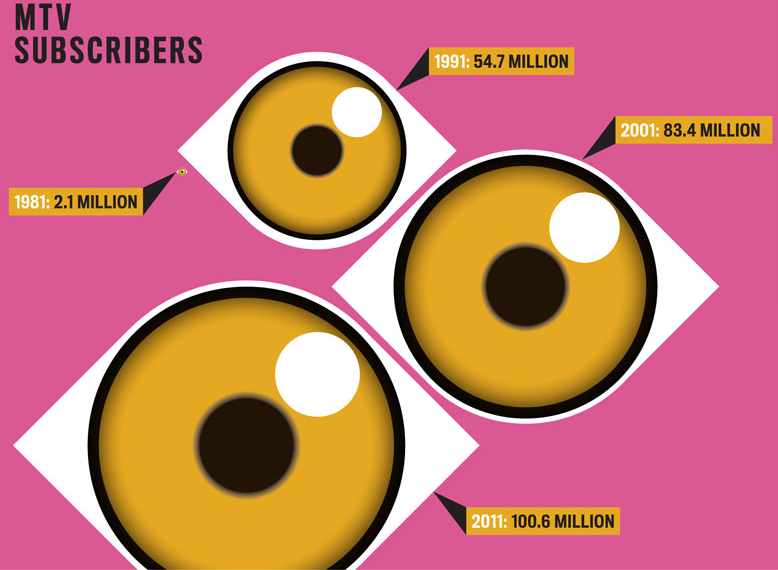
#8) This Makes No Sense
Here's the 8th worst infographic ever. MTV decided to create an infographic where no infographic was needed. It's difficult to understand the size difference between the eyes. Maybe they're true with the proportions, but I'm confused.
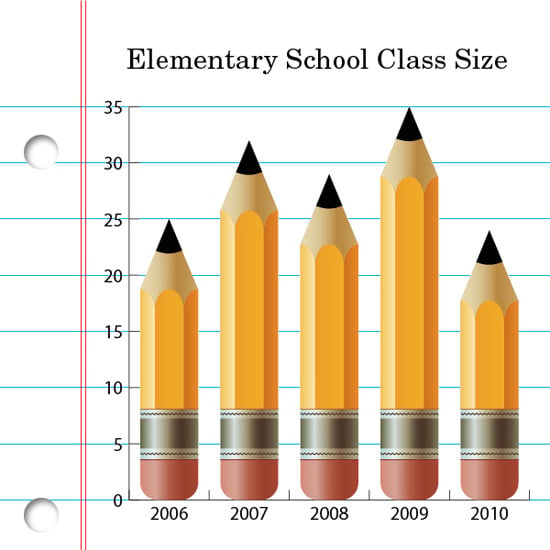
#7) Nothing But Numbers
Since this is not really an infographic but more of a bar chart, I'll give it the benefit of doubt and only give it the 7th spot as the worst infographic ever (it was titled an infographic). When you're creating any kind of charts, always remember to identify what you're measuring. Is it students, is it square feet?
#6) DIY Lawn Fertilizer

I'm sure the creators of this infographic are happy that they put their stamp of approval down at the bottom. Mixing 3 different fonts and some beautiful photos, and you're sure to have a winner. Or not.
#5) Clean Up Your Infographic
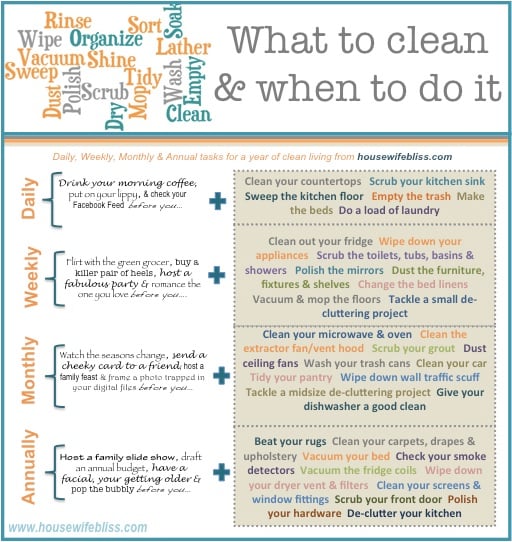
From HousewifeBliss.com, I give you the 5th worst infographic ever. How did I find this one? Please don't ask. All I know is that some organization is truly needed.
#4) Took About A Minute To Make

Here's a true beaut from the Minute Maid Park. What's the purpose of it? We'll never know. But it lands a sweet #4 spot on the worst infographic ever.
#3) Win An iPad
The idea behind this is great. Just horribly chosen colors. And why is the iPad darkened?!
#2) Chart Of ChurchAccommodation
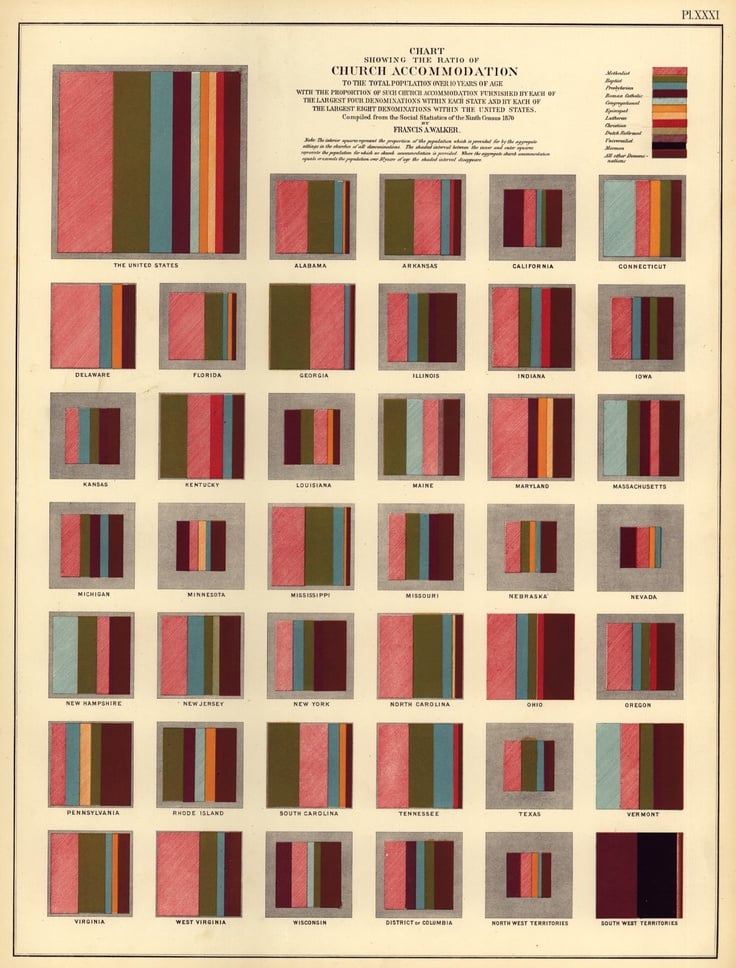
Pass.
#1) Extremely Sexual Sun Stroking
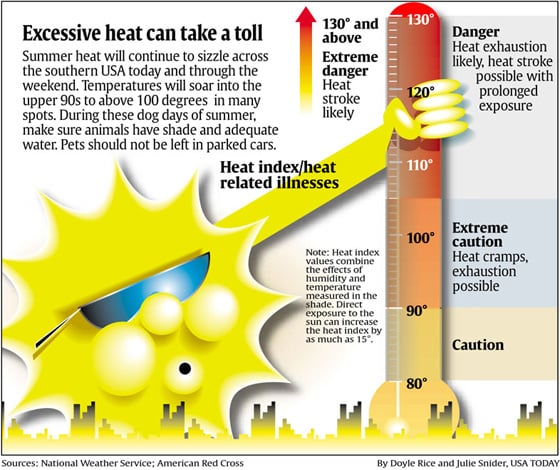
This is the #1 of the worst infographics ever. I'm guessing the hand was never really necessary? Funny nonetheless that it was an infographic created for USA Today to warn people of "heat stroke".