


A Google Analytics audit is one of the best ways to ensure that you can trust your data. You don’t want to use it, if you can’t trust it.
If you’re anything like me (a nerd), you could spend all your time buried in data. In an ideal world, it would be endless exploration, analysis, learning, and visualization.

But in our more pragmatic universe, there are deadlines, deliverables, and actions you need to take on the data.
For data to be actionable, it needs to be accurate. For it to be trustworthy, you need to audit your analytics setup to make sure things are being tracked correctly.
While you may think your data is perfectly precise, the sad fact is that most Google analytics audit experts I’ve talked to estimate 90%+ of analytics setups are broken in some fundamental way.
There are gradations of analytics audits:
- Data integrity -- is data being tracked properly or at all to our analytics tool?
- Data quality -- can we approach data collection with more granularity to improve insights gathering?
- Data maturity -- from a strategic approach, are we tracking things that are crucial to our business?
For the purposes of this article, we’ll focus on the first: data integrity. Note: Most of this I learned from a combination of doing work with our CRO agency and a CXL Institute course on intermediate Google Analytics.
Get brand new analytics strategies straight to your inbox every week. 23,739 people already are!
The Importance of a Google Analytics Health Check
In a nutshell, a Google Analytics health check is a walk through of the implementation and instrumentation of a site’s analytics setup. We want to answer the following questions:
- Does it collect what we need?
- Can we trust this data?
- Where are the holes?
- Is there anything that can be fixed?
- Is anything broken?
- What reports should be avoided?
One of the more important parts of analytics is making sure you’re tracking things correctly. If you’re not doing that part right, you can’t trust the data in your reports.
Similarly, if you’re working with clients, such as in an agency or consultant setting, you want to quickly diagnosis the implementation errors in your client’s system. This allows you to fix things and get proper data sooner, which allows you to work on the client’s marketing sooner and achieve a proper ROI.
The risk of not doing an audit are twofold:
- If people in the company don’t trust the data, they won’t be ready to use the data. Trust in data leads to better adoption.
- If you have data quality that is subpar, and you’re trying to make decisions based on that data, then you’re going to be making bad decisions. Inaccurate data leads to inaccurate decisions.
Better adoption and business decision making sounds like a good enough benefit for me to invest some time in the process.
Because of my experience with a CRO agency and in my own work as a growth marketer for CXL, I’ve tried to strip down the process of auditing Google Analytics to the most essential pieces.
If you have more time and the issues are more complex, feel free to spend more time on the audit. And note that it’s not usually a one and done experience -- questions about data integrity, data quality, and data maturity are continual events in any data-driven organization.
But if you want the bare bones essentials of a Google Analytics health check, this article should put you in a good place.
Debugging Your GA Setup
There are a number of things you can do outside of the Google Analytics reporting system.
If you download an extension such as Google Analytics Debugger (for Chrome), you can gather tons of useful information. You can answer questions like:
- Are we double tracking pageviews?
- Are users being tracked across relevant domains?
- Are events being properly tracked?
- Might there be bounce rate issues with certain events?
...and many more questions, depending on your business and use case.
So, this is how it works. After installing and activating the plugin, you simply right click on your website and click “Inspect.” This brings up developer tools.
You might be used to using developer tools to inspect a pages html structure for SEO purposes--but for GA audit, we’ll click over from “Elements” to “Console.”
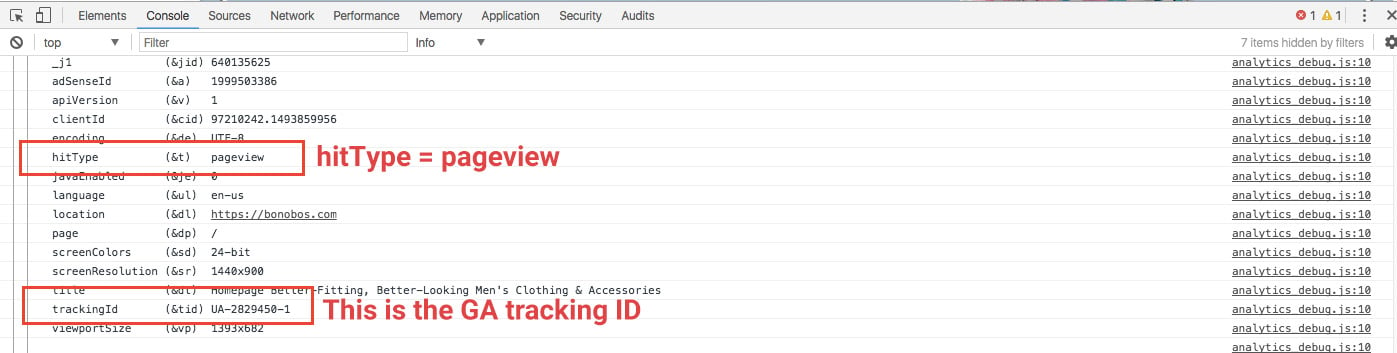
Once you’re there, you should be able to see what information is being sent to Google Analytics. Presumably, the first thing sent to GA will be a pageview, which will look something like this:
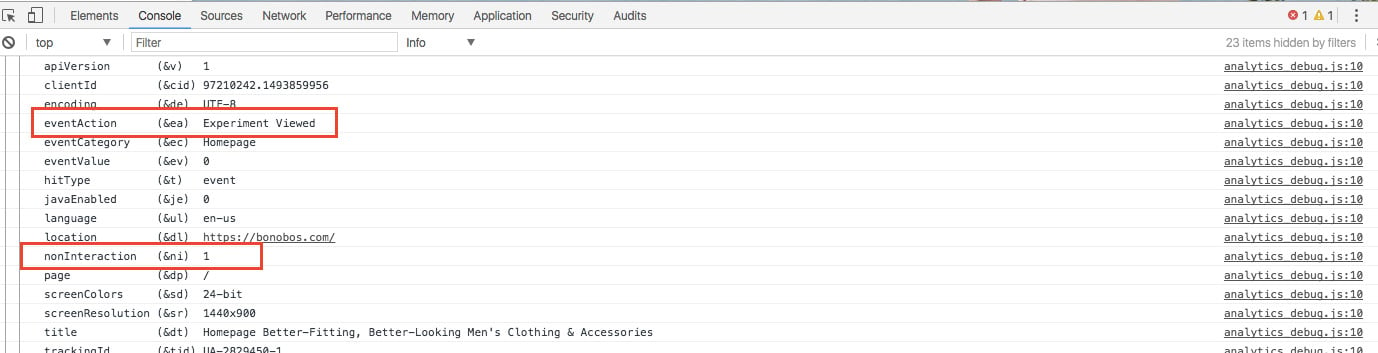
From here, I recommend just navigating through the site like a user might and watching for what beacons get sent to Google Analytics. If they hit a checkout.site.com subdomain, does it continue tracking? What events are being tracked? Are they non-interactive events? For instance, here’s an event that fires when I got shown a popup experiment on Bobonos.com:
When using the GA debugger, the first thing you should look at is if GA is correctly installed across your site.
Sometimes, such as with Spotify, you can click over to a subdomain (like developers.spotify.com) and suddenly the data isn’t sent to the same property. How do you know? The Google Analytics tracking ID on the subdomain is different than the tracking ID on the main page.
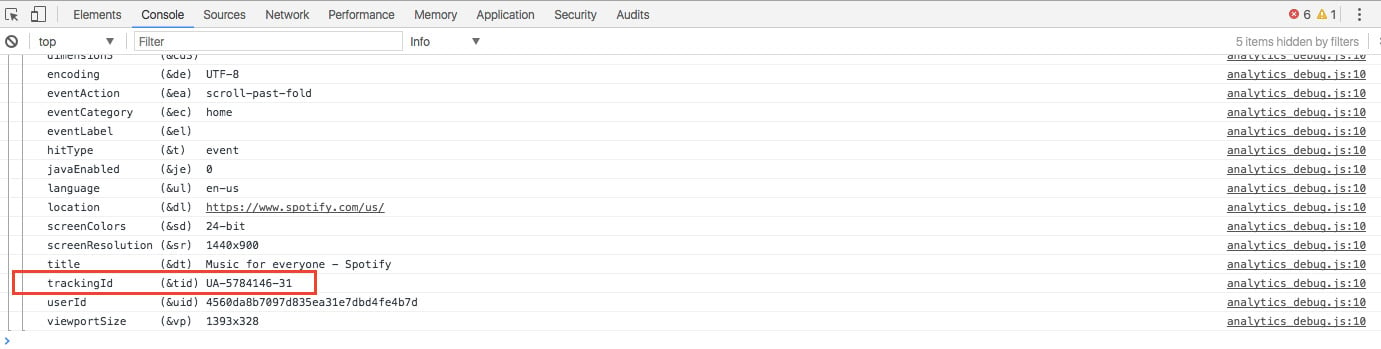
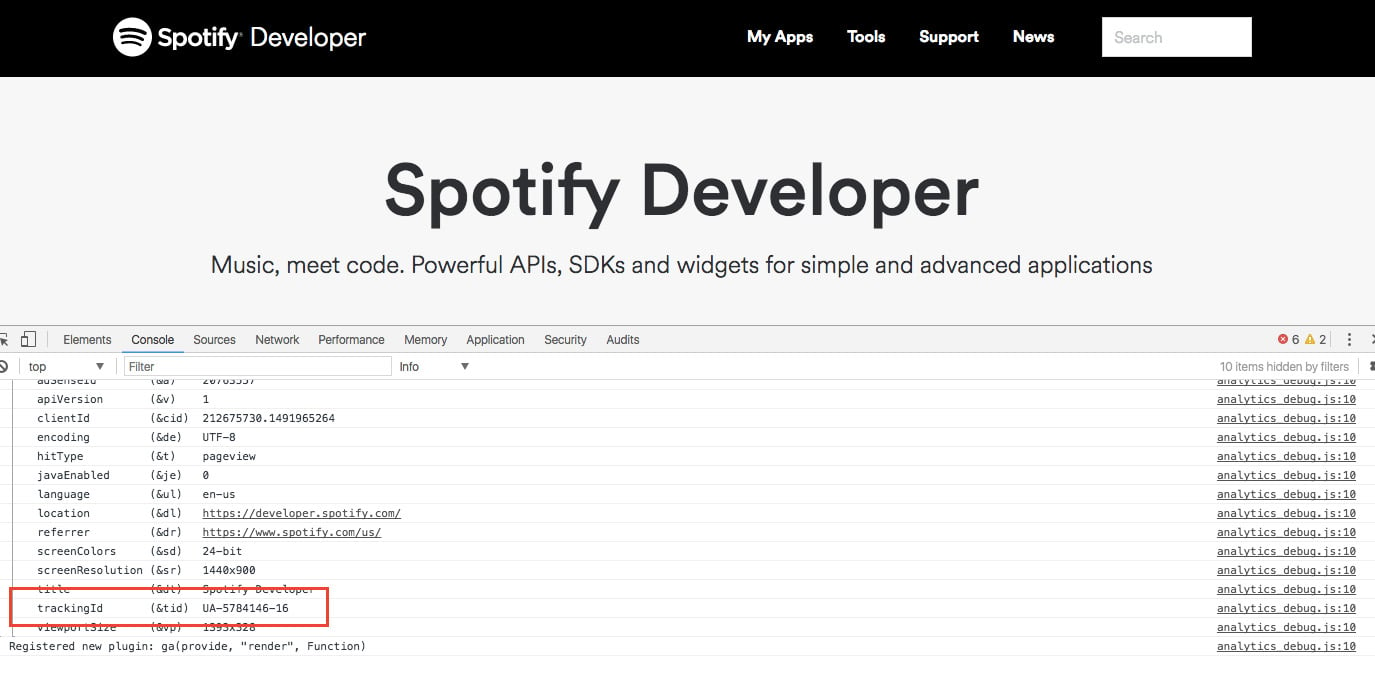
The data is being sent to different properties, meaning the user journey is fractured and not represented.
What this means is that Spotify has no real way to connect visitor behavior on the developer’s site and the main site. You could switch between the two and essentially all of your data becomes fragmented, so as to be pretty useless.
(It’s way easier to know this stuff if you have access to analytics, but let’s pretend you’re doing this for a potential client).
If you want a quicker way to check if GA is implemented across your site, you can also use a tool like GA Checker. That being said, it doesn’t take too long to use the debugger and I consider that approach more trustworthy.
There’s a ton more you can do with GA debugger -- it just depends on your site. Specifically, there are tons of ways you can analyze enhanced ecommerce and what is being tracked there (e.g. product position, promotions, etc.).
This tool is actually great for getting clients, because you can spend 20 minutes running through a lead’s site and come up with immediate suggestions and fixes.
But let’s move into the actual interface and start doing our Google Analytics audit from the inside.
The Core Essentials of a Quick and Dirty Google Analytics Audit
Now, under the assumption you have access to the entirety of a Google Analytics account, you can do a full Google Analytics audit. Here you can examine how you’re collecting your data and in what ways you can improve.

The key things we’re looking for here:
- Profile setup (configuration and admin)
- Filtering of traffic (agency, office, data cleaning)
- Goal and funnel configuration (key reports)
- Anything that prevents insights!
Google Analytics Account Setup
Let’s start with your account setup.
This is an important part for anyone, because the way a GA account is configured needs to be aligned with your organizational setup.
The way GA is structured is Accounts > Web Properties (where the data is collected) > Views
Accounts are concerned with high level, user management considerations (like who gets access to what data), and properties where the data is first sent to be processed. Views are the end point where you get your reports.
Generally, it’s a best practice to set up a few different views:
- A main view. This is where you and your team primarily work out of and make decisions based on data.
- A sandbox view. This is where you test out new filters and configurations before deploying them in your main view. You want a testing ground to make sure stuff works first.
- A raw data view. This is your view that you simply leave alone in order to get a full view of your data collection. It also gives you a backup of your data in case you mess something up.

So, a first point of order in your Google Analytics audit is to check what kind of views you’re using. If you don’t have at least the above views created, definitely set those up.
Something else to consider is your actual business structure and how that is reflected in your analytics views. For example, if you have different international markets in, say, the U.S., Ireland, and Canada, perhaps you’d like to set up views for each of those teams.
Outside of your Views setup, there are a number of factors to consider within the Admin dashboard:
- Is the default URL set up correctly?
- Are your referral exclusion settings configured correctly (e.g. you use PayPal to process payments)?
- Is enhanced link attribution turned on?
- Have you enabled demographics and interest reports?
- Is Google Webmaster Tools linked properly?
- Is the time zone correct?
- Is site search and category search enabled?
- Is enhanced ecommerce configured?
- AdWords integration
- Is it configured correctly?
- Is PPC data showing in Google Analytics?
- Are the resulting clicks and sessions being recorded properly?
It’s likely you won’t have an issue with most of these things, but it doesn’t hurt to double check. These are the low hanging fruit items in a Google Analytics audit.
Google Analytics Reports
Next, we’re going to look into reports to find issues with your Google Analytics setup. The idea here is to apply a filter of common sense. Does something look wrong? It probably is.
We’ll go through each core report - audience, acquisition, behavior, conversions - one-by-one to identify the biggest issues.
Audience Reports
First off, just go to Audience > Overview.
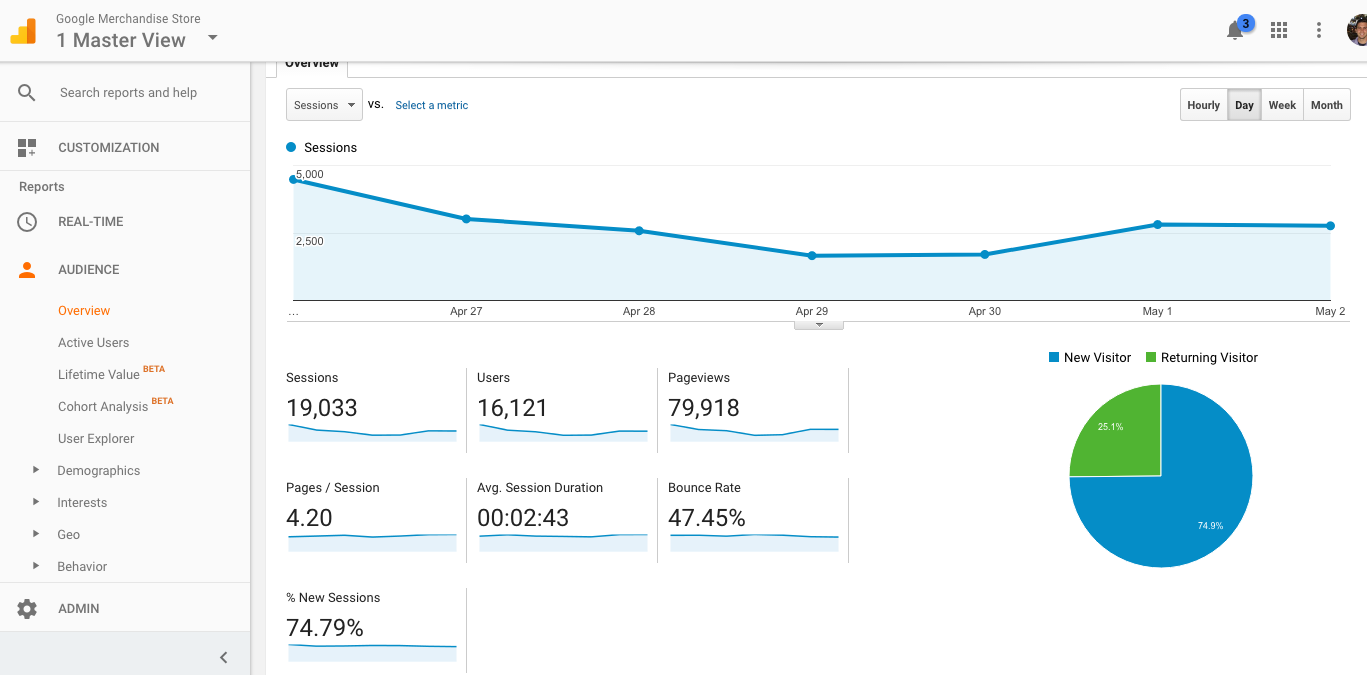
Does everything make sense here? If your bounce rate is 100%, perhaps you are double tracking page views or have some issues with interactive event tracking. What’s your % New Sessions -- does it make sense?
Then, wander over to demographics and ask a simple question: is demographics turned on? This is something you can switch on easily from the Admin section.
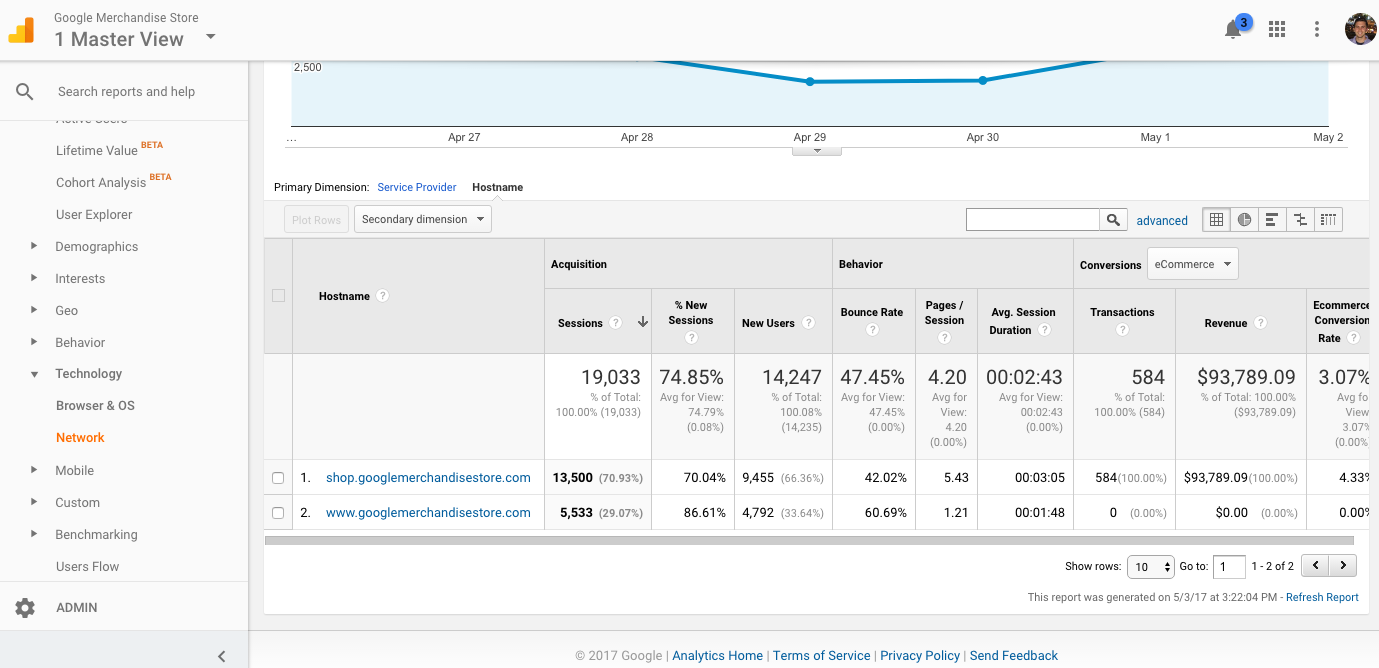
After that, check out Audience > Technology > Network > Hostnames (which many people consider to quite a boring report) and ask, “are all of my subdomains present here?”
If there are others present, you may want to add a filter to restrict domains that aren’t yours from showing up here.
Finally, even though this goes beyond simple analytics implementation issues, I like to take a quick look at mobile and browser performance issues because, if they’re present, these are some of the lowest hanging fruit for conversion optimization opportunities.
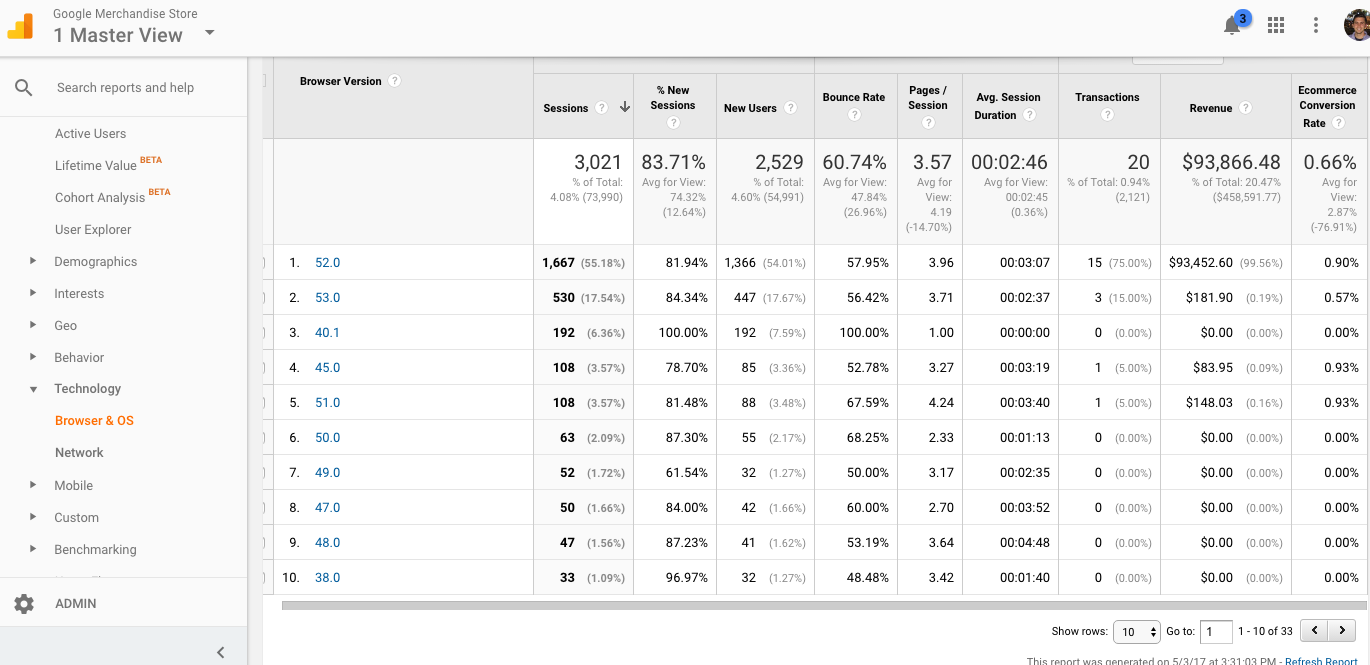
For a browser report, just go to Audience > Technology > Browser & OS and view at a high level. Is there anything really fishy about any of the conversion rates? If so, you can drill down on a specific browser by clicking on it, look at each version and see if there’s a big issue with any in particular. If that browser version has enough traffic, it’s certainly worth fixing whatever bug is making conversions lower there.
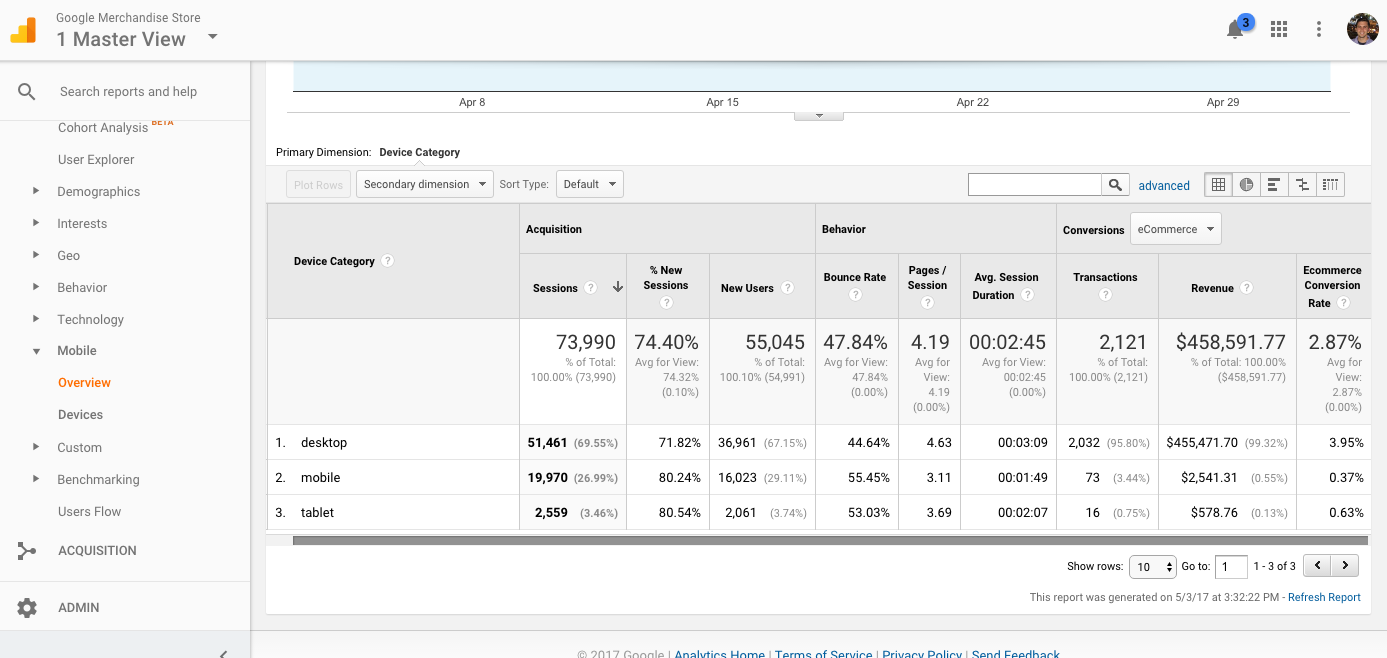
Same deal with mobile. Just go to Audience > Mobile > Overview and look at how mobile and tablet are performing in relation to desktop. Is there a huge discrepancy? It’s often the case that mobile converts worse than desktop, but if anything is way out of whack, it’s worth looking into.
Acquisition Reports
With Acquisition reports, we’ll again start by exploring our data with a common sense lens. Here, we’re mostly looking for issues with campaigns and how we’re tracking and attributing them.
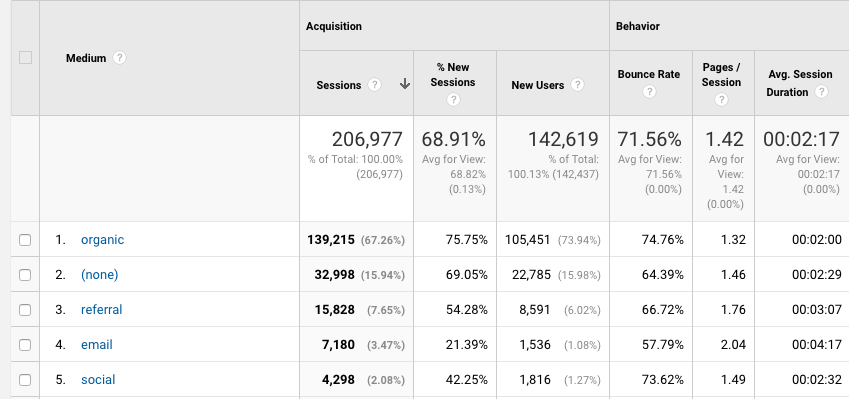
Go to Acquisition > All Traffic > Source / Medium and then select “Medium,�” and just see if things make sense. Does your social, email, or CPC traffic look super low? Direct (none) looking way too high? It’s a common problem, and one usually caused by lack of proper campaign tagging.
This is a small first step in what will eventually be a much more time consuming process of auditing all of your external campaigns. But viewing at a high level lets you see what channels you’re possibly tagging incorrectly. Later on, I do recommend doing a full audit and tracking all of your manual tagging with a spreadsheet. This one is awesome.
Another issue to look for in Acquisition reports is self-referrals. I touched on this with the GA debugger above, but having issues with sub-domain and cross-domain tracking is super common. To find this out within your dashboard, go to Acquisition > All Traffic > Source/Medium. Then, use the search filter and type in your company name:
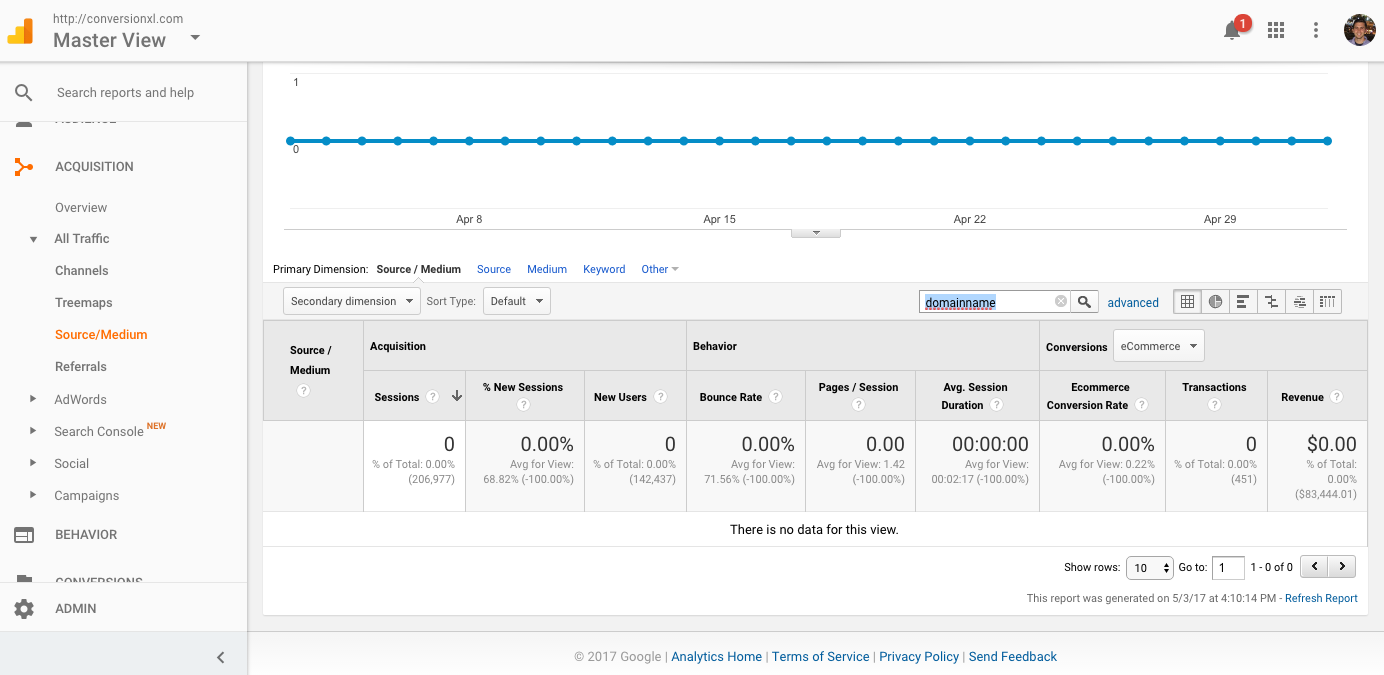
If anything shows up, then you might have sub-domain or cross-domain issues. Here’s how you set up cross-domain tracking in Google Tag Manager.
Behavior Reports
One quick thing you can do with behavior reports is to see if you’re violating Google Analytics’ terms of service. Specifically, we can see if you’re accidentally collecting personally identifiable information.
Go to Behavior > Site Content > All Pages and in the search filter type in “/@”. This will look for @ symbols in URLs, which may be collected if you’re accidentally collecting personal email addresses. If nothing comes up, you’re good to go. If you find alex@conversionxl.com in a URL, you should fix that.
Next, let’s look at issues of query parameter fragmentation. GA will split pages into multiple rows that have different parameters. Usually, you want to analyze in aggregate based on page content, so this isn’t typically a good thing:
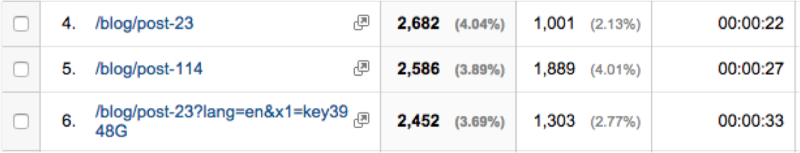
You can find this out quickly by using the search filter in Behavior > Site Content > All Pages report and searching for whichever piece of content you’d like to find. Here’s one from the Google Demo Account for “store.html”
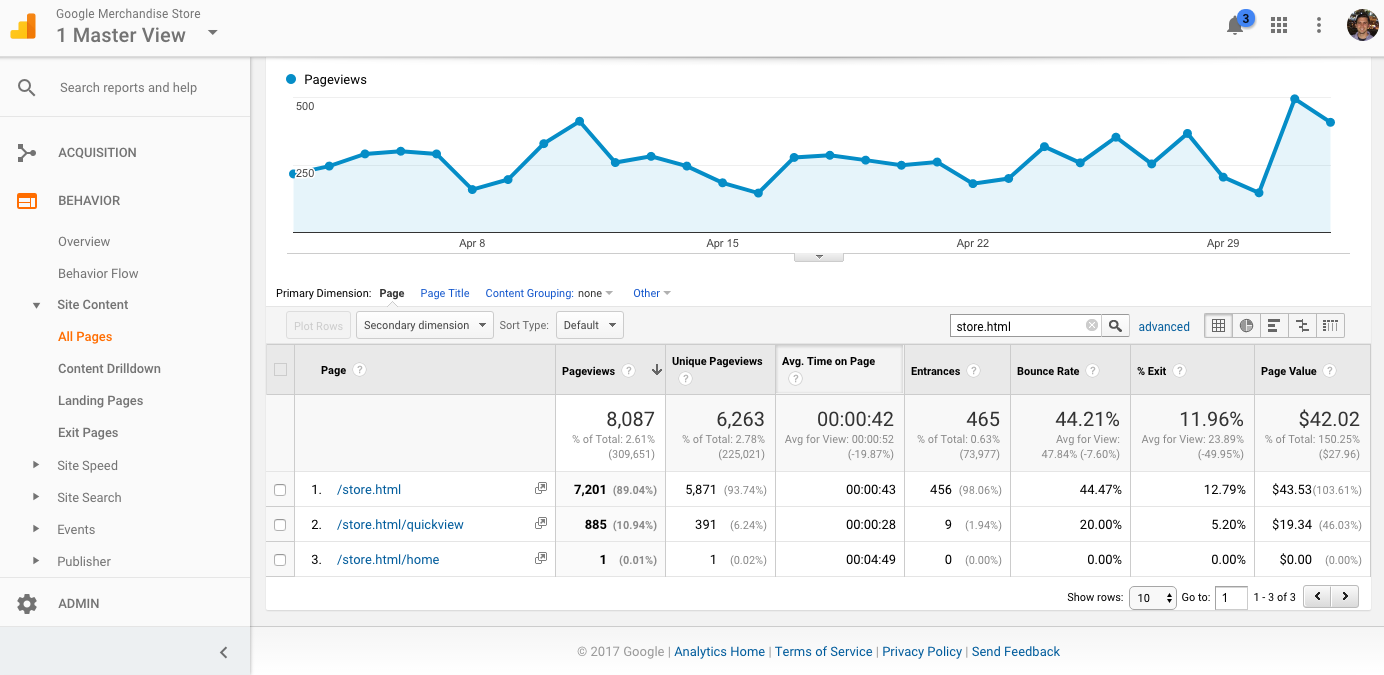
It’s most likely your analytics setup has this issue--so this is a good one to focus on, especially if you publish a lot of content. Fortunately, there are many ways to fix this. Read this great post from Lunametrics for some possible solutions.
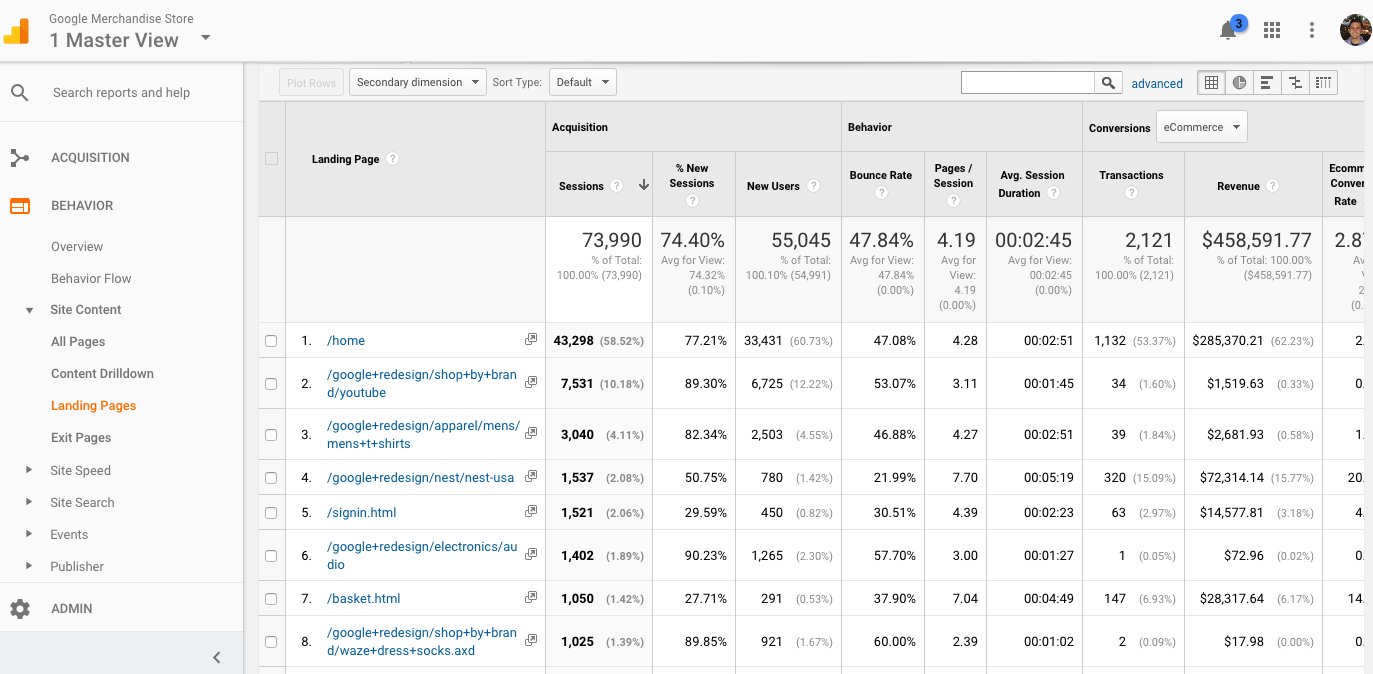
Something else to look for in Behavior reports is any fishy data with your landing pages. Go to Behavior > Site Content > Landing Pages and look for any weird numbers, particularly with bounce rate -- any very high or very low numbers should send a red flag and you should investigate.
Any crazy values like that for bounce rate are almost always due to inaccurate event setup. For more information on events, bounce rates, and implementation errors in that arena, check out this awesome post.
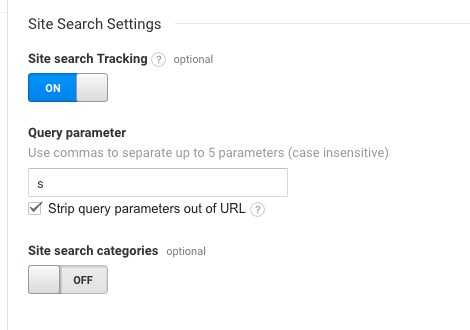
Finally, Behavior reports will also show you site search. If it’s not currently set up, you can do so in the Admin section under View Settings > Site Search. Simply select the query parameter that indicates a search was conducted on your site and things should be set up.
If you do have site search on, check that you have a lowercase filter on. Site search is case sensitive, so “Pumpkin candle” and “pumpkin candle” would otherwise be counted separately if not for lowercase filters. More on how to fix that in this article.
Bonus: events. I don’t want to dive too deeply into events in this article because it’s more strategic. Setting up events is very specific to each business. Essentially, you want to ask, “what information can we track to allow better insights and decision making?”
While you’re in the Behavior reports, I definitely recommend auditing your event tracking through Behavior > Top Events, and having a discussion with your team to see if you could be better utilizing event tracking in the future. Here’s an ultimate guide to event tracking to check out.
Conversion Reports
In this section, you’re essentially going to be checking if goals are set up correctly. You can’t use Google Analytics without goals. It’s valueless without setting them up. In addition, it’s easy to set up goals--so if you haven’t done that, start there with this guide.
In the conversion reports, you always want to check if the numbers in your ecommerce software and your Google Analytics match.
It’s actually a super common issue and it’s frustrating. While the numbers may not ever line up completely, they should be 95-99% accurate.
So, what happens when the data showing in your shopping cart tool is different than the data showing in Google Analytics?
It usually comes down to four issues:
- Your Google Analytics ecommerce tracking is not properly installed. Read this thorough guide to setting up eCommerce Tracking to ensure you’ve done it correctly.
- Time zone. If your shopping cart tool and Google Analytics are configured to report in different time zones, you may have mismatched data.
- Time of day. If you set up your ecommerce tracking in the middle of the day, transactions that occurred before will not appear in Google Analytics, but will appear in your shopping cart tool.
- Cancelled transactions. Transactions with no value ($0) and cancelled transactions do not appear in Google Analytics.
Wrap Up on Engaging in a Google Analytics Audit
While this article outlined a quick and dirty checklist of sorts to conducting a Google Analytics audit, know that it’s not a formula and it’s not the same for everyone. This is a rough outline, and I picked reports that are the most easily generalizable.
However, a proper audit is exploratory in nature. It’s about asking, “hmm, I wonder if ___?”. Then, if you see something weird, it’s about asking, “why is this the way it is?”
Be curious and the rest falls into place.

A final note: there are a variety of issues on a scale of importance in a health check. By that I mean, if you don’t have goals and events set up in Google Analytics, worry about that before you worry about filtering your own company’s IP from the data.
There are business critical issues like double tracking page views or missing business critical goals, and there are data quality issues that just make life a little easier. Focus on the big stuff at first, and tweak the little things later.