


Knowing the latest Facebook ad stats can make you an expert and give a nice kickstart to your PPC results. PPC stats and Facebook ad resources can provide a baseline for testing, and be real eye-openers as you try to better grasp the best practices.
But there’s also a darker side to Facebook statistics.
They can also be gravely misleading.
If you follow the wrong Facebook ad stats, your campaign results can be surprising in a bad way. Keep in mind that several factors may impact results and usage such as industry type or product offering. Your campaigns could produce different results because of this.
When reading about stats from different news resources and reports, apply these three thought exercises:
- Take every number and fact with a grain of salt and think whether the same rules apply to your ad campaigns.
- Expand on the stats, draw conclusions, and try to find new ideas for using the numbers to your advantage.
- When reading about case studies, consider replicating the experiments in your own Facebook ad campaigns to confirm the results.
Up next, you’ll find 103 Facebook advertising stats the cover everything from Facebook audiences to the perfect ad design.
Hopefully, you’ll find some inspiration and knowhow for your next Facebook campaign.
Get brand new Facebook ad strategies straight to your inbox every week. 23,739 people already are!
Facebook Ad Stats: Overview
You probably know that Facebook is the most popular social media platform. But exactly how popular is it? And how engaged is the average Facebook user?
Is it the right platform to be investing your ad budgets?
The next time a skeptical team member is asking for some stats to prove Facebook’s relevancy as a marketing channel, you’ll know what to say.
1) 79% of American Internet users are onFacebook
According to Pew Research Centre, as of 2016, nearly eight-in-ten online Americans (79%) use Facebook. If you also count the people who do not use the Internet, 68% of all U.S. adults are Facebook users.
Compared to other social media networks, it’s more than double the people using Twitter (24%), Pinterest (31%), Instagram (32%), or LinkedIn (29%).

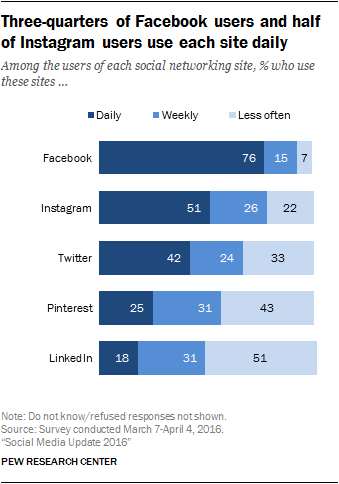
2) Over 70% of Facebook users visit the platform daily
According to a 2016 Pew Research Centre report, 76% of Facebook users report that they visit the site daily, 55% visit it several times a day, and 22% visit about once per day.
This daily active user rate is a lot higher than for other social media sites: Instagram (51%), Twitter (42%), LinkedIn (18%), and Pinterest (25%).
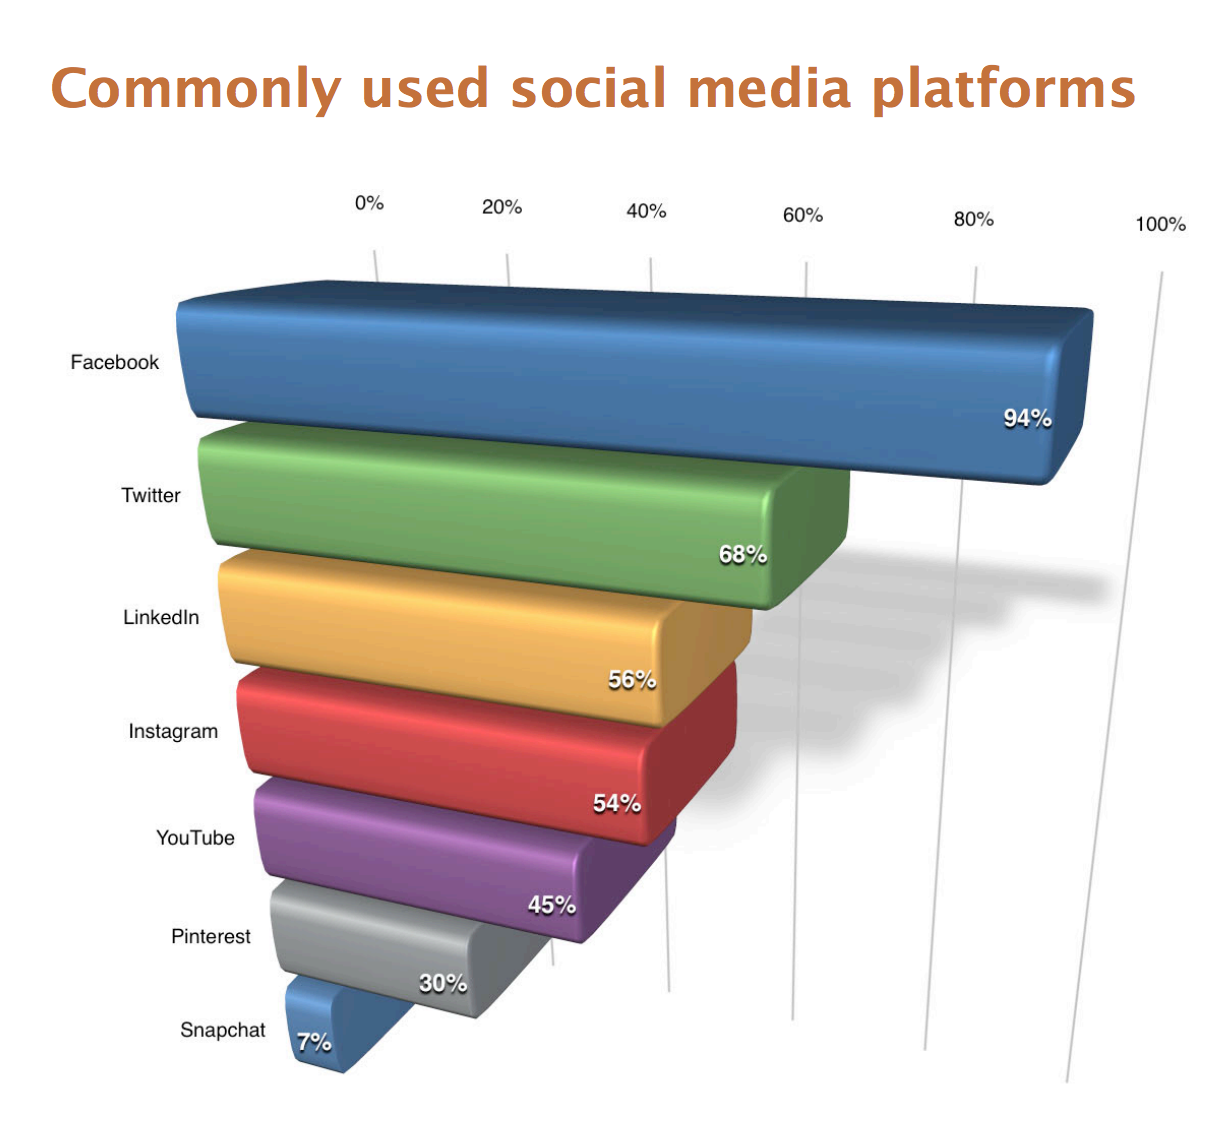
3) Facebook is the most used social media platform
Facebook has remained the most widely used social media platform among all age groups with 64% of them using Facebook, Edison Research reports.
However, among 12-24-year-olds, it has been overtaken by Snapchat (72%) with Instagram close behind (66%).
If you want to make sure that you reach the largest number of people, combine Facebook ads with Instagram ads and Twitter ads. Also, don’t forget about Snapchat and LinkedIn.
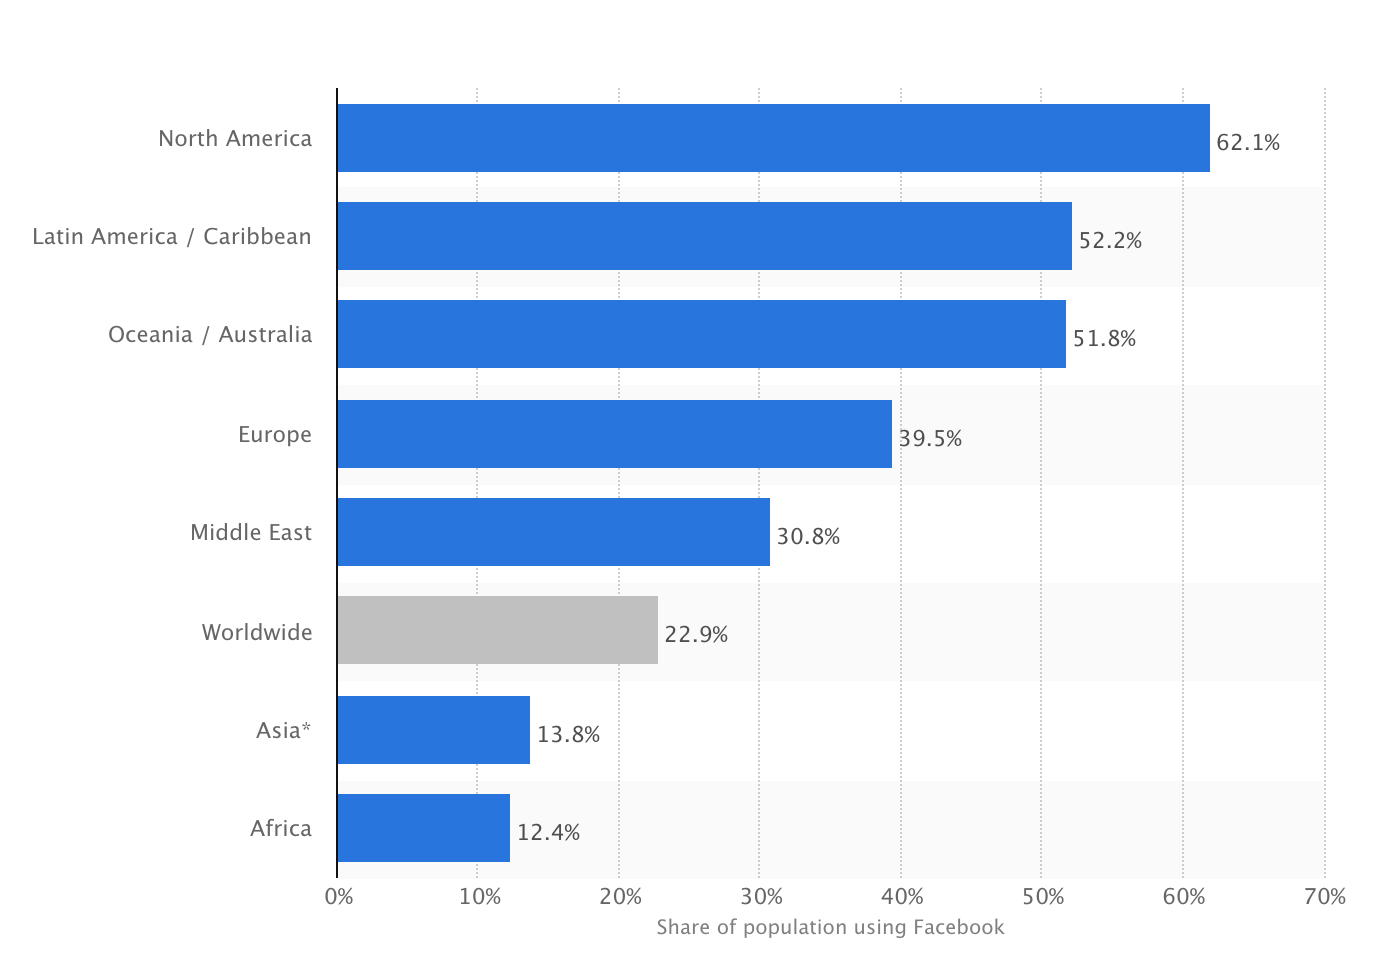
4) 22.9% of the world’s total population uses Facebook
Statista’s data shows that worldwide, 38.6% of the online population and 22.9% of the total population uses Facebook.
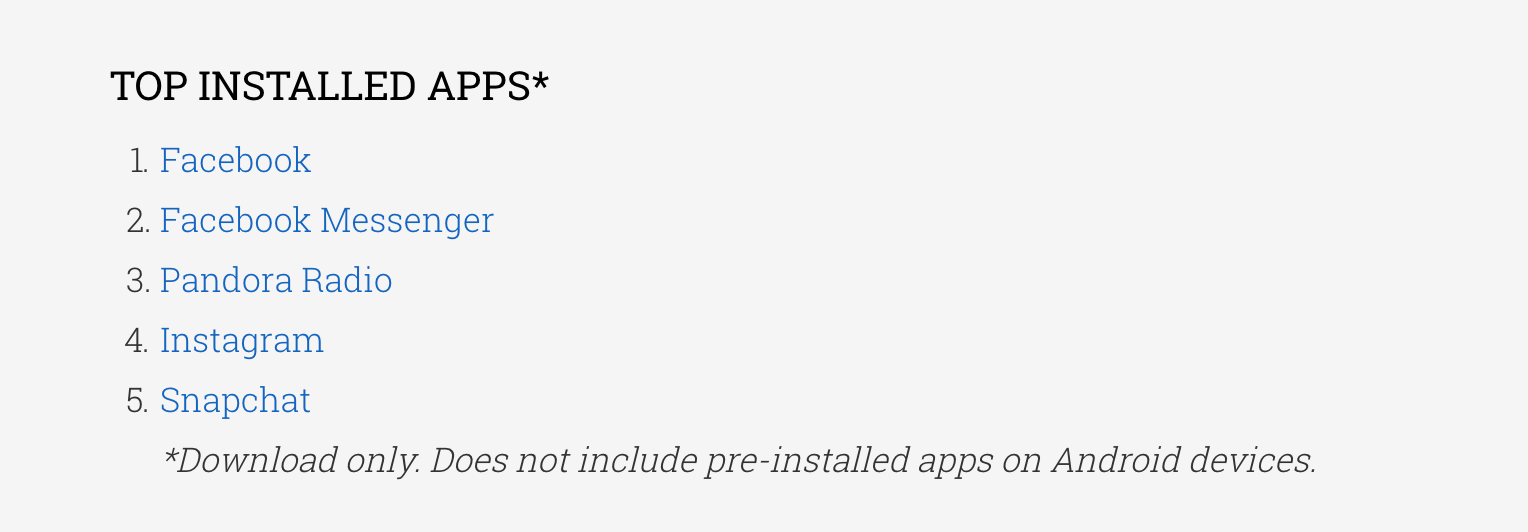
5) Facebook is Google Play’s most downloaded app
When Google Play celebrated its fifth birthday in March 2017, it listed its most downloaded apps of all time.

Two out of the TOP 5 spots in the most downloaded apps list belong to Facebook.
6) Facebook is the sixth-most-valuable public company in the world
According to a list of the world’s TOP 2,000 companies by Forbes compiled in May 2017, Facebook is the world’s sixth most valuable publicly traded company.
Facebook’s current market value is around $407 billion.
7) Users spend 50 minutes/day on Facebook’s platforms
During Facebook’s Q1 2016 earnings call, Mark Zuckerberg told:
“People around the world spend on average more than 50 minutes a day using Facebook, Instagram and Messenger…and that doesn’t count WhatsApp.”
Back in July 2014, the numbers showed that American users spent 40 minutes per day on Facebook’s platform, as reported by TechCrunch.
If you want to reach your target audience across multiple social platforms, test a combination of Facebook and Instagram ads.
8) 56% of adult Internet users use more than one social media platform
Pew Research Centre’s data shows that nearly 90% of people using Instagram, Twitter, LinkedIn or Pinterest also have a Facebook account they’re actively using.
Among the people who only use one social media platform, 88% indicate that Facebook is the one site that they use.
This could mean that the audiences you’re trying to engage on Instagram, Twitter, LinkedIn or Pinterest could also be effectively reached with Facebook ads.

9) Facebook accounts for 62% of all social logins
According to AdvertisingAge, Facebook accounted for 62% of the social logins in 2015 tracked by Gigya, a company that provides tools for brands and publishers to let people log into their sites and apps using their Facebook, Google, Twitter, Yahoo or other accounts.
Facebook was followed by Google (24%), Twitter (7%), and Yahoo (4%).
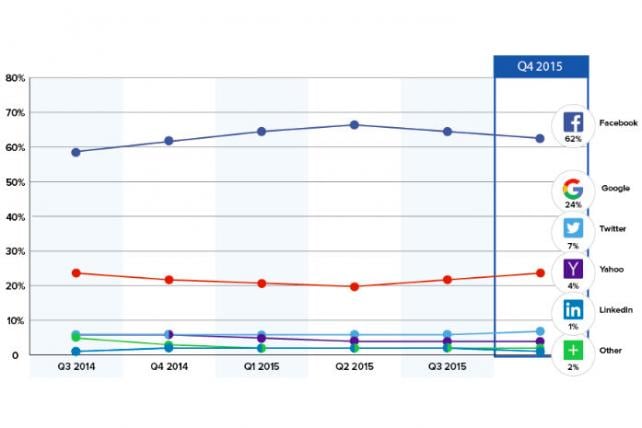
Facebook and Google are offered as login options nearly 100% of the time. Twitter is offered 72% of the time and Yahoo by 35% of sites.
10) Facebook accounts for 80% of mobile social logins
The same report by AdvertisingAge told that the lead of Facebook is even more visible when it comes to mobile logins. Gigya processed 58 million social logins across 700 brands and publishers' sites in Q4 2015.
80% of mobile social logins were attributed to Facebook.
11) 74% of Facebook users also use it for professional purposes
A large number of people use what we think of as traditionally “personal” social networks (Facebook, Twitter, etc.) for professional purposes, State of Inbound Report 2017 showed.
74% of respondents use Facebook professionally, almost catching up with 78% of those who use LinkedIn, a network designed for professional usage.
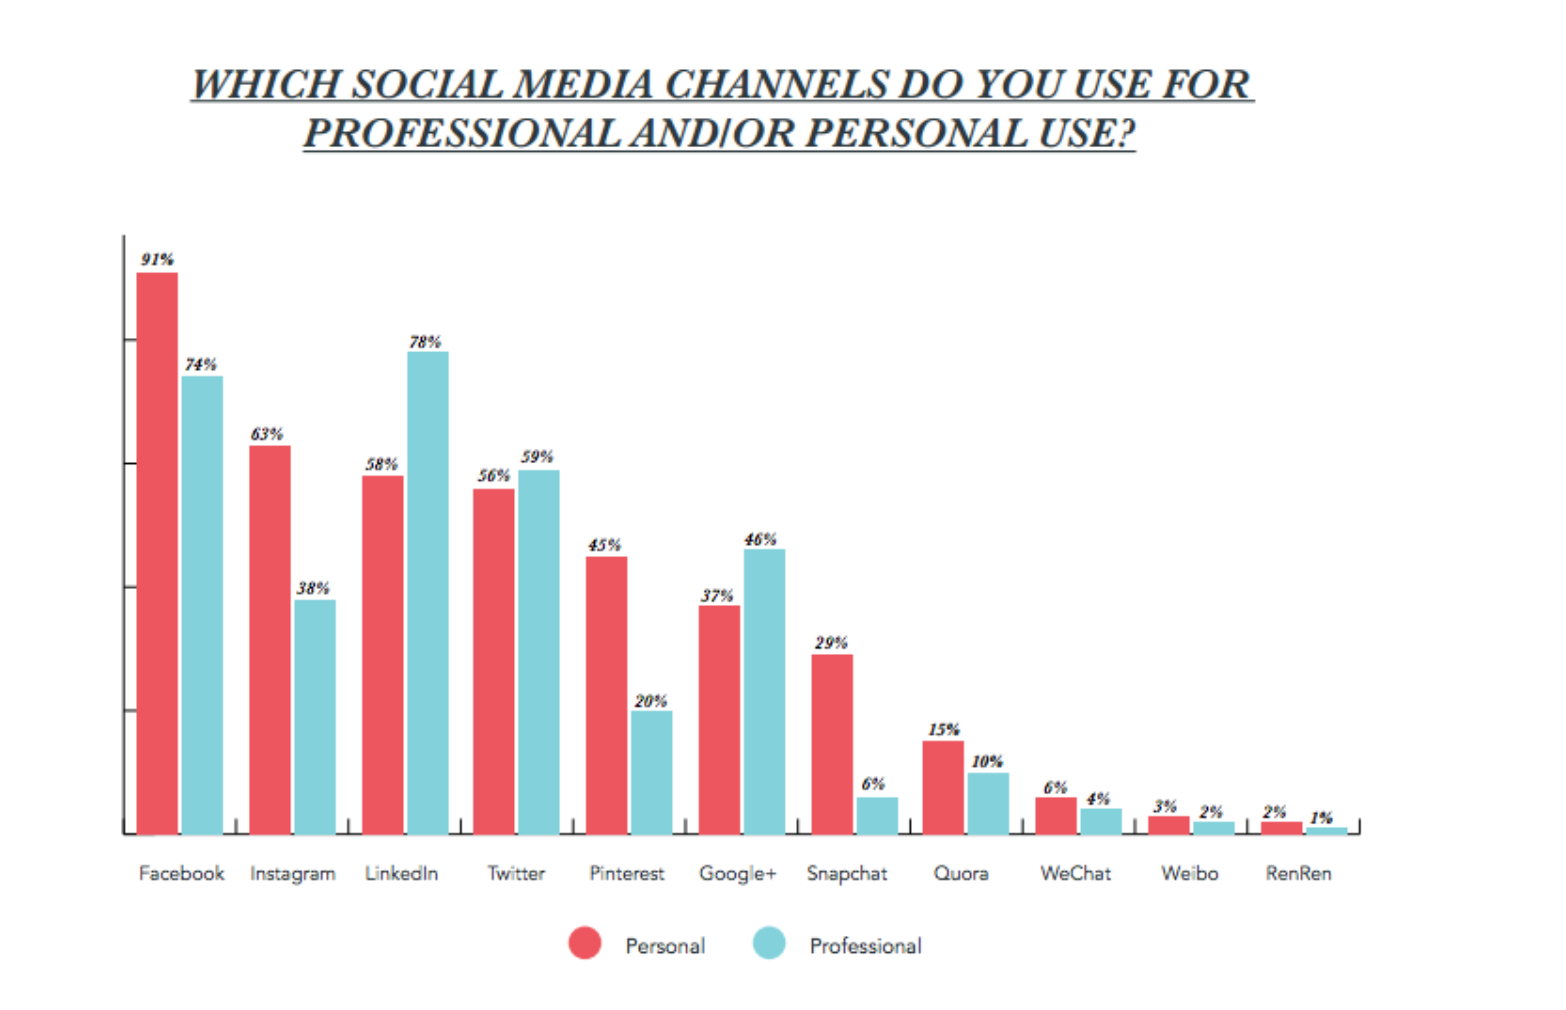
This means that brands can also benefit from B2B Facebook ad campaigns that reach a business audience.
12) There are 2.5 trillion posts on Facebook
As reported by TechCrunch, Facebook’s been around since 2004, and its users have made over 2.5 trillion posts to date.
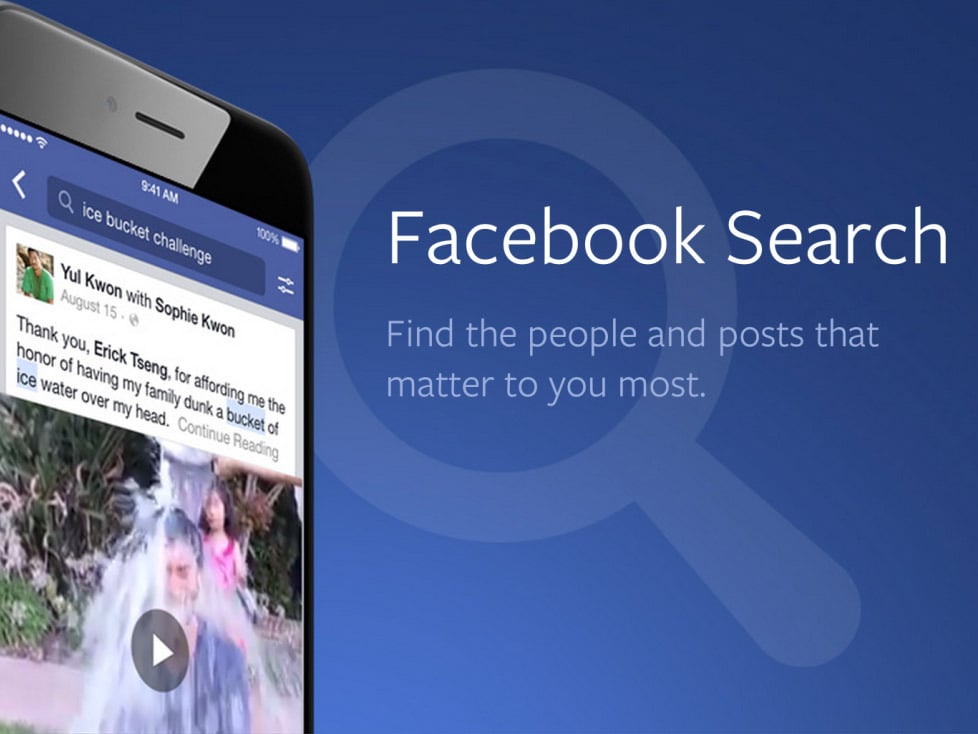
That’s a lot of noise that you need to break through. Luckily, there’s the Facebook search that helps people to find you.
Moreover, you can use Facebook’s Promoted Posts to make your messages more visible.
13) Facebook users make 2 billion searches every month
If you’ve been wondering whether anyone is using the Facebook’s Search box, some people definitely are.
According to TechCrunch, in 2016 the average of 2 billion monthly searches was made on Facebook’s platform.
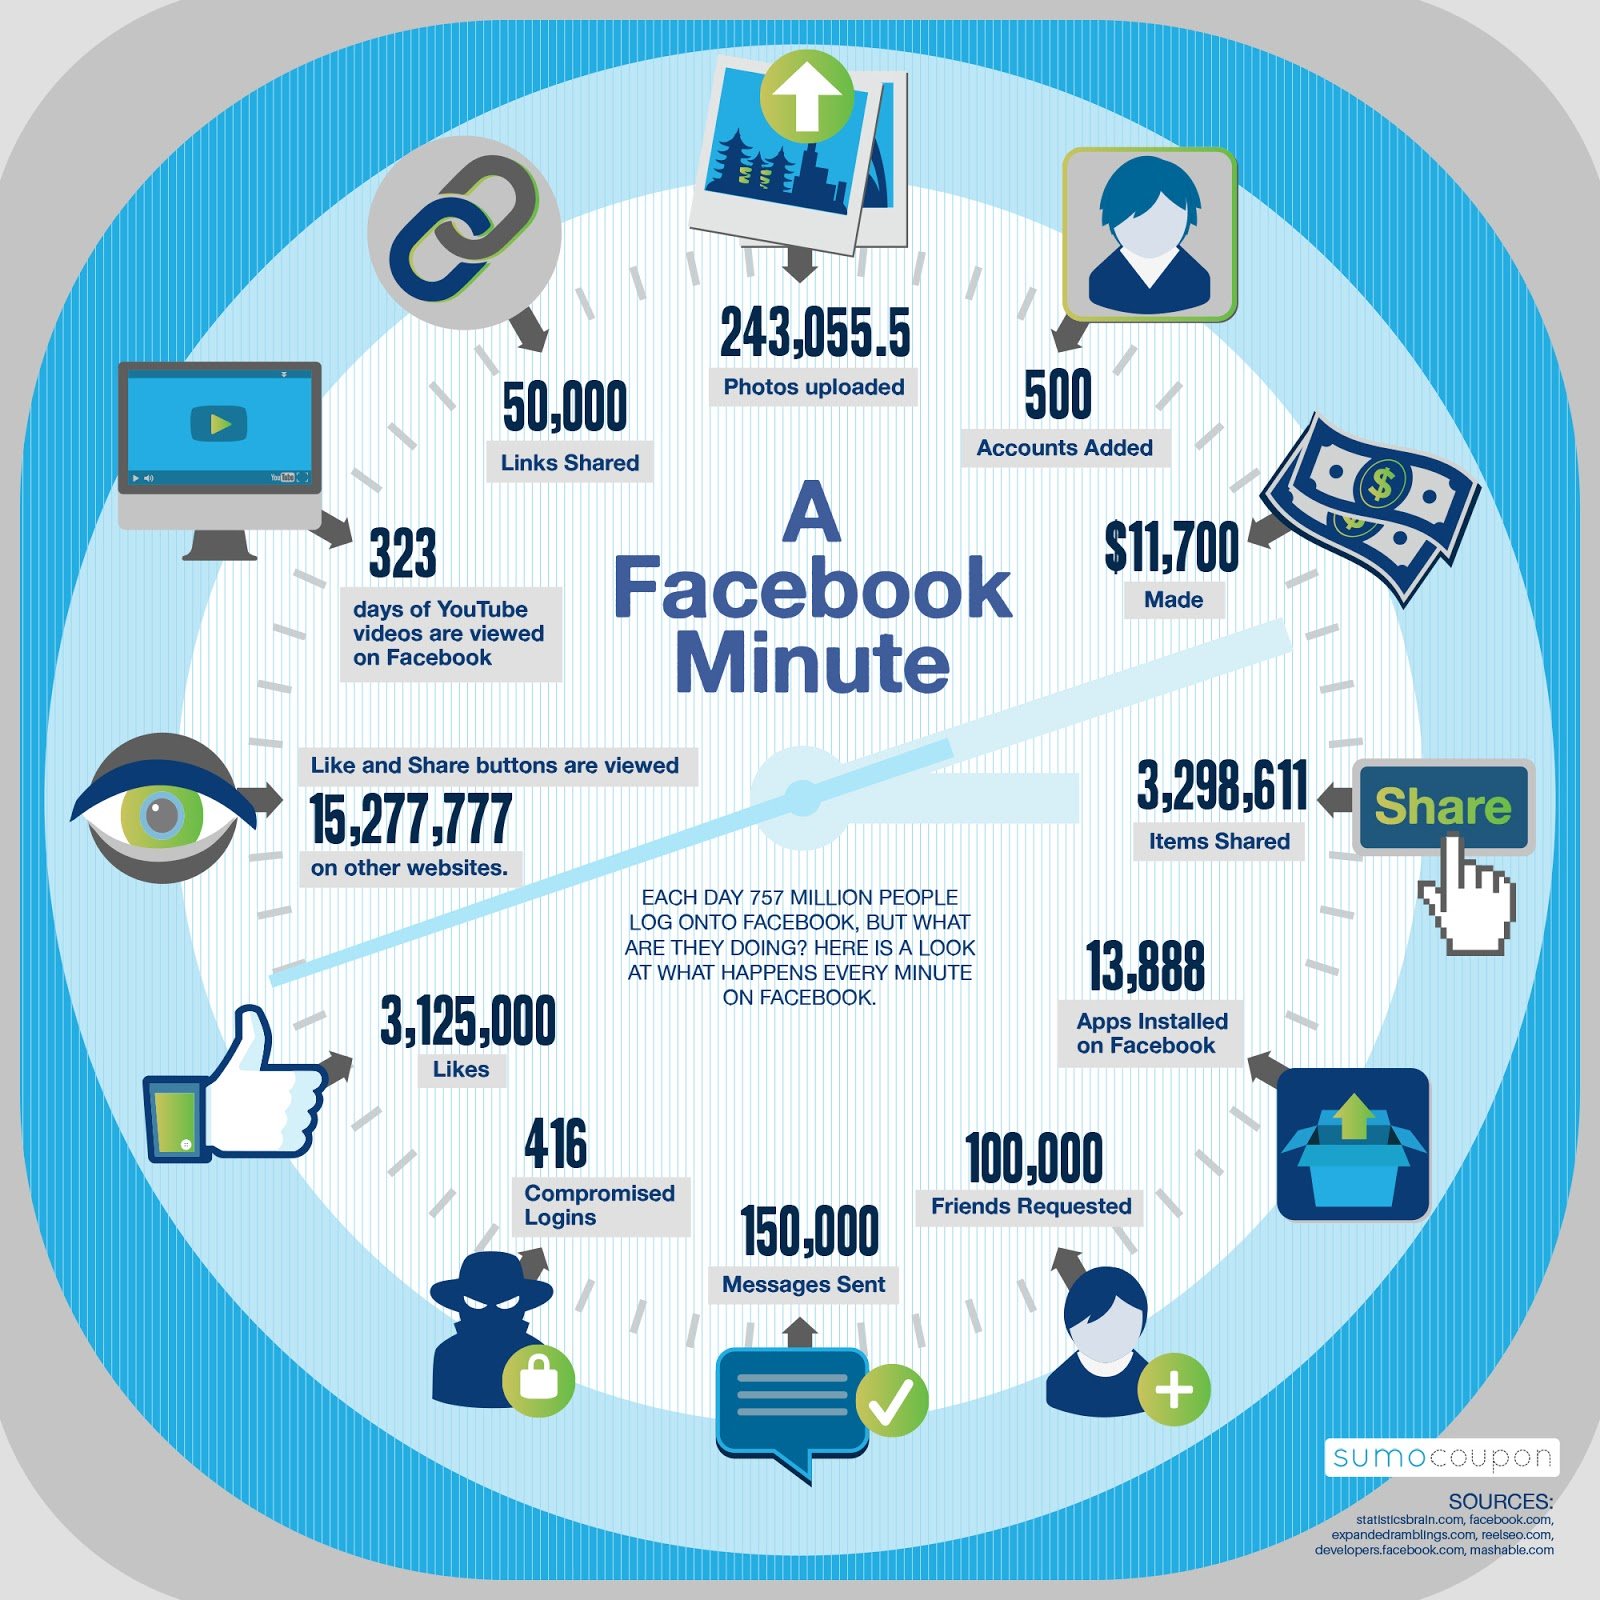
14) Facebook users generate 4 million likesevery minute
You’d be surprised to learn how much content and reactions are created on Facebook every minute. According to an infographic by SumoCoupon (now Dealhack), Facebook users generate 4 million likes every minute.
In addition, every 60 seconds…
– 500 new users join Facebook
– 100,000 friend requests are sent
– 243,000 photos are uploaded on Facebook
– 50,000 links are shared on Facebook
– 3,3 million items are shared on Facebook
15) 42% of millennials can’t last 5 hours without checking Facebook feed
According to an eMarketer 2017 study, 42% of millennial respondents said they hadn’t lasted five hours without checking their feeds.
16) Every month, 2.5 billion comments are made on Facebook Pages
Facebook’s data showed that in 2015, people left around 2.5 million comments on Facebook pages every month.
17) Facebook Reactions have been used over 300 billion times
According to AdWeek, the Facebook Reactions have been around for almost one and a half years. During its first year of availability, the Reactions were used by over 300 billion times.
Facebook Ad Stats: Advertising
Alright, now that you know that Facebook is by far the most widely used social media channel, you may be thinking whether you should get started with advertising on the platform.
Up next, you’ll find some Facebook ad stats directly related to advertising on Facebook.
Find out whether Facebook ads and your industry are a good match.
Spoiler alert! Facebook ads can work for both B2C and B2B companies.
18) Facebook is the preferred social network for 62% of marketers
The Social Media Marketing Industry Report 2017 revealed that when asked to select their most important platform, 62% of marketers chose Facebook, followed by LinkedIn at 16%. Compared to 2016 results, the preference for Facebook increased from 55% to 62% in 2017.

19) Facebook is the top ad channel for both B2C and B2B marketers
The same report uncovered that Facebook is the number one choice for 72% of B2C marketers when it comes to social advertising channels.
However, for the first time in the history of the study, Facebook also passed LinkedIn as the most important platform for B2B marketers, with 43% of marketers naming it as their top choice.

If you’ve neglected Facebook as a marketing channel this far, you may want to give it a chance.
20) 94% of social marketers use Facebook’s platform
Facebook, Twitter, LinkedIn, and Instagram were the top four platforms used by social media marketers, with Facebook leading the pack – 94% of marketers use Facebook, according to Social Media Marketing Industry Report 2017.
21) 56M+ businesses have a FacebookBusiness Page
As reported by Forbes, by the end of the year 2015, over 50 million businesses were using Facebook Business Pages. Now, the number has grown to 65M+ companies.
In a Facebook post, Facebook's COO Sheryl Sandberg said that:
“Small and medium-sized businesses are one of the company's "most compelling" opportunities, particularly because in the U.S., about a third of small businesses have no Web presence at all.”
Facebook pages make it easier to reach and engage with large audiences, especially on mobile.
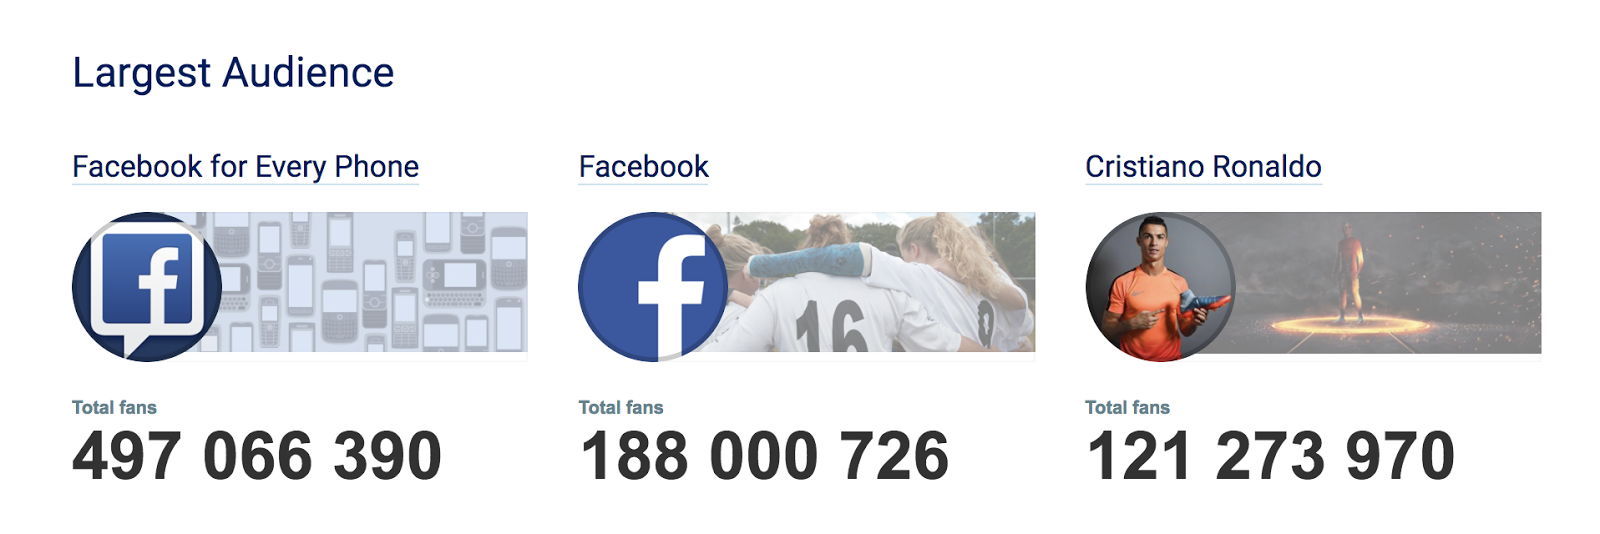
22) The most popular Facebook page has497,066,390 likes
According to Socialbakers, the most followed Facebook page is Facebook for Every Phone, with 497,066,390 likes
The second and third places are held by Facebook (188,000,726 likes) and Christiano Ronaldo (121,273,970 likes).
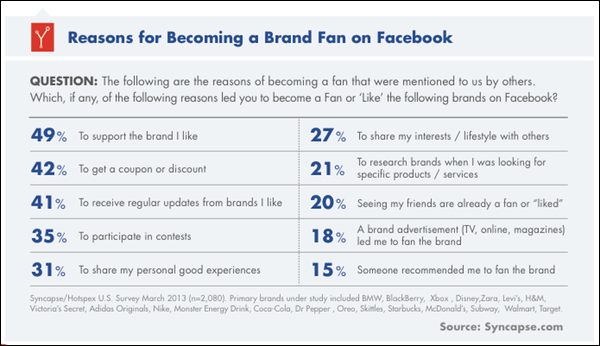
23) 49% of users like a Facebook page to support their favorite brands
According to a study by Syncapse, 42% of the 2,000 respondents cited “to get a coupon or discount” as one reason they fan a brand on Facebook. The top reason (mentioned in 49% of answers) was “to support the brand I like.”
If you want to get more likes to your Facebook page, you could try targeting the friends of your page fans. People are more likely to support brands and causes also liked by their friends.
24) 40% of Facebook users don’t like any branded pages
Kentico software’s research revealed that two out of five Facebook users do not like any branded pages.
When asked how many brands they Like on Facebook, 39% of survey respondents said 1-10, 7% said 11-20, and 6% said 21-30. 40% of the people questioned don’t like any branded Facebook pages.
25) Marketers post to branded Facebookpages 8 times per day
Social Media Examiner surveyed social media marketers and found out that on average, they post on a branded Facebook page 8 times per day.
39% of marketers have increased their posting frequency on Facebook over the last 12 months while 15% have decreased their posting frequency.
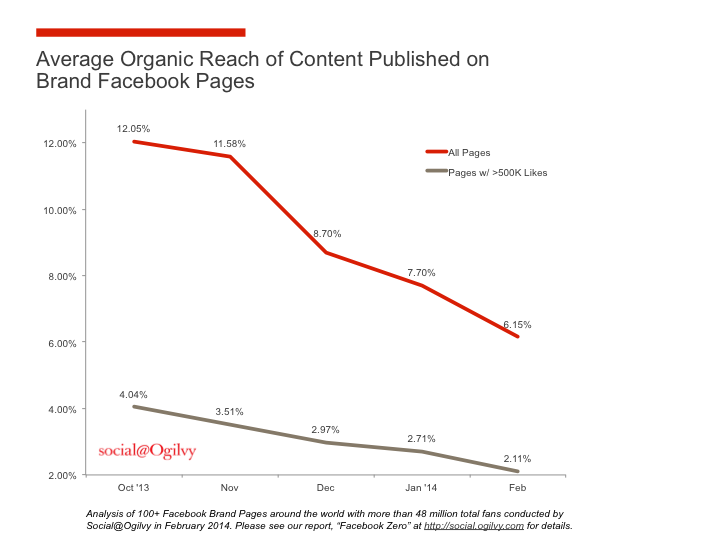
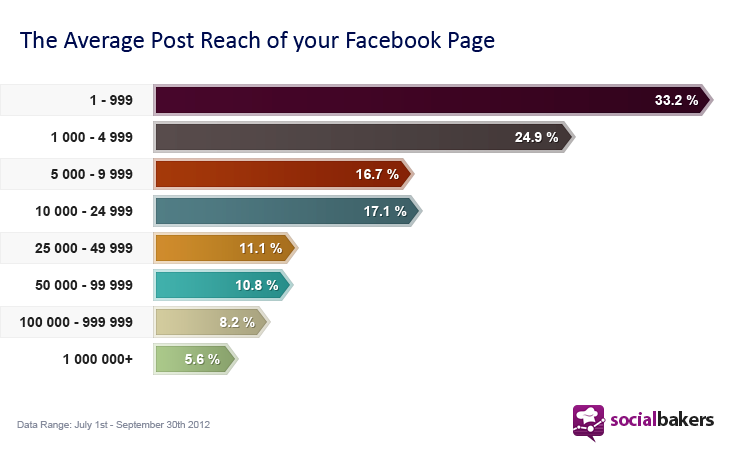
26) Branded Facebook page posts organically reach only 2% of your fans
As reported by AdWeek, in March 2015, the average Facebook page post reached around 2.6% of the page’s fans. This means that 97% of your Facebook page’s fans may not see your posts.
However, the situation is slightly better for smaller brands. For pages having under 1,000 likes, the avg. organic post reach was between 14%-23%.
27) In 2016, publishers saw a 52% decline in organic reach on Facebook
From January 2016 through mid-July 2016, publishers’ Facebook Pages experienced a 52% decline in organic reach, Marketing Land’s data shows.
This also translates into fewer clicks, comments, and shares.
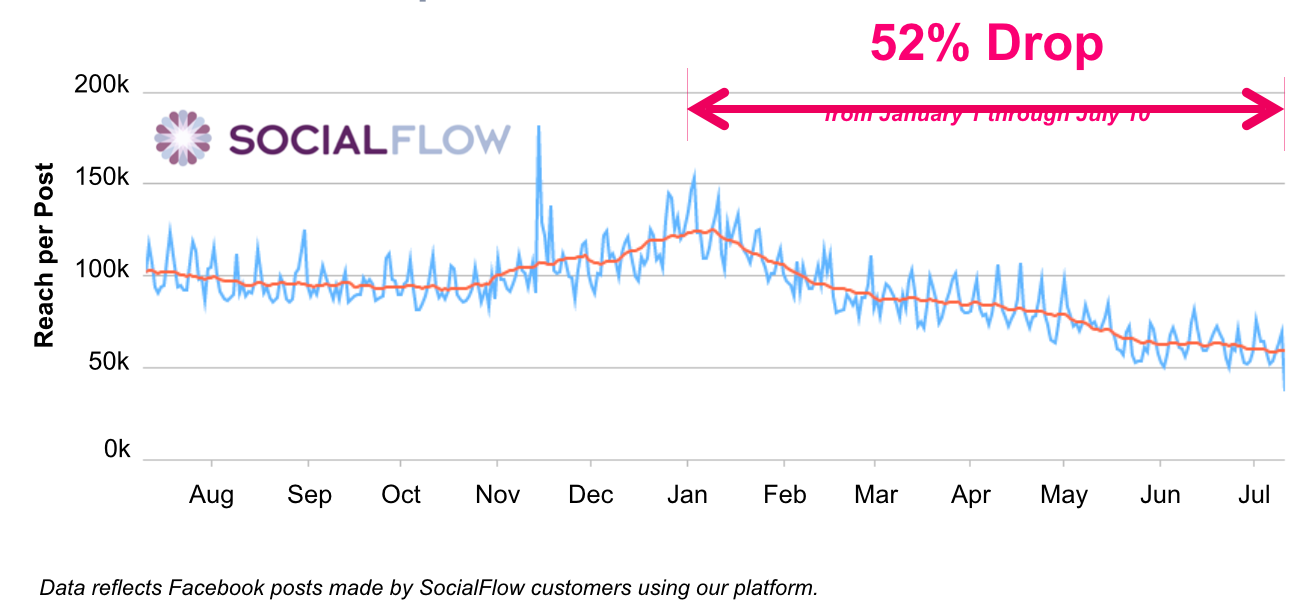
If you want your Facebook posts to reach a wider audience, you’ll have to use advanced Facebook ad strategies, such as Promoted Posts.
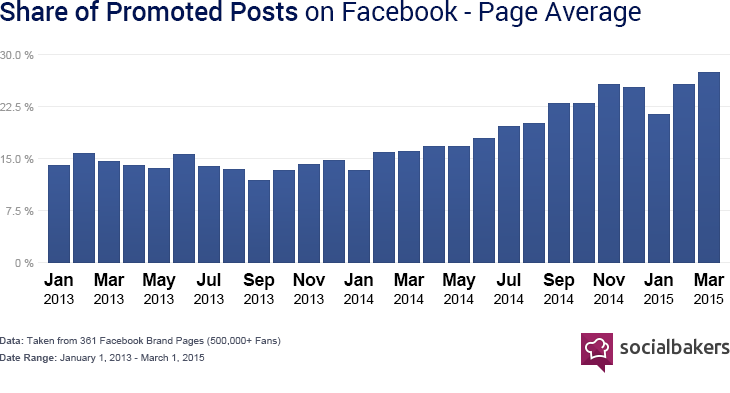
28) An increasing number of companies uses Promoted Posts
According to a 2015 study by Socialbakers, brands increased their post promotion on Facebook by 80% from 2013 through to 2015.
29) Over 5 million business use Facebook for advertising
As of March 2016, three million companies from all over the world used Facebook’s paid ads to reach their target audience, with more than 70% from outside of the US.
In April 2017, the number had grown to 5 million advertisers!
The majority of Facebook’s advertisers are small and medium sized businesses.
30) 93% of social marketers regularly use Facebook ads
According to a recent report by Social Media Examiner, a surprising 93% of social marketers regularly use Facebook ads and 64% plan on increasing their Facebook ads activities.
31) Facebook users watch 8 billion videos per day
According to TechCrunch, in November 2015, Facebook hit 8 billion video views daily. Even at just 3 seconds per view, Facebook is generating 760 years of watch time each day.
32) 500 million people watch Facebook videoevery day
As reported by Recode.net, more than 500 million Facebook users watch Facebook videos every day.
33) 100 million hours of video are watched on Facebook every day
In May 2016, Facebook reported that its users watch more than 100 million hours of video daily.
Videos as a medium are becoming increasingly popular. That’s why it may be a good idea to test Facebook video ads and A/B test them against static image ads.
34) Facebook's avg. video engagement rate is 6.3%
As reported by eMarketer, Facebook native videos have the average engagement rate of 6.3%, compared to 3.2% for Youtube videos and 0.2% for Instagram videos.
35) Most videos posted on Facebook are native to the platform
The same eMarketer study uncovered that most brands create video posts native to Facebook. Almost two-thirds (65%) of brand video posts to Facebook are Facebook native. Some 24% of video posts to the social network are links to YouTube.
36) Facebook video ads have the lowestCPC
A 2015 report by Kinetic Social showed that video ads have the lowest eCPC, with an average eCPC of $0.18.
37) 85% of Facebook videos are consumed without sound
According to Digiday’s survey of multiple publishers, as much as 85 percent of video views happen with the sound off
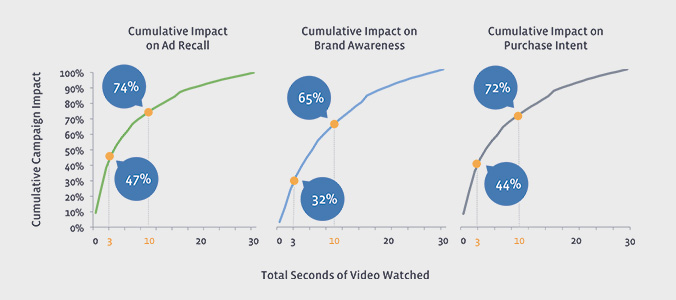
38)47% of video campaigns’ value is delivered in first 3 seconds
Facebook with Nielsen analyzed how people react with Facebook video campaigns. The data showed that people who watched under three seconds of the video ad created up to 47 percent of the total campaign value.
39) Captioning Facebookvideos increases the watch time by 12%
Facebook’s internal tests have shown that captioned video ads increase video view time by an average of 12%.
40) 80% of people don’t like mobile video ads playing sound automatically
Facebook’s research also showed that most people (80%) do not like when a Facebook newsfeed video starts automatically playing with the sound on.
41) Growth of social video ads is slowing down
While social video ad spending share saw continuous increases between Q1 and Q4 of 2016, there are signs that the growth will be slowing down, according to eMarketer.
42) Facebook live videos are watched 3x longer while they’re live
In a 2016 media release, Facebook’s Product Manager Vibhi Kant wrote that users spend more than 3x time watching a Facebook Live video on average compared to a video that’s no longer live.
43) Facebook’s paying $50+ million to influencers for (live) video use
According to Wall Street Journal, Facebook is paying influencers, publishers, and celebrities $2.2M from the total pool of $50+ million to promote Facebook videos, and especially Facebook Live videos.
44) Instagram makes up 20% of Facebook’s mobile ad revenue
As reported by eMarketer, Instagram will make up 20% of Facebook’s U.S. mobile revenue in 2017.
If you’re already advertising on Facebook’s mobile platform, you could test including Instagram feed in your ad placements.
45) Only 42% of marketers feel like their Facebook efforts are working
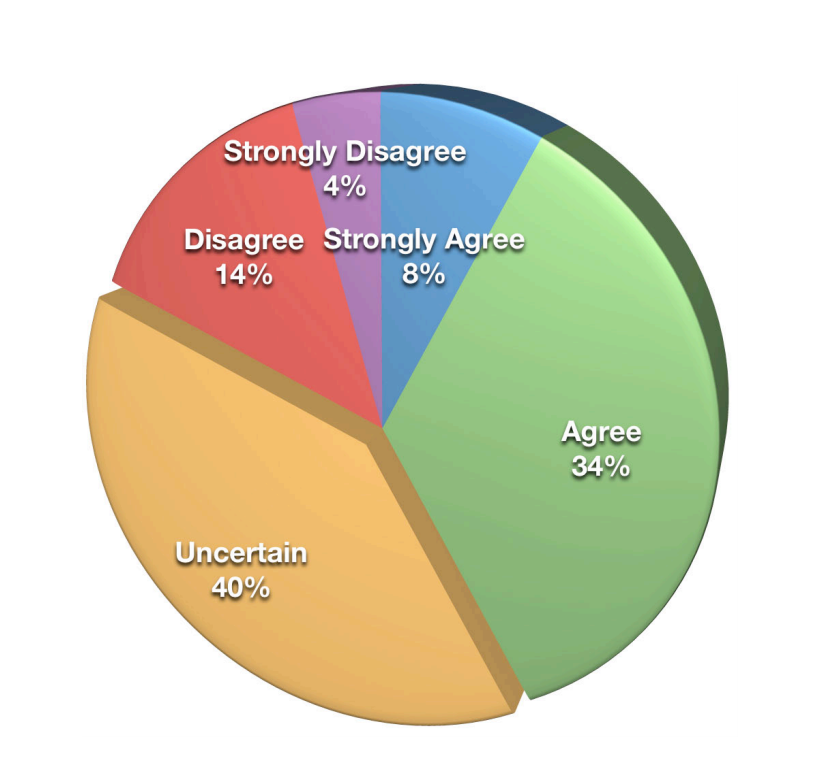
A report by Social Media Examiner showed that while Facebook advertising stats show a growth trend, many marketers are yet unsure whether their Facebook marketing efforts are paying off.
When asked whether their Facebook marketing strategy is effective, only 45% of B2C and 37% of B2B social marketers agreed.
Make sure you’ve set clear Facebook advertising goals and are tracking the conversions across all your Facebook marketing funnel stages.
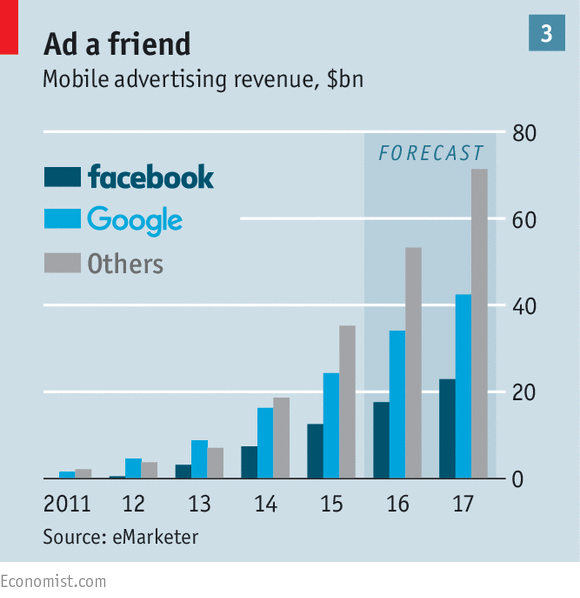
46) Facebook’s worldwide ad revenue will increaseby 35% YoY in 2017
According to a 2017 Facebook advertising report by eMarketer, Facebook is expected to bring in $36.29 billion in worldwide ad revenues this year, up 35.0% from 2016. Within the digital display category, Facebook is No. 1 by a wide margin.
47) Facebook’s advertising revenue keeps growing
According to CNBC, in Q1 2017, Facebook earned $7.86 billion in advertising revenue, up 51 percent from a year ago.
The main factors that have helped Facebook to grow its ad revenue:
- Increasing ad load — the number of ads on the website
- Steady user growth
- Increase in the time spent on Facebook’s platform
48) Facebook’s growth is steady, but slowing down
According to eMarketer’r predictions, the pace of growth for Facebook’s ad revenue will be markedly lower by 2018 than it was in 2016. eMarketer forecasts 26.5% growth in 2018—less than half the pace of the 57.4% increase seen in 2016.
49) 84% of Facebook’s ad revenue comes from mobile ads
According to Facebook’s Q4 2016 earnings report, mobile advertising accounts for 84% of its ad revenue.
If you’re not yet using Facebook’s mobile ads, it’s time to get started!
50) In 2017, mobile will account for 70% of digital media
According to a report on U.S. advertising expenditures in 2017 by eMarketer, mobile will be the main driver of digital’s growth in 2017, accounting for over 70% of digital and more than one-quarter of total media outlays.
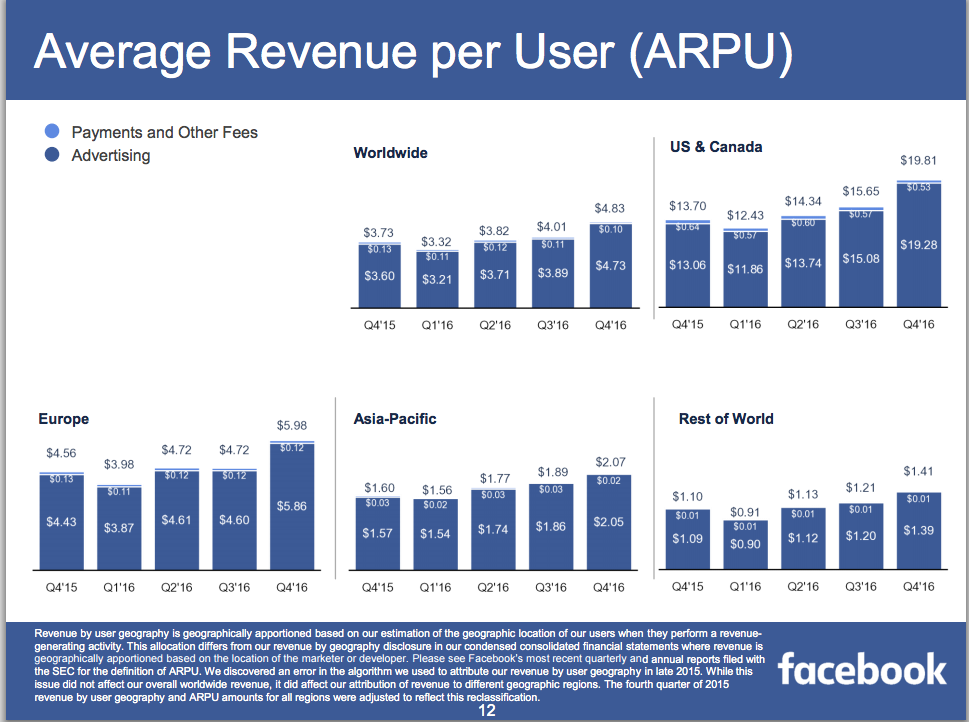
51) Facebook’s average revenue per user is $4.73
According to Facebook’s Q4 2016 earnings report, the avg. revenue per user is $4.73 worldwide. However, it’s a lot higher in the U.S. ($19.81) and also in the EU ($5.86).
Facebook Ad Stats: Benchmarks
When you’re just getting started with Facebook advertising, it’s really hard to tell whether your ad campaigns are performing better or worse than the industry average.
So, how can you know if all your campaigns and Facebook ad hacks are paying off?
The best way to learn is to keep practicing.
However, if you want a quick cheat sheet on the average Facebook ad costs and engagement rates, read on.

Up next, you’ll learn what’s the avg. cost-per-click of Facebook campaigns, what’s the cheapest ad placements, and much more.
52) The average click-through rate (CTR) for Facebook ads is 0.90%
The avg. Facebook ad CTR across all industries is 0.90%. Here’s a list of the average click-through rates in specific industries, shared by Wordstream:
- Apparel – 1.24%
- Retail – 1.59%
- B2B – 0.78%
- Technology – 1.04%
- Finance & Insurance – 0.56%
Read our guide to learn how to increase your Facebook ads CTR.
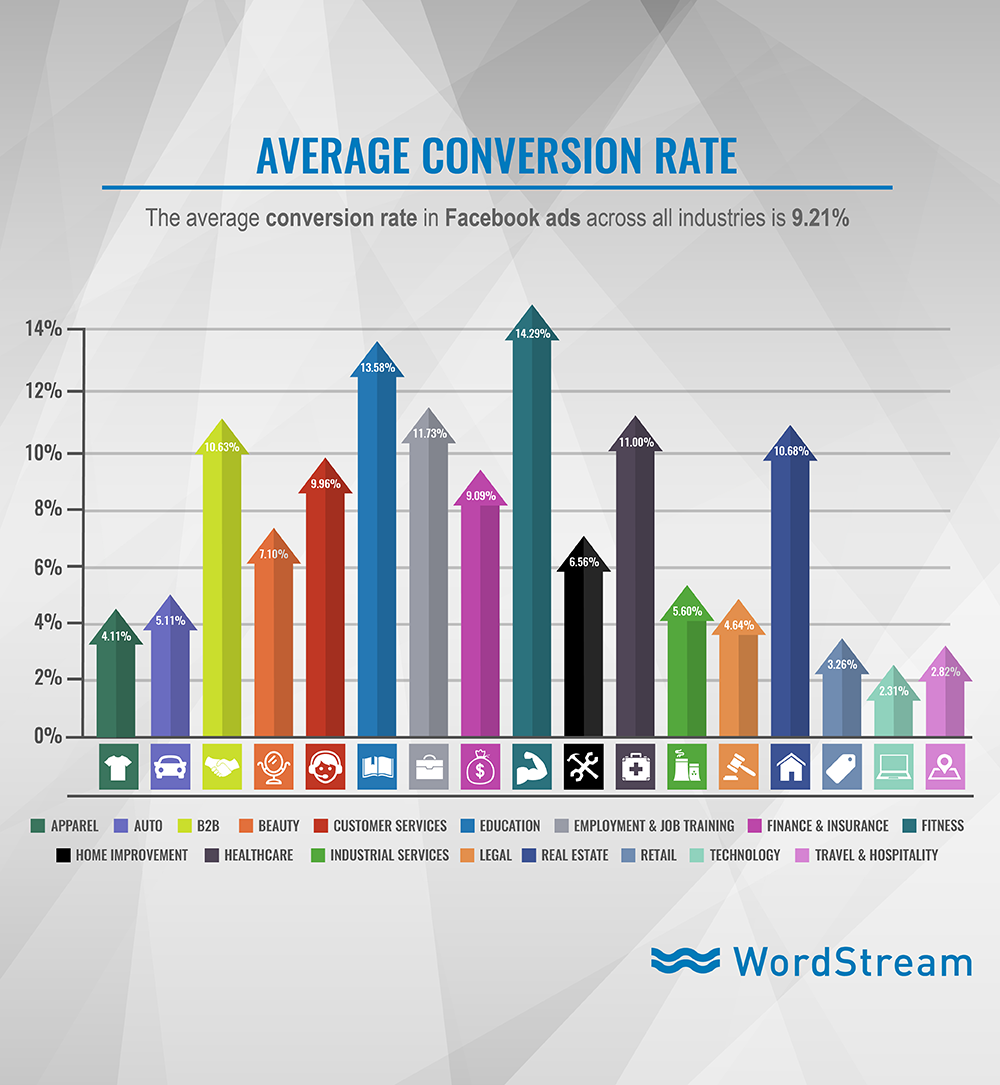
53) The average conversion rate for Facebook ads is 9.21%
The same report by Wordstream revealed that the avg. conversion rate is highest in the fitness industry (14.29%) and education (13.58%). It’s the lowest in the technology (2.31%) sector.
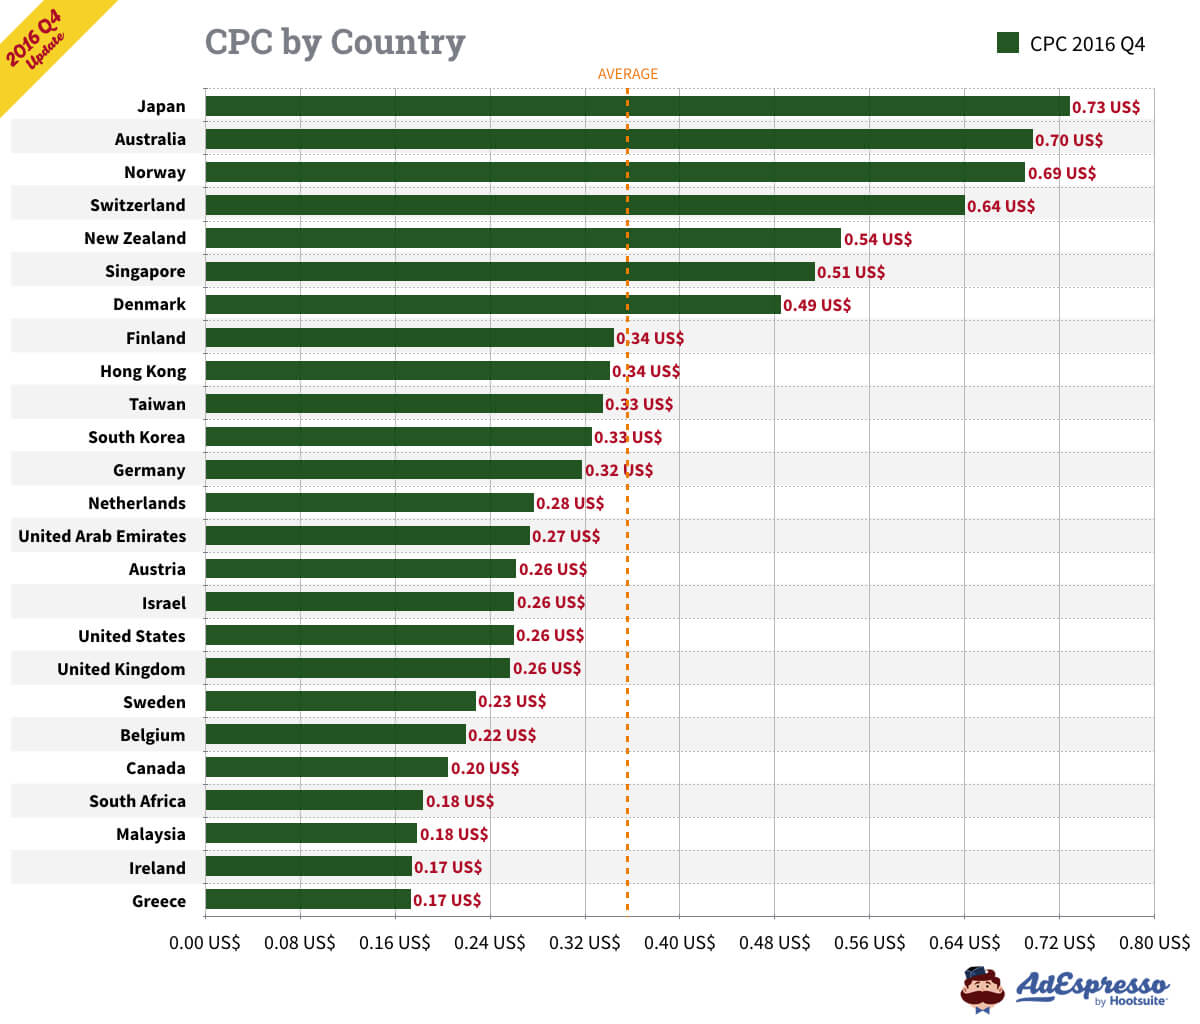
54) The average CPC for Facebook ads is $0.35
When analyzing the Q4 2016 Facebook ad stats, AdEspresso found that the average cost-per-click of Facebook ads is $0.35. In the U.S., the avg. CPC is $0.26.
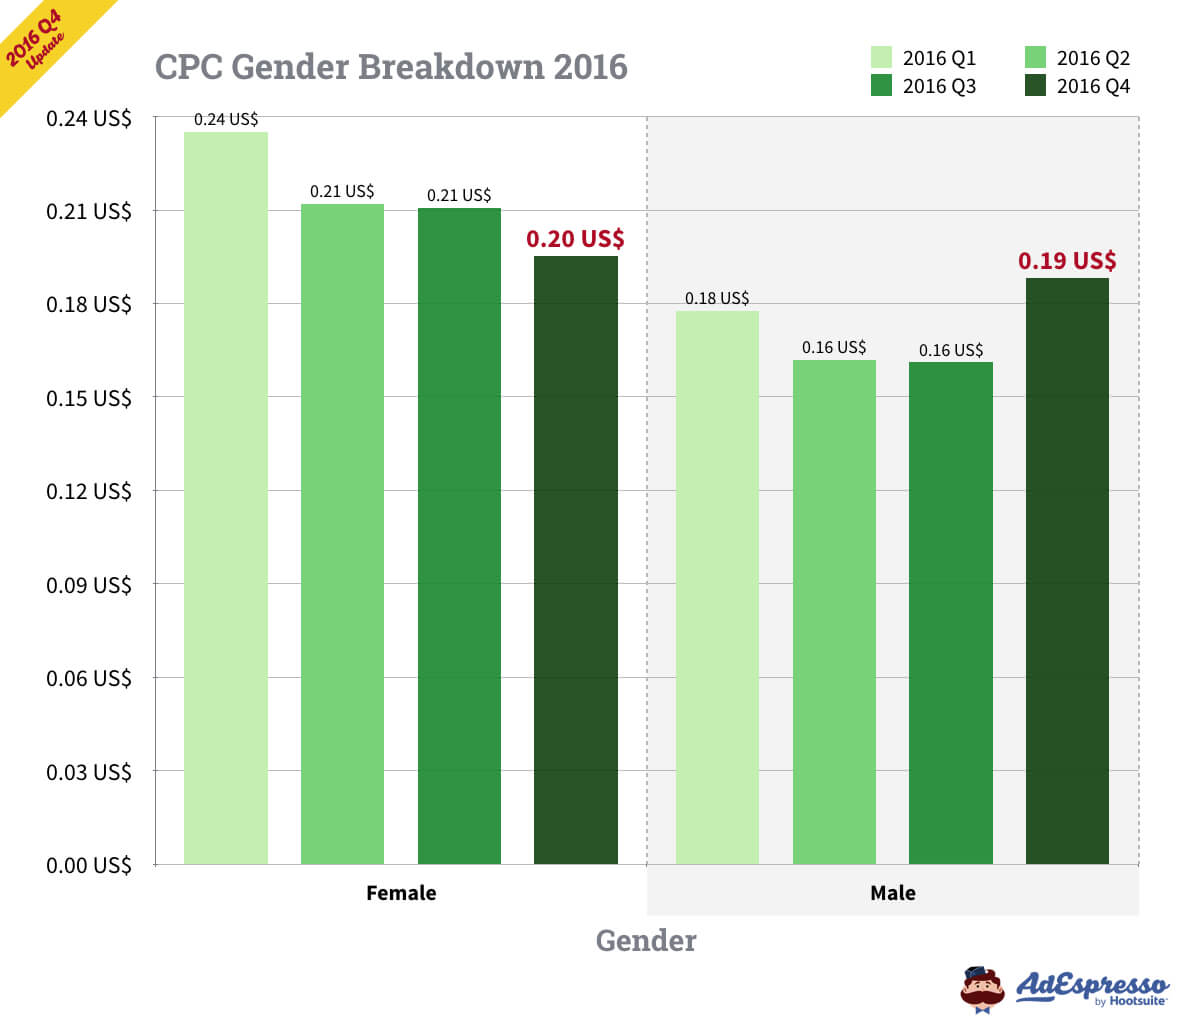
55) The average CPC is higher for female audiences
When compared by gender, the CPC tends to be higher when advertising to female audiences, according to AdEspresso’s data. In Q4 2016, the avg. CPC for female audiences was $0.24 and $0.19 for male target groups.
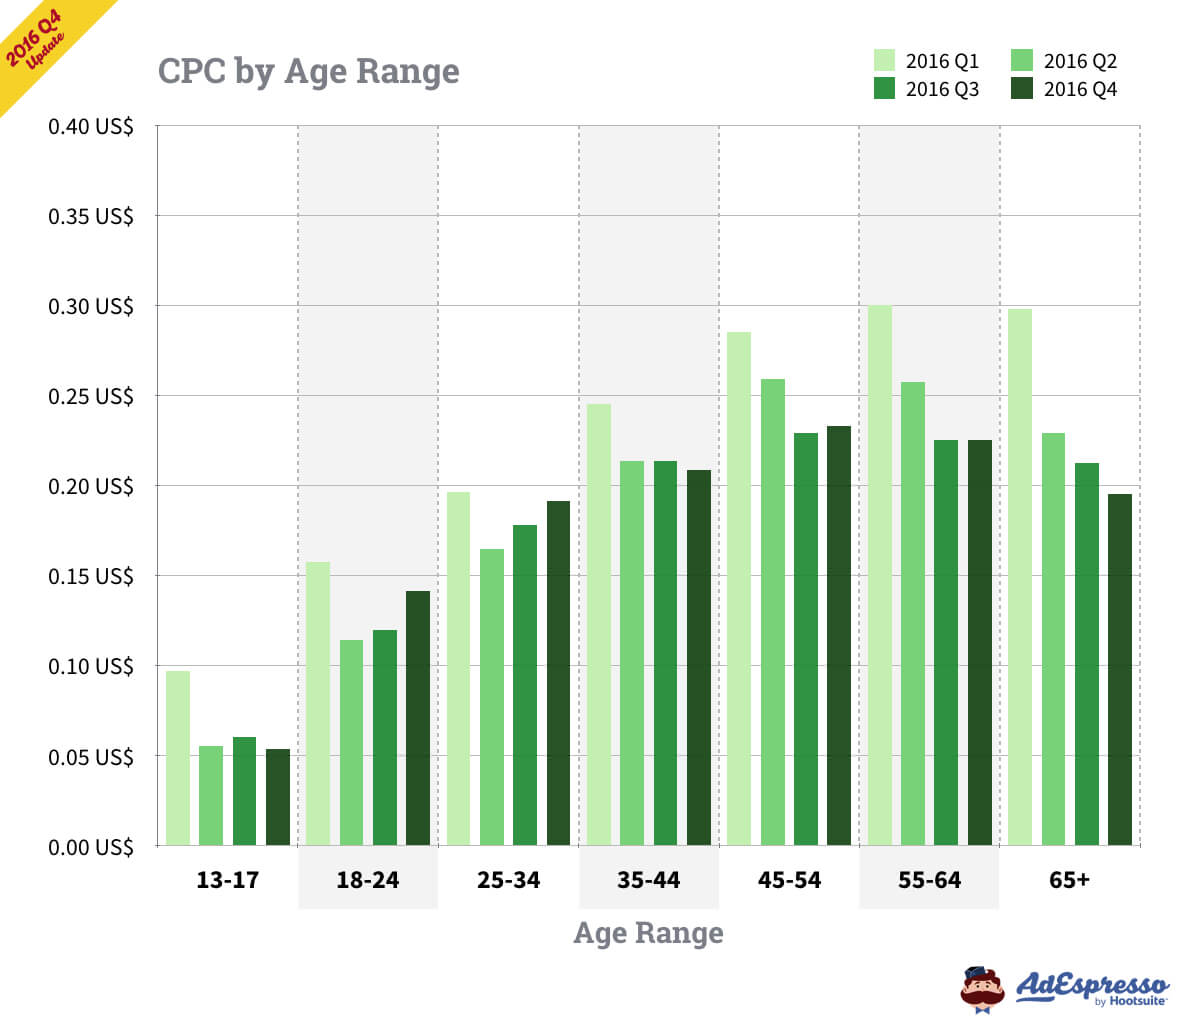
56) It’s more expensive to advertise to older audiences
AdEspresso’s research also showed that it’s slightly more expensive to be advertising to audiences aged between 45-65+ years, compared to say people aged 18-44 years.
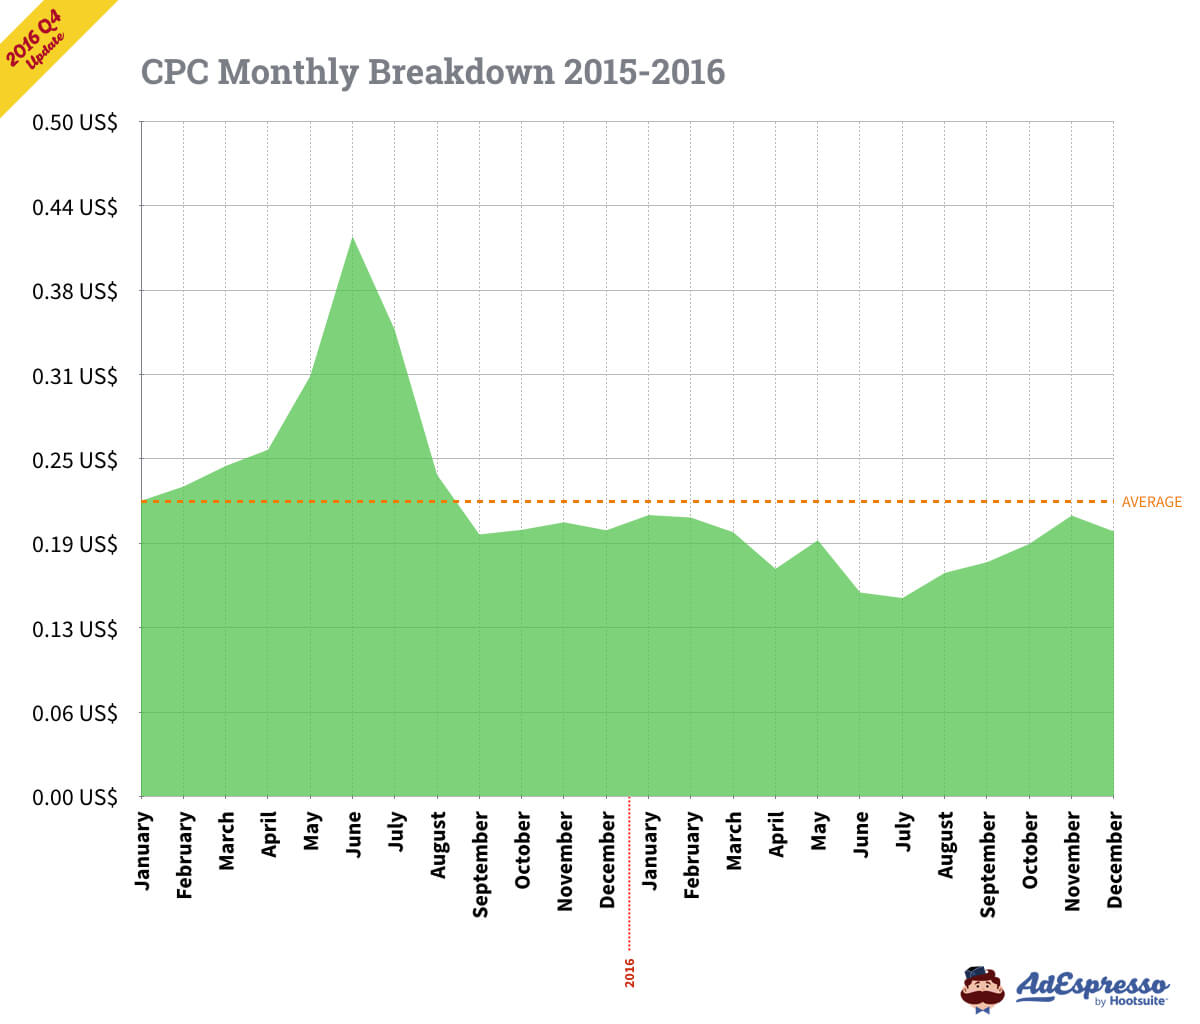
57) The avg. Facebook ads CPC is lower in summer months
According to AdEspresso’s research, the average Facebook ads CPC in 2016 was highest in October and November. The cheapest months for Facebook advertising in 2016 were June and July.
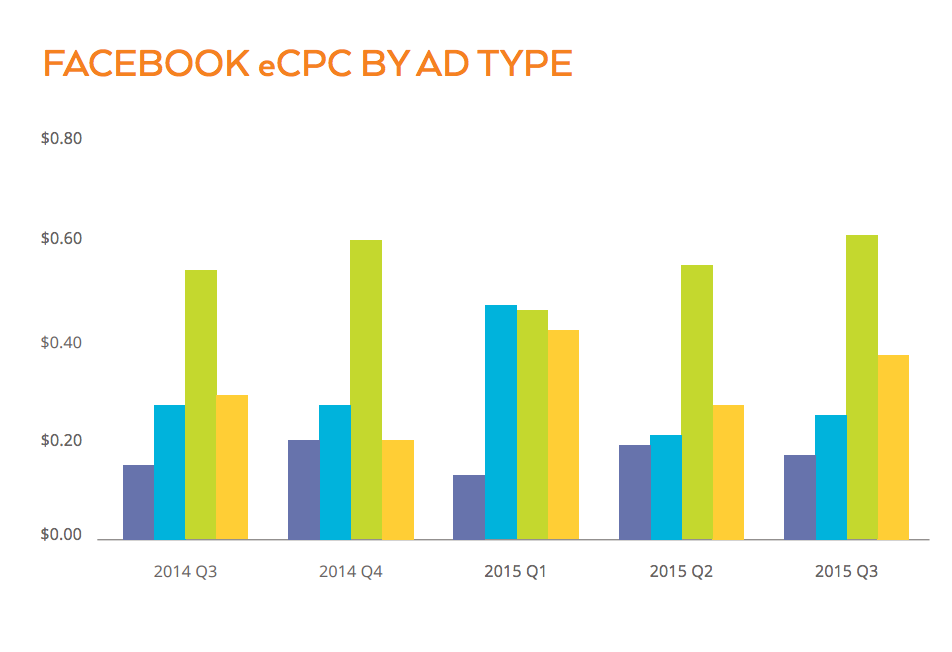
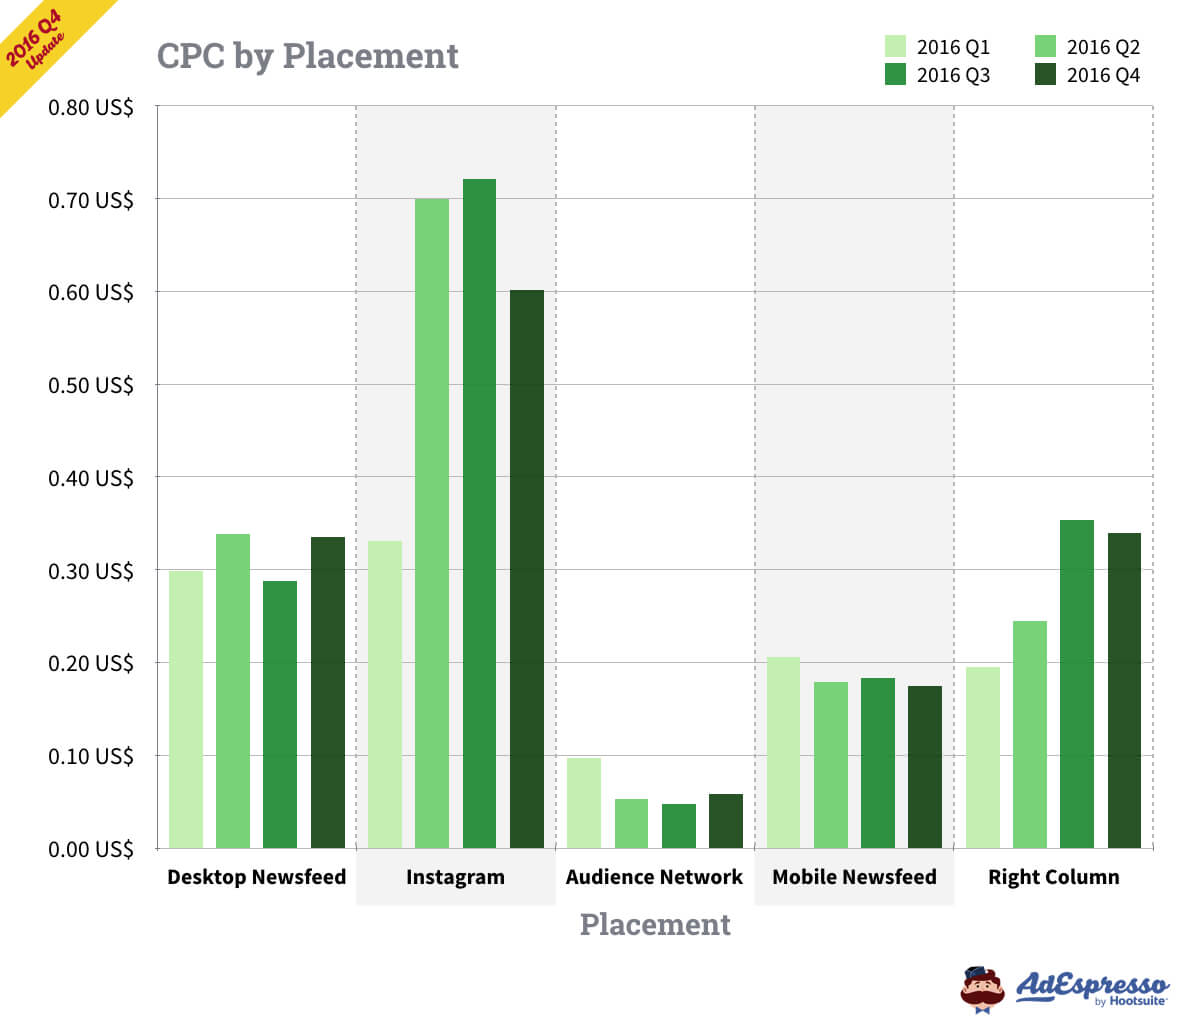
58) Right-hand column and Desktop ads have the highest CPC
In Q3 2016, the average cost-per-clicks across different Facebook ad placements were the following, as reported by AdEspresso:
- Desktop newsfeed – $0.32
- Mobile newsfeed – $0.19
- Instagram – $0.60
- Right-hand column – $0.32
- Audience network – $0.06
59) The most expensive day to advertise on Facebook is Friday
According to AdEspresso’s analysis of Facebook ad costs, the average cost-per-click of Facebook ads is at its highest on Fridays ($0.27), followed by Thursday ($0.25).
However, this is a general stat and the CPC might vary depending on your industry, audience, offer, and many other factors.
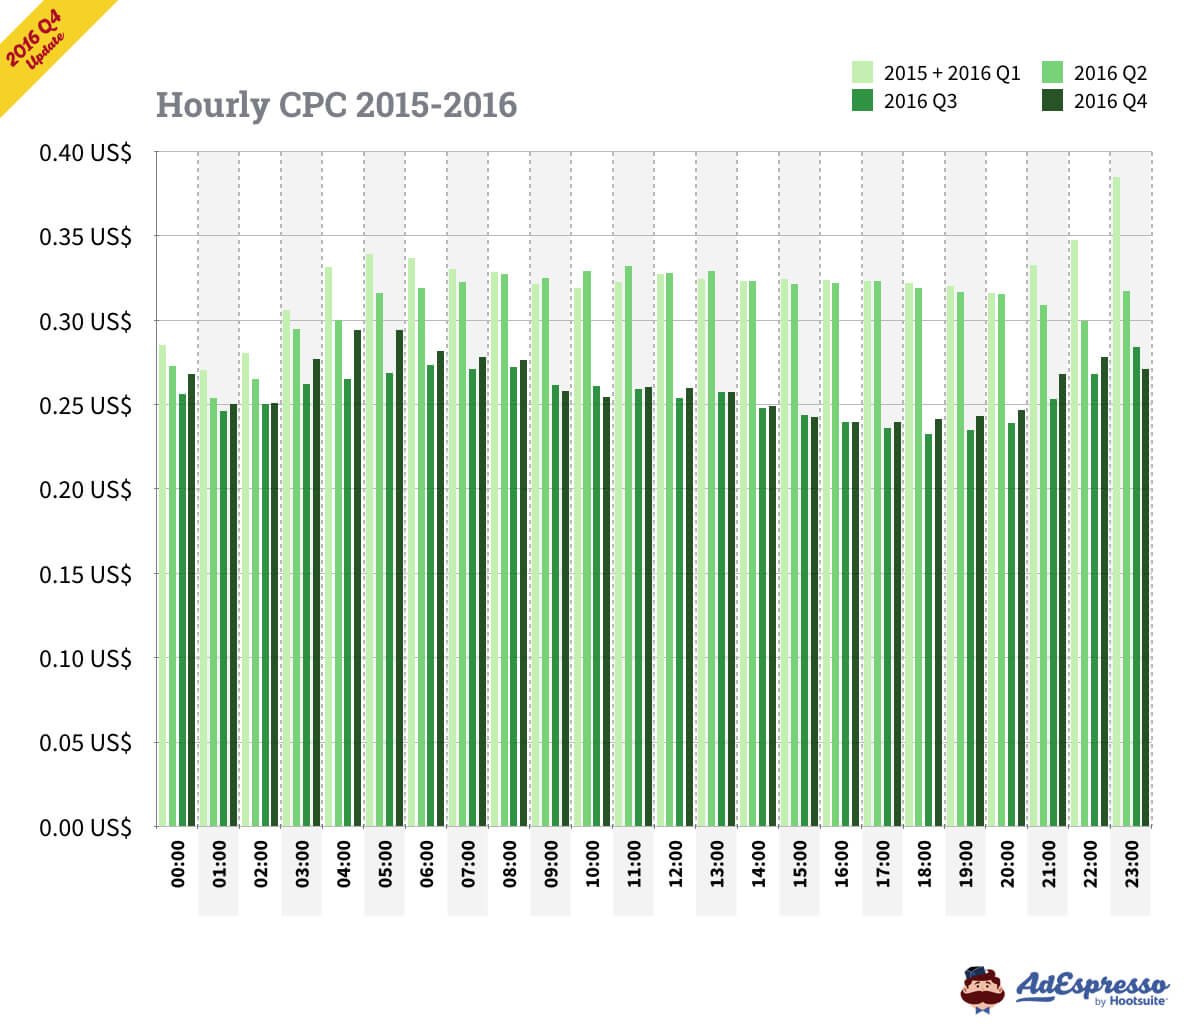
60) The cheapest time of day to advertise on Facebook is evening
Surprisingly, the cheapest time to advertise on Facebook is arguably the most popular one – the evening commute. AdEspresso’s research showed that the avg. CPC between 4p.m. and 8p.m. is around $0.23.
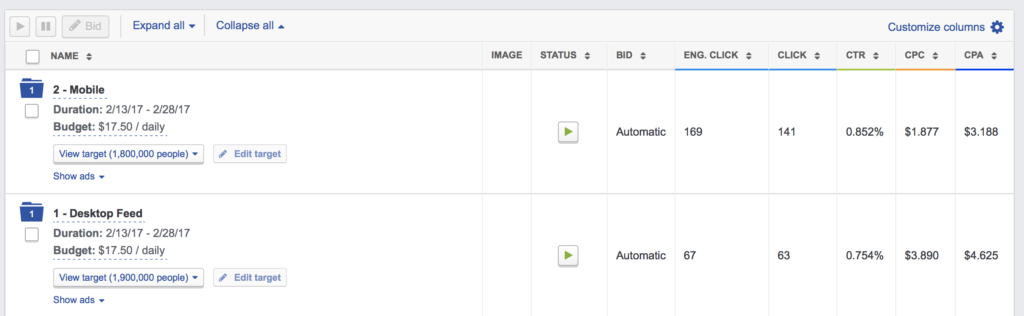
61) In one Facebook ad test, mobile outperformed desktop ads by 34%
AdEspresso ran a Facebook ads experiment where the Desktop ad placement (avg. CPA $4,625) had an over 34% higher cost-per-acquisition compared to Mobile ads (avg. CPA $3,188).
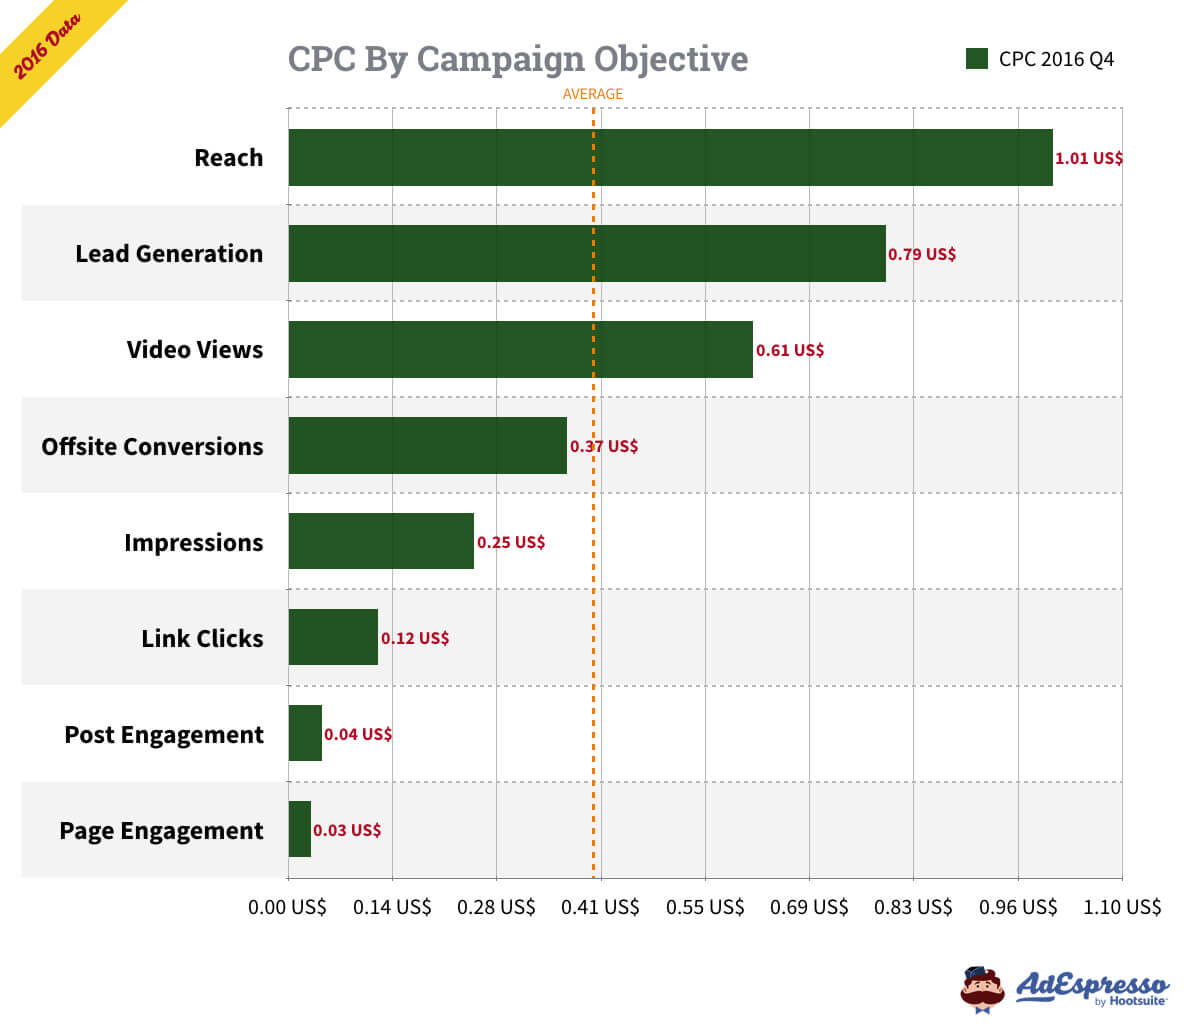
62) The CPC with Page Engagement campaign objective is $0.12
If your goal is to drive many clicks at a low cost, AdEspresso recommends that you use one of these campaign objectives:
- Page engagement – avg. CPC $0.03
- Post engagement – avg. CPC $0.04
- Link Clicks – avg. CPC $0.12
63) The average cost per action (CPA) for Facebook ads is $18.68
While the report by Wordstream fails to mention what exactly they mean by cost per action, we’re fairly sure they meant the cost per conversion or cost per acquisition.
According to the report, the average cost per action (CPA) for Facebook ads is $18.68. It’s around three times higher for the technology ($55.21) sector and a lot lower for education ($7.85).

64) The avg. cost per 1,000 ad impressions (CPM) is $7.19
AdEspresso analyzed thousands of Facebook ad campaigns and discovered that the average cost per 1,000 ad impressions (cost per mile) is $7.19, and $7.34 for ALL objectives.
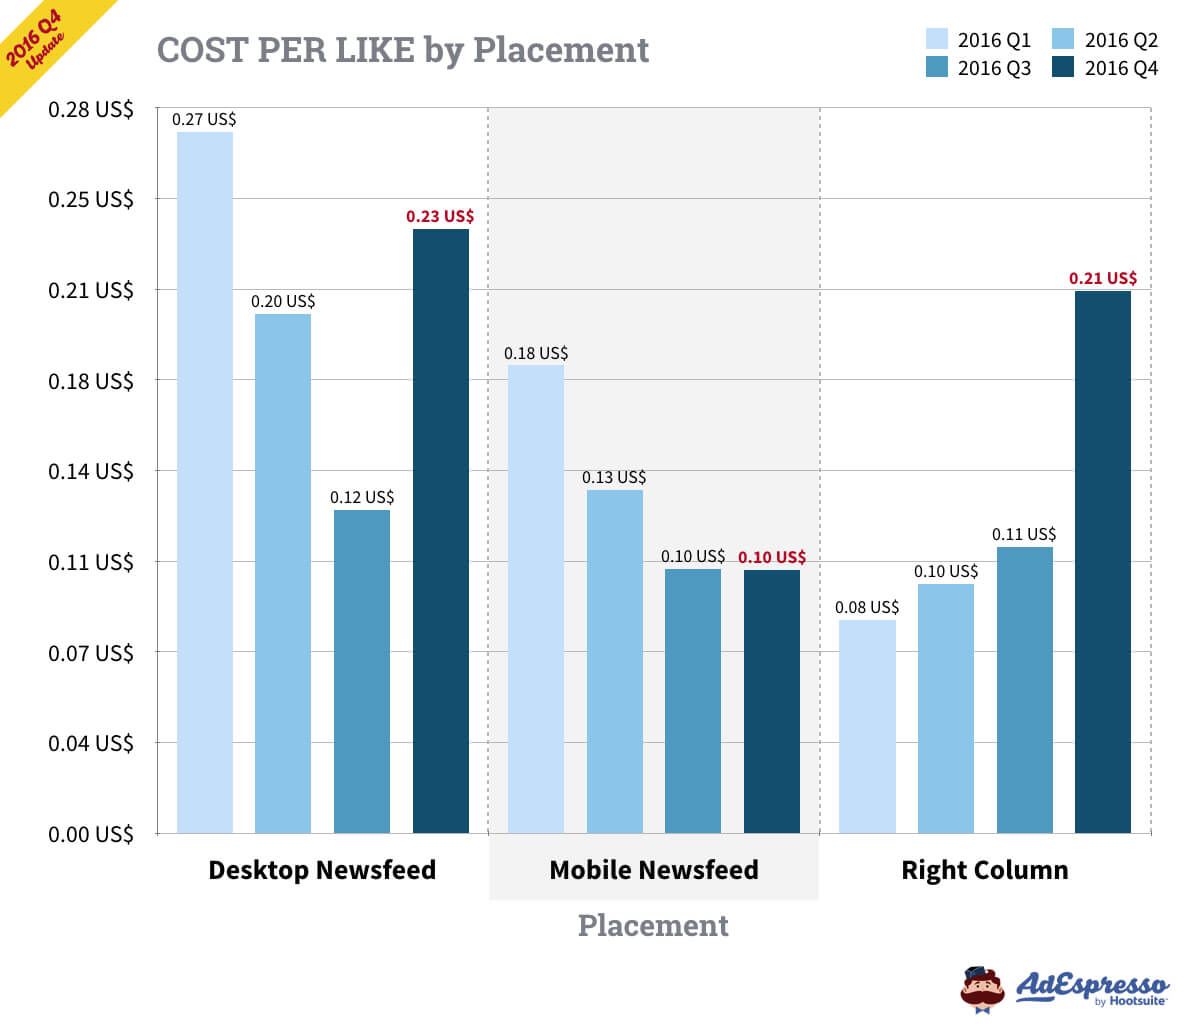
65) The average cost-per-like for Page Like campaigns is $0.26
AdEspresso’s research showed that for campaigns created with the Page Likes objective, the average cost-per-like was $0.26 in Q4 2016. It was even lower with Mobile newsfeed ad placement ($0.10).
66) If you want more page likes, advertise on mobile
AdEspresso’s research also showed that the avg. cost-per-like is the lowest for mobile Facebook ads. In Q4 2016, the average cost-per-like for mobile placement was $0.10, compared to $0.23 for desktop and $0.21 for right-hand column.
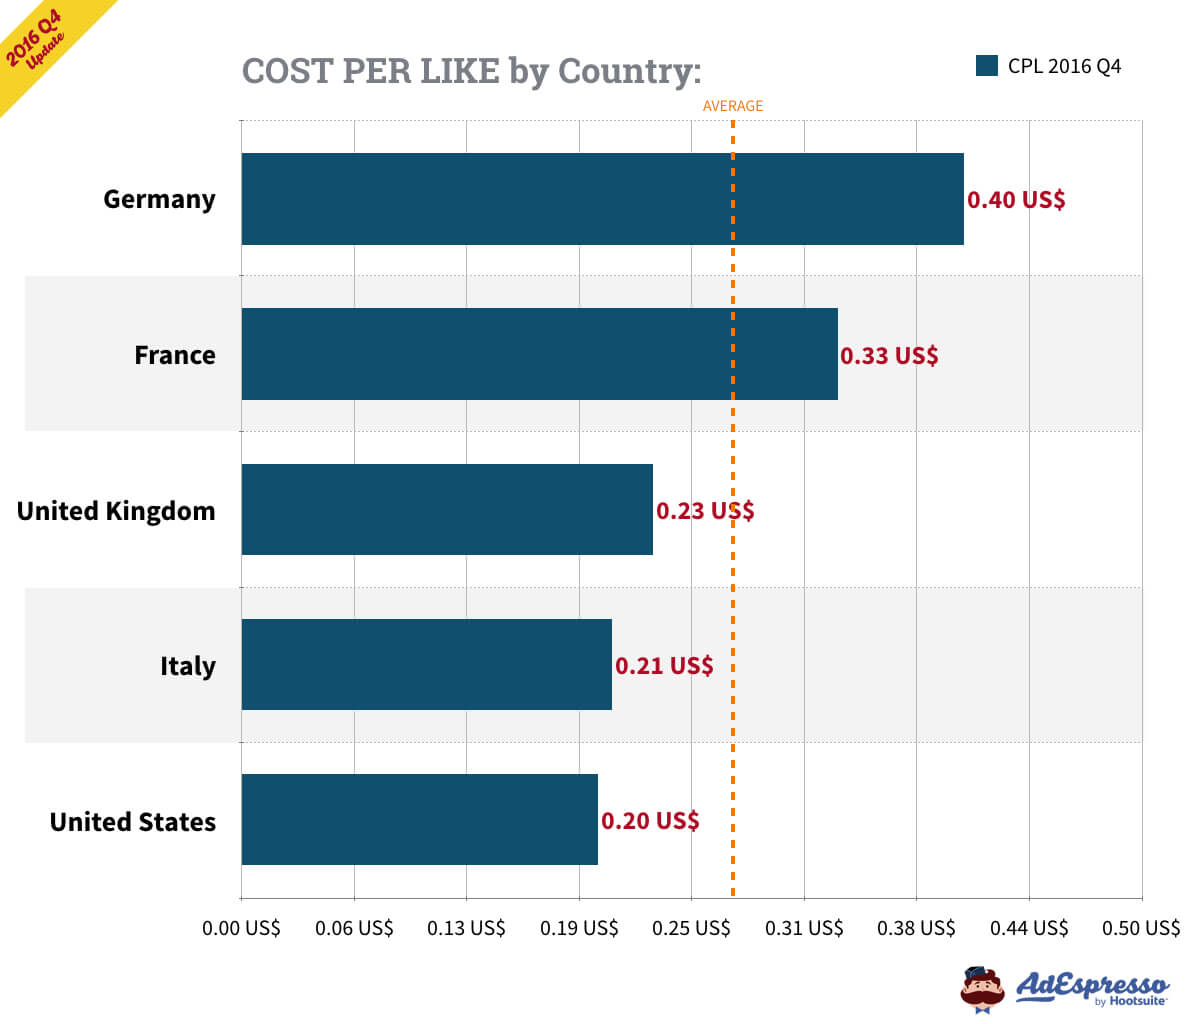
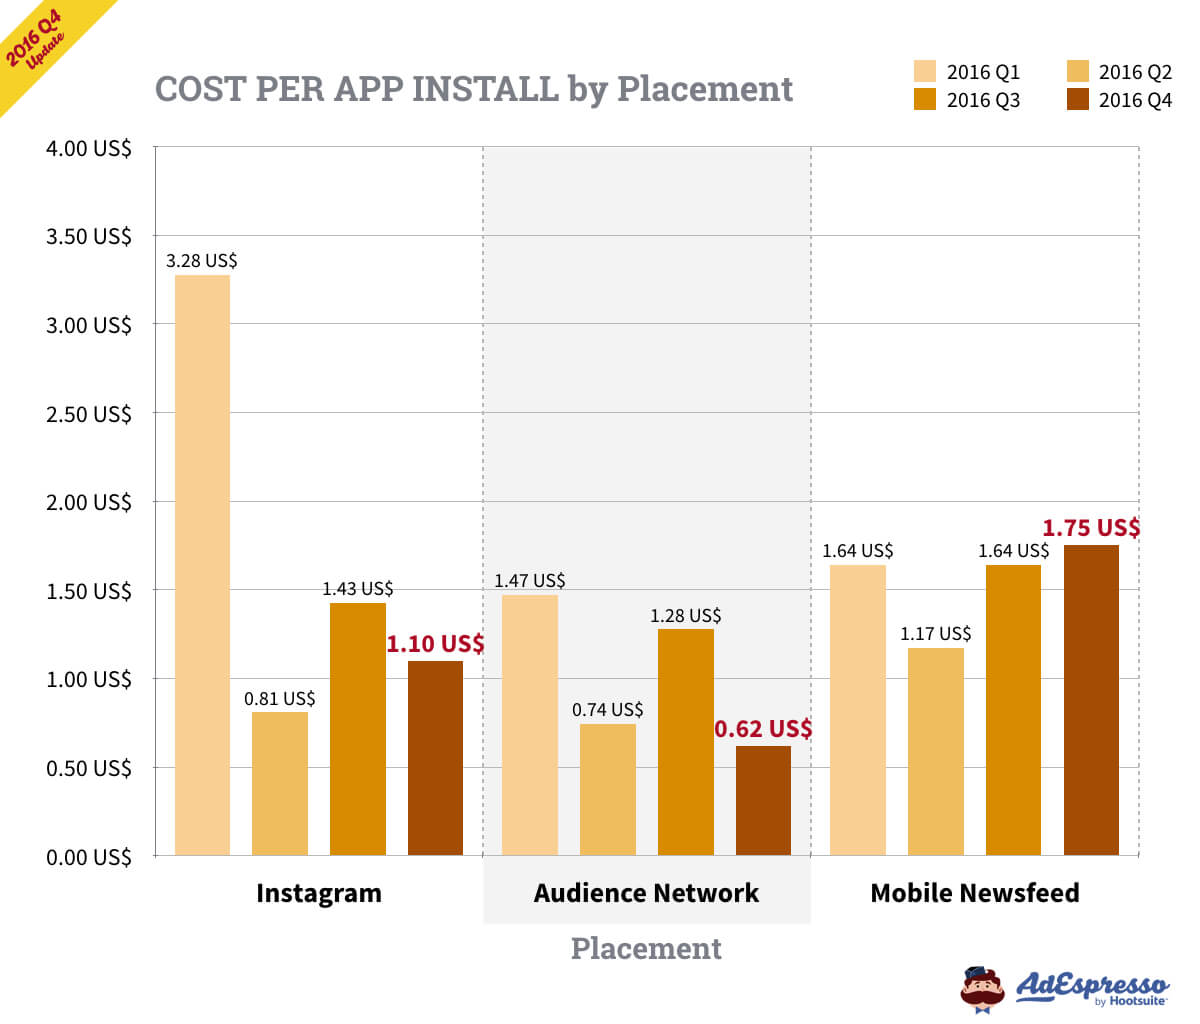
67) The average cost per app install for Facebook ads is around $1.70
According to AdEspresso’s research, the cost per app install is highest in the UK ($5.40), Germany ($3.18), and the U.S. ($2.28). The avg. cost per app install for Facebook ads is around $1.70.

68) The average cost per app install is lowest in Audience Network
While you may have guessed that it’s best to advertise your mobile app in Facebook’s mobile newsfeed, it’s not necessarily true. AdEspresso’s data shows that the cost per app install is lowest for the Audience Network ad placement ($0.62).
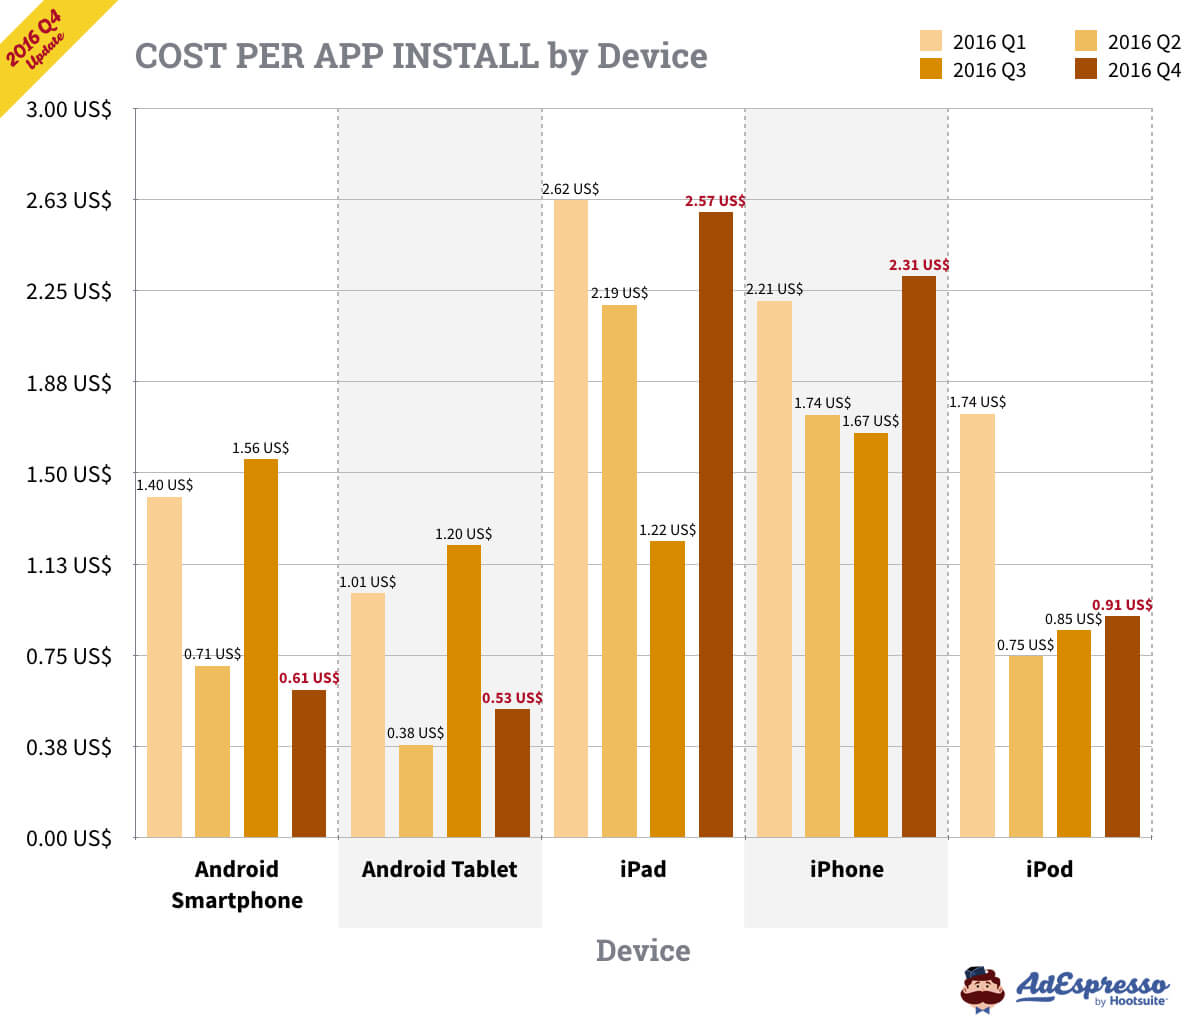
69) The avg. cost per app install is cheapest on Android devices
If you’re unsure which device users to target with your Facebook ads promoting a mobile app, test advertising to Android tablet and smartphone users. It’s sometimes three times more expensive to get iPad and iPhone users to download your mobile app, AdEspresso found.
70) 69% of Facebook ads link to a landing page
AdEspresso’s Facebook ad analysis revealed that 69% of all Facebook ads link to a landing page. 20% of ads link to a Facebook page and 11% to the company’s home page.
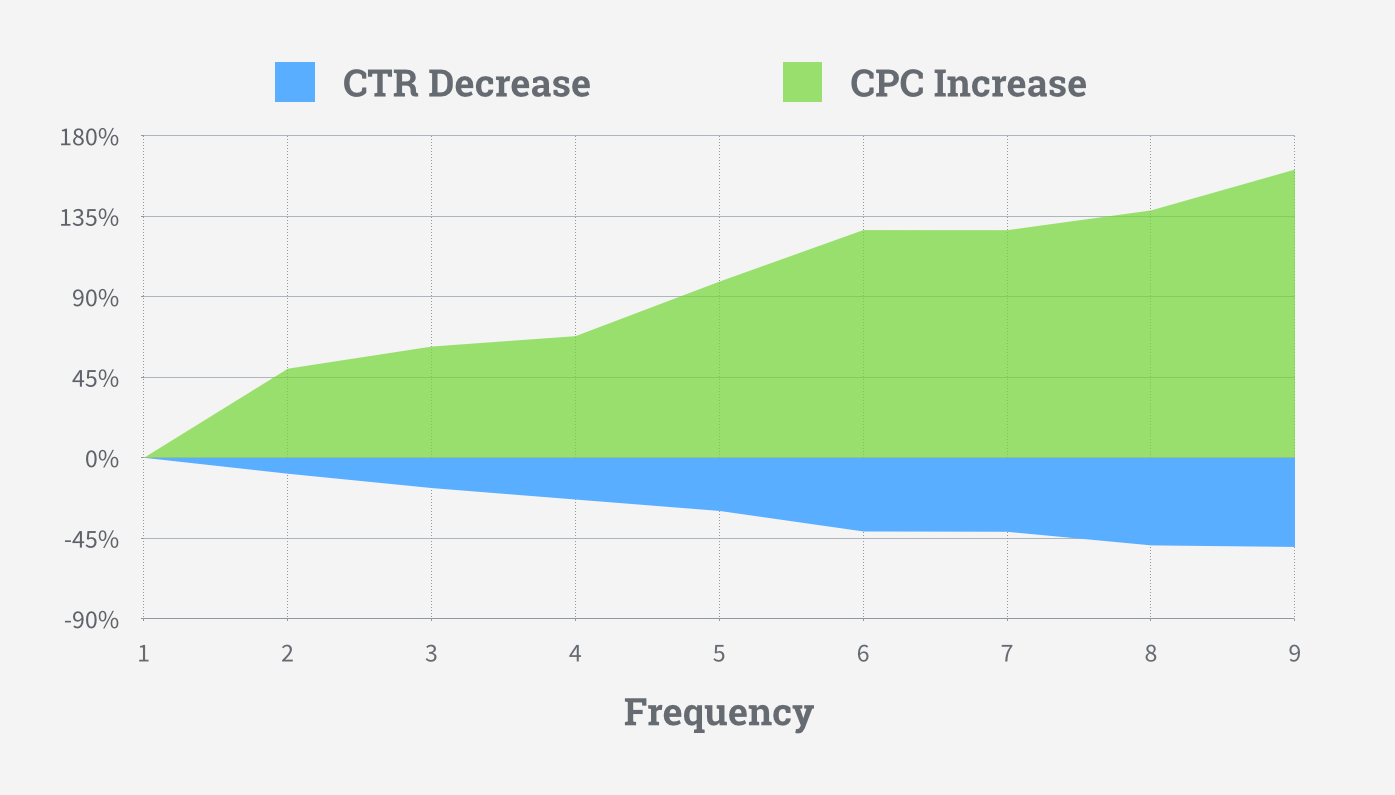
71) Your CPC increases by 49.82% when ad frequency reaches 2 points
Ad frequency is a Facebook ad metric showing how many times your target audience has seen your Facebook ads on average.
AdEspresso found that once your ad frequency reaches 2 points (people have seen your ad at least for two times), the average CPC increases by 49.82% and the CTR decreases by 8.91%.
72) 1% Lookalike Audience has a lower CPC than 10% Lookalike
AdEspresso ran a Facebook ads experiment, testing three different Lookalike Audiences: 1% Lookalike, 5% Lookalike, and 10% Lookalike.
The 10% Lookalike Audience had a 70% higher cost-per-conversion than the 1% Lookalike Audience.
73) $5 Per Day on Facebook Ads Can Buy You 9 Page Likes
Buffer tested what advertisers can get for a $5/day Facebook ad spend. They discovered that you could get 9 page likes at $0.57 per like.
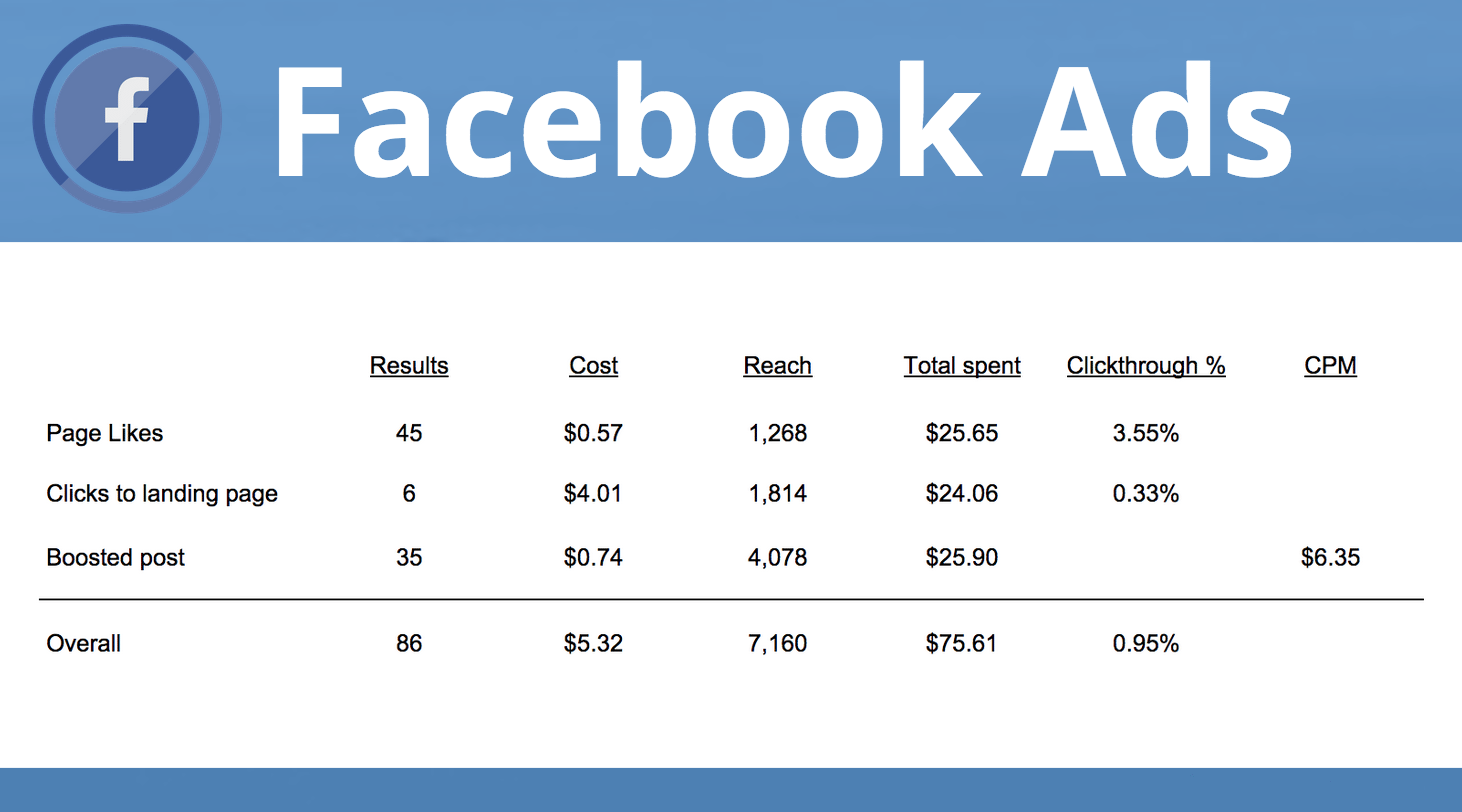
74) A Facebook ad click taking to a B2B site costs $4.01
According to an experiment by Buffer, the average cost per landing page click to a B2B website costs $4.01. However, if you’re able to create highly relevant Facebook ads, this number could be a lot smaller.
75) Reaching 1,000 people with Facebook adscosts $6.35
In the same experiment, Buffer’s team uncovered that reaching an additional 1,000 people with your Facebook ad campaigns costs around $6.35.
However, Buffer was targeting a B2B audience in a highly competitive industry. You can get results by a lot lower budgets.
76) $5 boostedpost can help to reach 787 people
The third key takeaway from Buffer’s Facebook ad experiment is that boosting a Facebook page post for $5 helped them reach 787 people on average.
As Buffer’s team also noted in the article, their advertising costs were really high compared to the industry average.
77) 75% of your Facebook post’s engagement happens in the first 5 hours
According to Post Planner’s research, 75% of the engagement you get on your posts happens within the first 5 hours.
After that, engagement pretty much dies off.
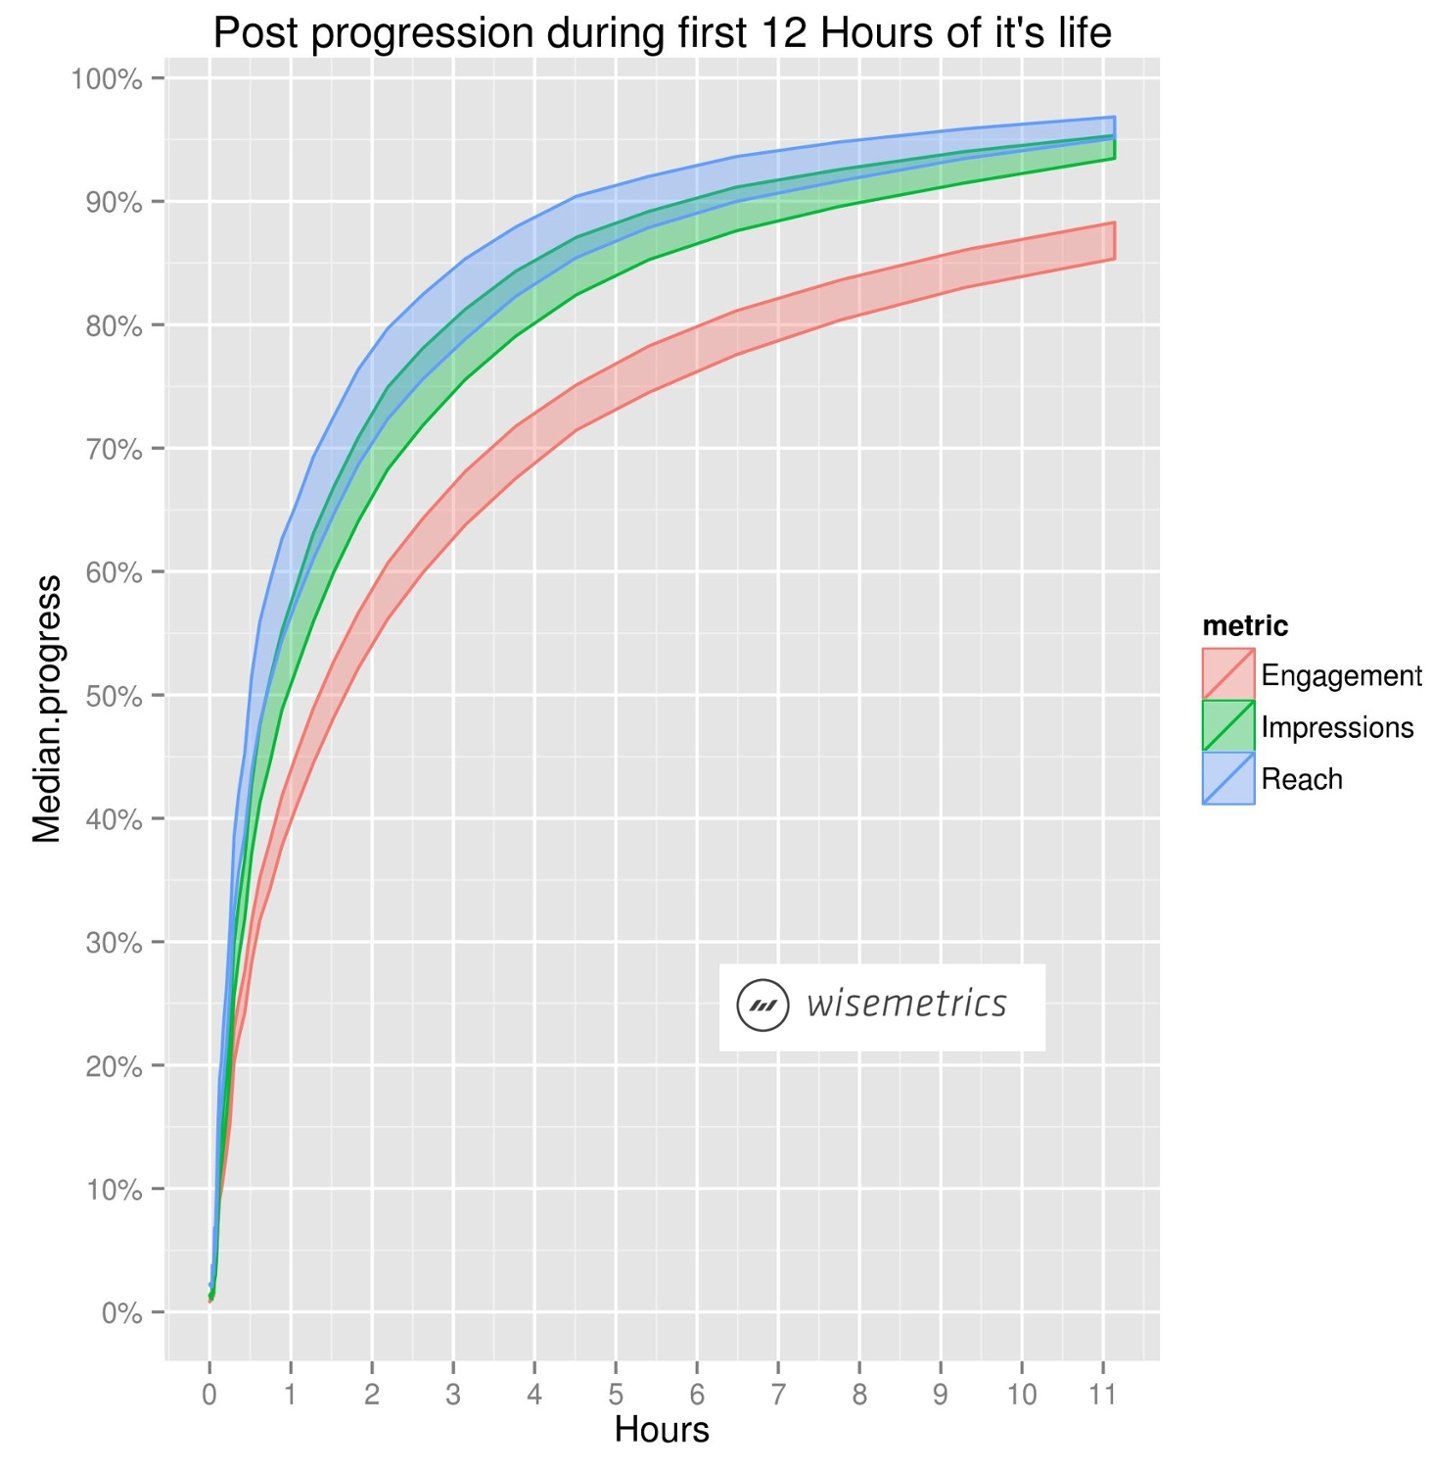
78) 75% of Facebook post’s lifetime impressions happen in 150 minutes
The same case study by Post Planner, data showed that 75% of impressions happen in just the first 150 minutes after publishing your Facebook post.
This could mean that once your Facebook post has been published for 2.5 hours, it might be a good time to boost it for further reach.
79) Your Facebook post’s reach depends on the size of your fanbase
According to research by Socialbakers, the organic reach of your Facebook posts depends on the size of your Facebook fanbase. The fewer page likes you have, the more people liking your page will see your post in their newsfeed.
What this means is that with growing your Facebook fanbase, you’ll also need to start using more expensive Facebook boosted posts to reach your entire audience.
80) The best time to post on Facebook is between 12 p.m. and 3 p.m.
Buffer looked into the best times to be publishing on various social media platforms. They found out that you could potentially get the highest post engagement when posting between 12 p.m. and 3 p.m.
On Saturday and Sunday, it’s between 12 p.m. and 1 p.m.
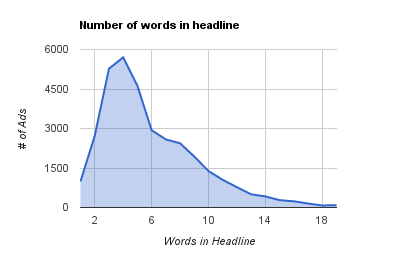
81) Most Facebook headlines are 5 words long
Regarding Facebook ad copywriting, most marketers prefer to use headlines that are 4-6 words long, AdEspresso’s analysis shows.
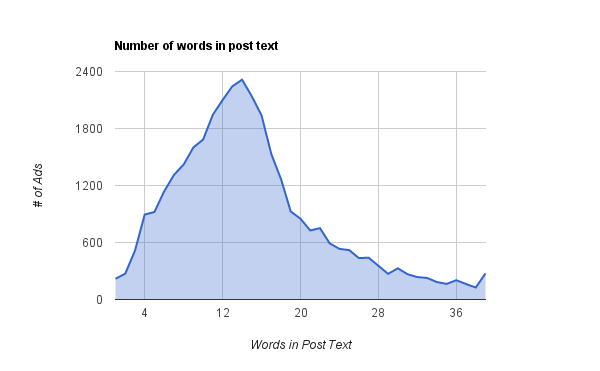
82) The average Facebook ad main copy is 14 words long
When analyzing 37,259 Facebook ads, AdEspresso discovered that the median length for ad post text is just 14 words long.
83) The average Facebook ad link description is 18 words long
The Facebook ad link description tends to be a little longer than the main copy, averaging at 18 words, as reported by AdEspresso.
84) Using a CTA button can lift click-through rates by 2.85 times
AdRoll’s research shows that Facebook ads with a call-to-action button can potentially return 2.85 times better results.
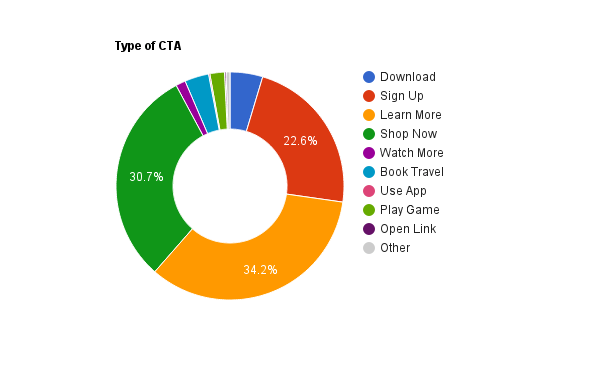
85) The most popular Facebook ad call-to-action button is “Learn More”
According to AdEspresso, the top three most widely used Facebook ad CTAs are:
- Learn More – 34.5% of all ads analyzed
- Play Game – 30.7%
- Sign Up – 22.6%
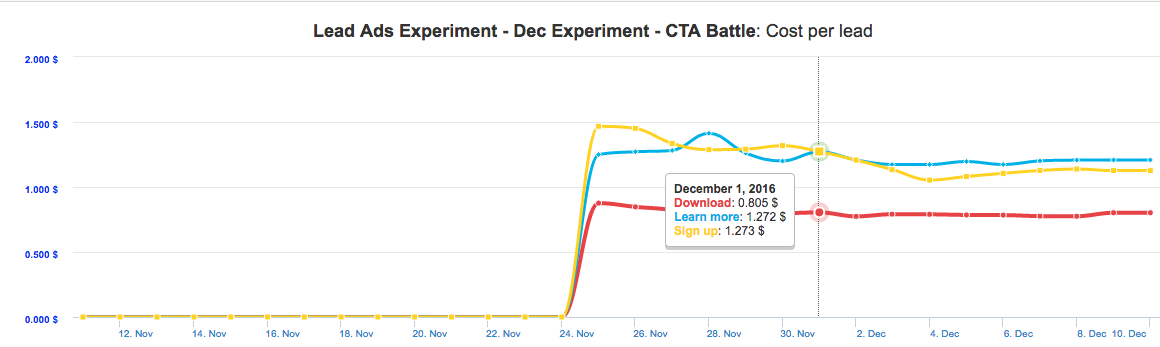
86) According to an experiment, “Download Now” is the best CTA
AdEspresso ran a Facebook ad experiment where they tested three different call to actions: “Download Now, ”Sign Up “,” and “Learn More.” The goal of their campaign was to get people download an eBook.
The “Download” CTA outperformed the “Learn More” CTA by 50.6% and the “Sign Up” CTA by 40.4% regarding the cost per lead.
Facebook Ad Stats: The Audience
Whatever you post or advertise on Facebook, there will likely be thousands of people seeing the message.
In a way, that’s a huge responsibility.
So, who exactly are the audiences you can reach via Facebook’s ad platform?
And how can you make them love your Facebook ads?

We gathered all the Facebook ad stats that describe best the audiences hanging out on the social media platform.
Read on to see whether your target audience can be reached with a Facebook advertising campaign.
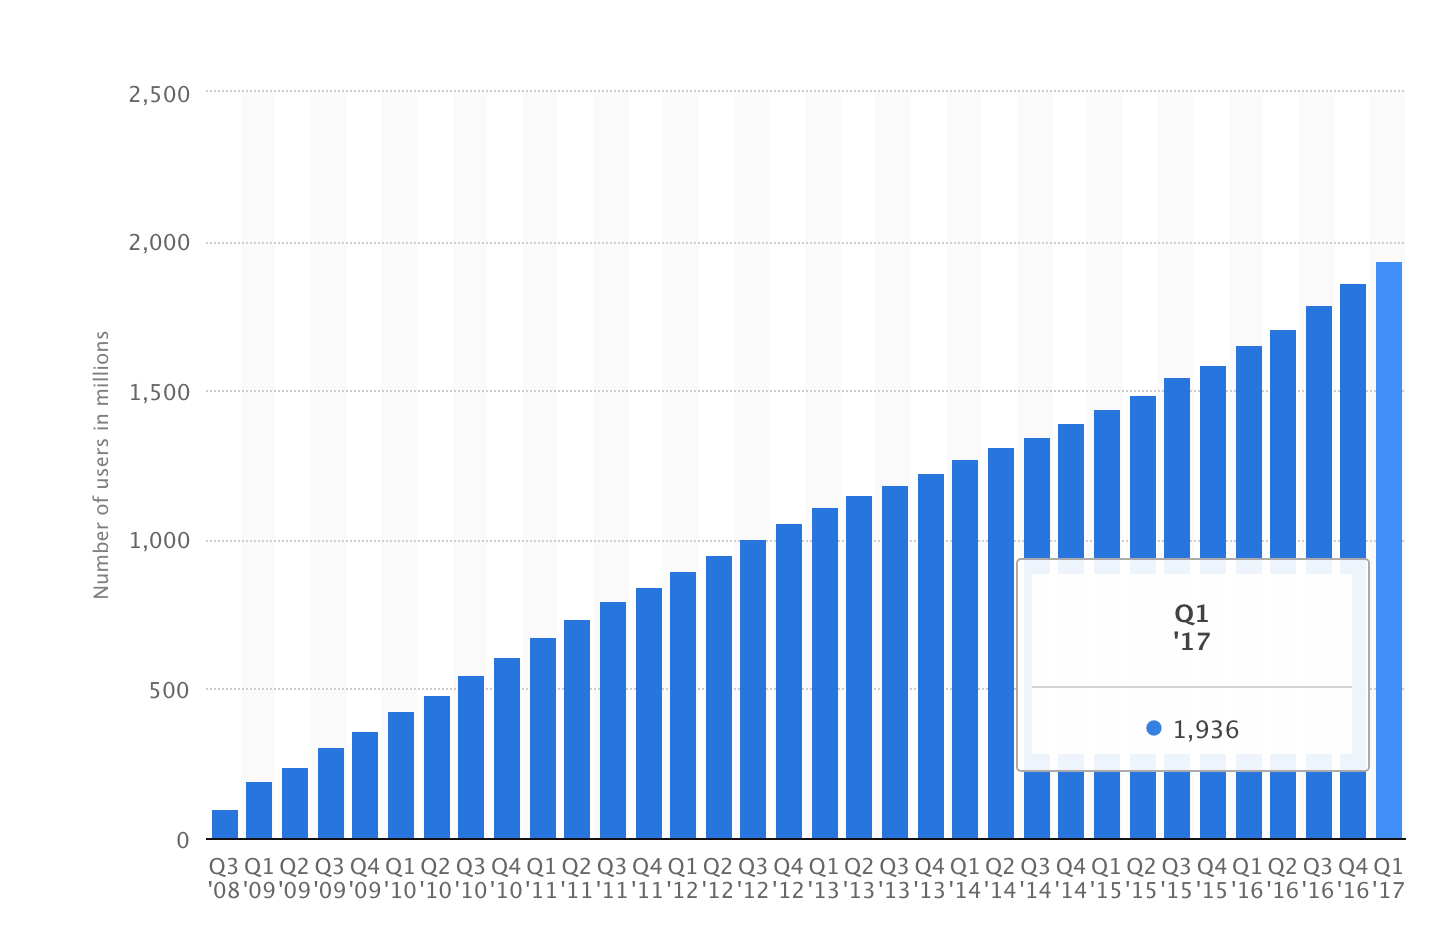
87) Facebook has 1.94 billion monthly active users
According to Statista, as of Q1 2017, Facebook has over 1.9 billion monthly active users.
The MAU (monthly active users) metric is calculated by counting all the unique users that have visited a site/app during a 30-day period.
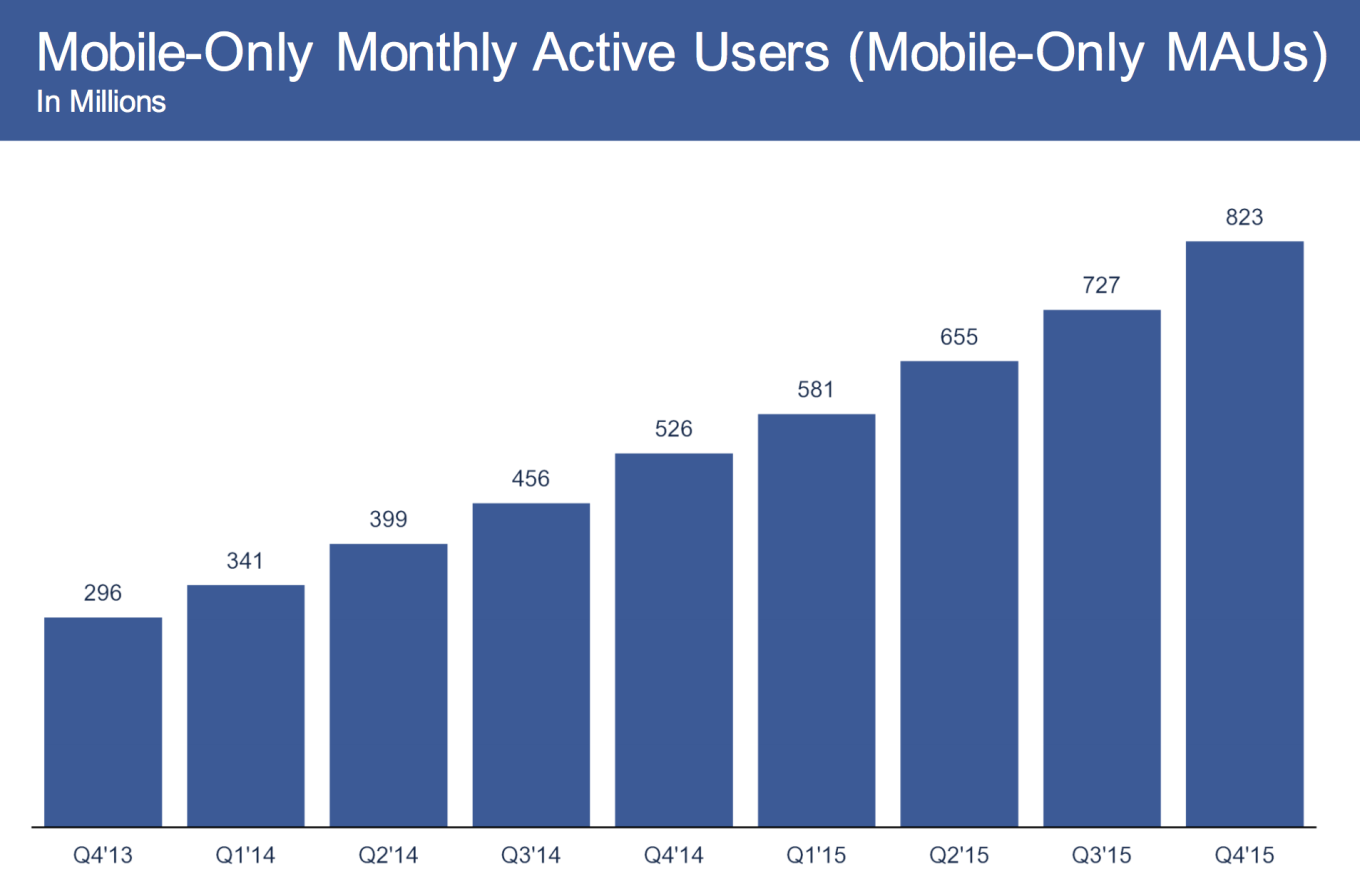
88) More than 820 million people are mobile-only users
As reported by TechCrunch, by the end of 2015, Facebook had 827 million mobile-only users.
89) 80 million people use Facebook Lite
All over the world, 80 million people are using Facebook Lite, a simplified app that brings the essential Facebook experience to budget phones with 2G connections, TechCrunch reported.
This means that you’ll have the potential to reach people even in the less-developed countries.
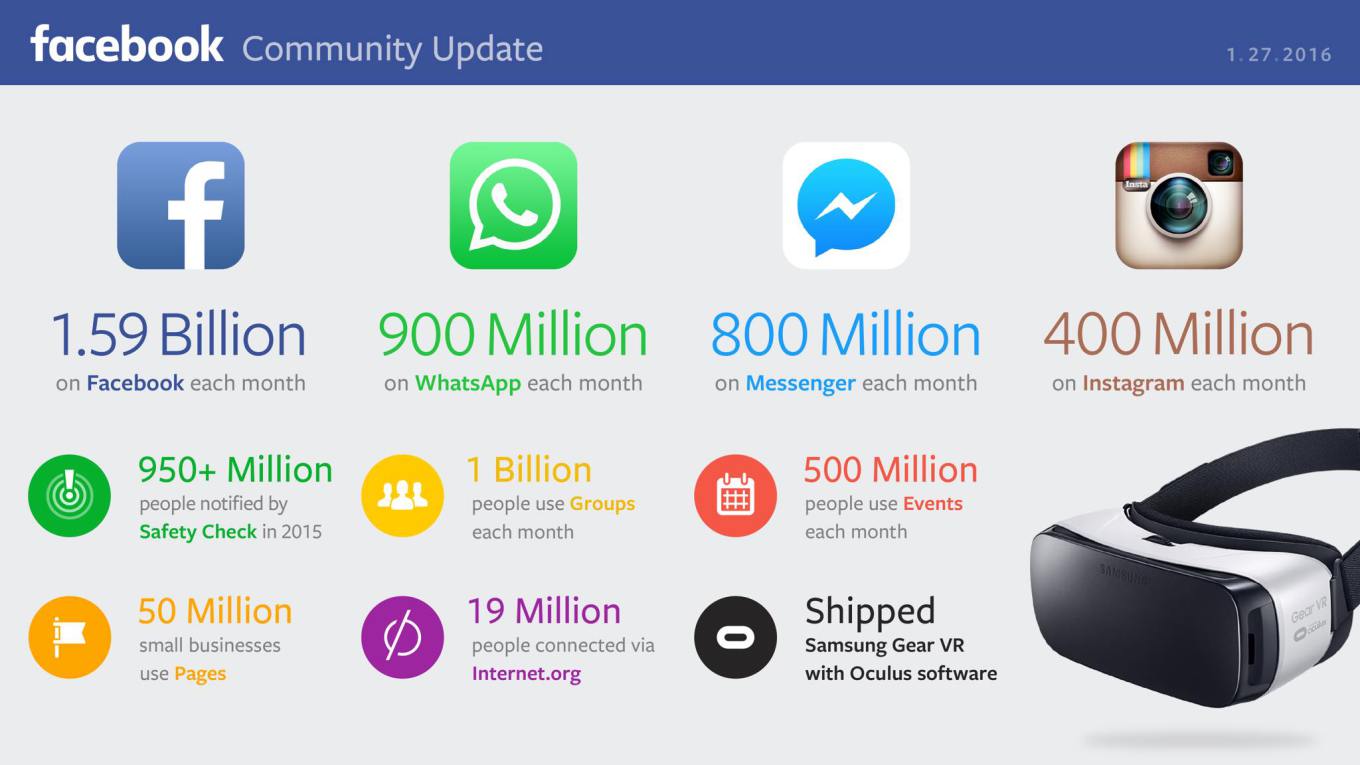
90) 1.7 billion people use WhatsApp and Messenger combined
During its Q4 2016 earnings report, Facebook revealed that 900 million people are using WhatsApp and 800 million people are using Messenger every month.
91) There are millions of fake Facebook accounts
According to CNET, in 2012, Facebook estimated that 8.7 percent or 83.09 million of its user accounts were fake. However, there’s no updated number on this.
Facebook’s user base has almost doubled throughout 2012-2017, but it has also taken specific measures to fight the fake accounts.
92) Facebook adds 500,000 new users every day
Facebook ad stats from 2015 showed that every second, 6 new Facebook profiles were created. According to Social Media Today, this means that every day, half a million Facebook accounts were created.
93) 75% of male and 83% of female Internet users are on Facebook
According to a 2016 report by Pew Research Centre, 75% of male and 83% of female Internet users are on Facebook. That’s a large potential target audience that you can reach.
77% of 14- to 17-year-olds report using the social media platform. At the same time, only 23% of teen girls used Tumblr and 33% of American teens used Twitter.
94) 71% of teenagers have a Facebook account
According to a 2015 survey by Pew Research Centre, 72% of teenage boys and 70% of teenage girls are Facebook users.
95) Half of all adult Facebook users have more than 200 friends
The average (mean) number of Facebook friends in 2013 was 338, and the median number of friends 200, Pew Research Centre’s reports show.
If you’re able to share content that’s both relevant and interesting to your target audience, chances are they’ll give it a like or share, making your Facebook post also appear in their friends’ newsfeeds.
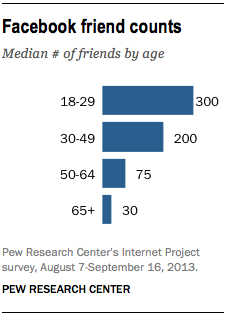
96) The average Facebook user has 155 friends
Telegraph reported that female users tend to have more Facebook friends on average than men: 166 compared to 145.
97) The main reason for joining Facebook is engaging with friends
When asked for the main reason why they’re using Facebook, most people (47%) named seeing photos and videos posted by the people in their network, according to Pew Research Centre.
This reason was followed by “Being able to share something with many people at one time“ (46%), “Being entertained by funny things people share or post” (39%), and “Receiving updates and comments from the people in your network” (39%).

98) The most annoying thing about Facebook is...
When asked what they dislike most about Facebook in a survey by Pew Research Centre, 57% of respondents answered “People posting pictures of your children without permission.”
Other popular answers included “People posting things about you or pictures of you without your permission” (36%) and “People sharing too much information about themselves” (36%).
Be careful not to boast too much about your brand and create value for your Facebook audience.
99) Half of non-Facebook users live with someone using it
According to Pew Research Centre, around 50% of Internet users who do not use Facebook themselves live with someone who does, making it possible to reach a larger audience via their family members.
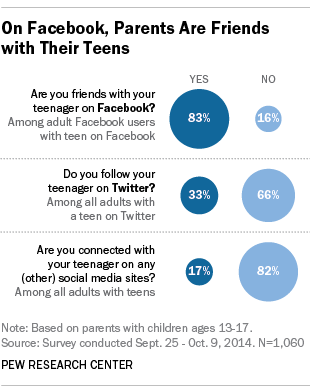
100) 83% of parents are Facebook friends with their children
Among Facebook users, the vast majority of parents (83%) say they’re “Facebook friends” with their teenagers while 17% of Twitter users follow their children on the platform, Pew Research Centre’s reports show.
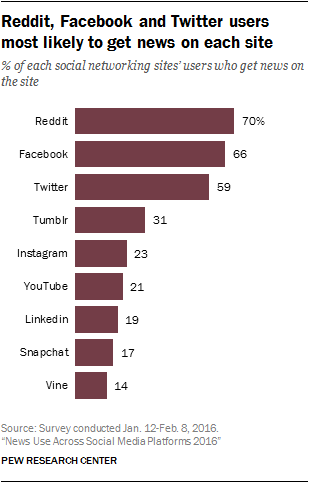
101) 62% of U.S. adults get their news from social media
According to a 2016 Pew Research Centre report, two-thirds of Facebook’s user base read their news on the social platform, with 59% of Twitter users getting news on Twitter, and 70% of Reddit users doing the same with their respective platform.
102) 88% percent of millennials get news from Facebook
According to American Press Institute, Facebook as a news source is highly popular among millennials, with 88% of them reporting getting news from Facebook at least occasionally.
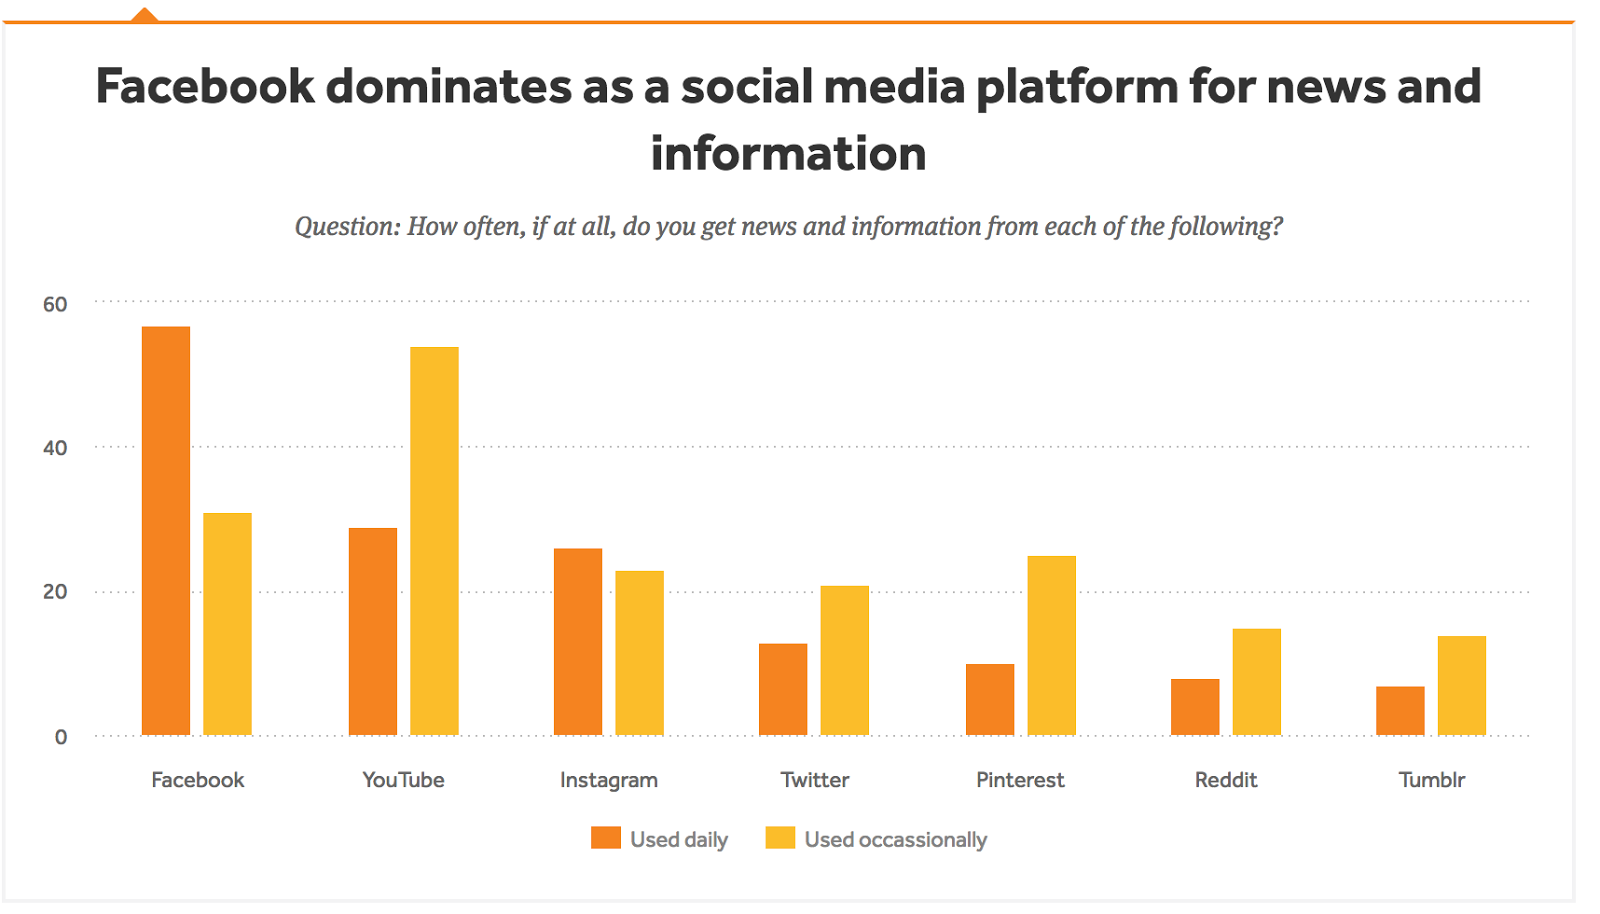
103) Facebook as a news channel is becoming increasingly popular
According to Pew Research Centre, while in 2013, only 47% of people reported Facebook as a news source, the number had increased to 66% by 2016.

TL;DR: Facebook Ad Stats Wrap Up
Too long; didn’t read?
In case you’re in a hurry, here are the top 10 Facebook ad stats to remember:
- Facebook is the most used social media platform among all age groups with 64% of them using Facebook.
- Facebook has 1.94 billion monthly active users.
- Over 70% of Facebook users visit the platform daily.
- 74% of Facebook users also use it for professional purposes.
- Facebook is the preferred social network for 62% of marketers.
- 94% of social marketers use Facebook’s platform.
- Branded Facebook page posts organically reach only 2% of your fans.
- Over 5 million business use Facebook for advertising.
- The average click-through rate (CTR) for Facebook ads is 0.90%.
- The average CPC for Facebook ads is $0.35.
You’ve still got time to catch the Facebook ads train.
Get started with Facebook advertising by reading our Facebook Ads Manager guide and check out the TOP 32 Facebook ad examples to learn from the best.