


From “FaceMash” to the Metaverse, Mark Zuckerberg has guided Facebook through many chapters over the past 17 years, yet it has remained as one of the world’s top social media platforms.
Facebook remains the only social media app used by over half of the world’s social networking population, reaching 59% in 2020. As of September 2021, Facebook has 2.91 billion monthly active users, a 6% increase over the past year that reflects its global reach.
Facebook’s relevance and resiliency throughout the COVID-19 pandemic are reflected not just in its usage rates, but in Facebook ad budgets as well, as the number of advertisers using Facebook has more than doubled in the last 18 months.
If Facebook advertising is not part of your social media marketing strategy already, it should be. Facebook remains a place where a significant amount of people socialize, get news, and spend their time, meaning that Facebook ads can help you to reach the right people online and yield revenue for your business.
Let’s explore some key Facebook Ads statistics you’ll want to keep in mind as you invest in advertising on the platform.
Get brand new Facebook ad strategies straight to your inbox every week. 23,739 people already are!
General Facebook Ads statistics
- Facebook is the world’s third-most visited website. Only beaten by Google and YouTube, Facebook is one of the most visited websites in the world. This reinforces the idea that if people are spending time online, there’s a good chance they’re on Facebook (Hootsuite, 2020).
- Facebook is the third-most downloaded mobile app in the U.S. Third to TikTok and Youtube, Facebook is still rapidly downloaded by users in the U.S. onto their mobile devices. Facebook Messenger is also ranked as the sixth most-downloaded app in the U.S. Therefore, as an advertiser, you should be conscious of how people access Facebook and ultimately view your ads, as there’s a good chance it's via mobile (App Annie, 2021 Q2).
- Facebook has 1.93 daily active users. While not everyone logs into Facebook every day, a very significant portion of the global population does (Facebook, 2021 Q3).
Facebook usage statistics
- 69% of U.S. adults use Facebook. Though Facebook’s growth has plateaued over the past 5 years, it still remains one of the most widely used social networks in the United States (only second to YouTube). This is significant since in lieu of public controversies and a more saturated social media market, Facebook has remained comfortably on top in the U.S. (Pew Research Center, 2021).
- 88% of people access Facebook on a mobile device. Optimizing your Facebook ads for mobile view as well as desktop view, or running mobile-only ads is your best bet to effectively reach the average Facebook user. A focus on mobile advertising will up your Facebook marketing game and help your ads reach your target audience (Hootsuite).
- Over 85% of Facebook’s daily active users are outside of the US and Canada. This statistic reflects the rising global prominence of Facebook, and the power it allows advertisers to reach new markets around the world (Fast Company, 2021).
- Facebook users are 1.5X more likely to watch a video on their phone. As users rely on mobile devices for communication and entertainment, mobile is a main entry point to how users interact on Facebook. This statistic shows the need for advertisers to take a mobile-first approach, as well as invest in eye-catching creative like videos and high-quality images (Facebook, 2017).
Facebook demographics statistics
- The age gaps between Facebook users in the U.S. are narrower than on other social media sites. Despite what your grandparents’ active re-sharing of Facebook memes will have you believe, Facebook is not just for boomers at this point. While other social networking sites have a significant drop-off in usage between certain age groups, age gaps between the youngest and oldest Americans using Facebook are narrower in comparison. Seventy percent of adults aged 18 to 29 say they use the platform, which is not far from those aged 30 to 49 (77%) or aged 50 to 64 (73%). Half of people 65 and older say that they use Facebook, which makes it the site for social media users in this age cohort alongside YouTube (Pew Research Center, 2021).
- 42% of U.S. teens use Facebook. While Facebook policy holds restrictions on advertisers targeting people under 18 globally, American teens still use Facebook to a significant degree in the U.S. So, while you may not be able to run detailed targeting on teens, be conscious of how they might interact with and come across your Facebook ads (Pipersandler, 2020).
- 56.8% male of Facebook users are male, compared to 43.2% female. While at this point Facebook only reports the gender of users who are male and female, the amount of male-identifying users on Facebook significantly edges over female-identifying users. (Statista, 2021).
- With over 320 million users, India is home to the most Facebook users in the world. While Facebook originated and retains prominence in the U.S., this statistic reinforces the increasing prominence of Facebook in global markets. Tap into the power of Facebook advertising to reach new markets in various regions of the world (Statista, 2021).
Facebook ads statistics and benchmarks
- There are 8 million active advertisers across all Facebook (Meta) platforms. From Facebook to Instagram to WhatsApp, advertisers are live and active on all Meta platforms (Facebook, 2020).
- Facebook’s ad revenue worldwide was $84.2 billion in 2020. Facebook recorded 25% growth over the year 2020, which was a signal that the COVID-19 pandemic shifted many retailers and small businesses online, resulting in an increase in Facebook ad spend (Statista, 2021).
- Facebook’s total Q3 2021 advertising revenue was $28.2 billion. In 2021, Facebook ad revenue is still going strong, retaining similar rates as at the height of the COVID-19 pandemic in 2020. This signifies that Facebook marketing and advertising are here to stay (Statista, 2021).
- Conversions are the main campaign objective for about 27% of Facebook ads. It’s no doubt that conversions are a top campaign objective chosen for Facebook ad campaigns, as they drive the most revenue for businesses. While 26.94% of ads are focused on conversions, 24.19% of ads are aiming for post engagement, and 22.64% are optimized for link clicks. While these campaign objectives will help you yield tangible results, don’t ignore other objectives that serve the other parts of the sales funnel, like brand awareness or event responses (Socialinsider, 2020).
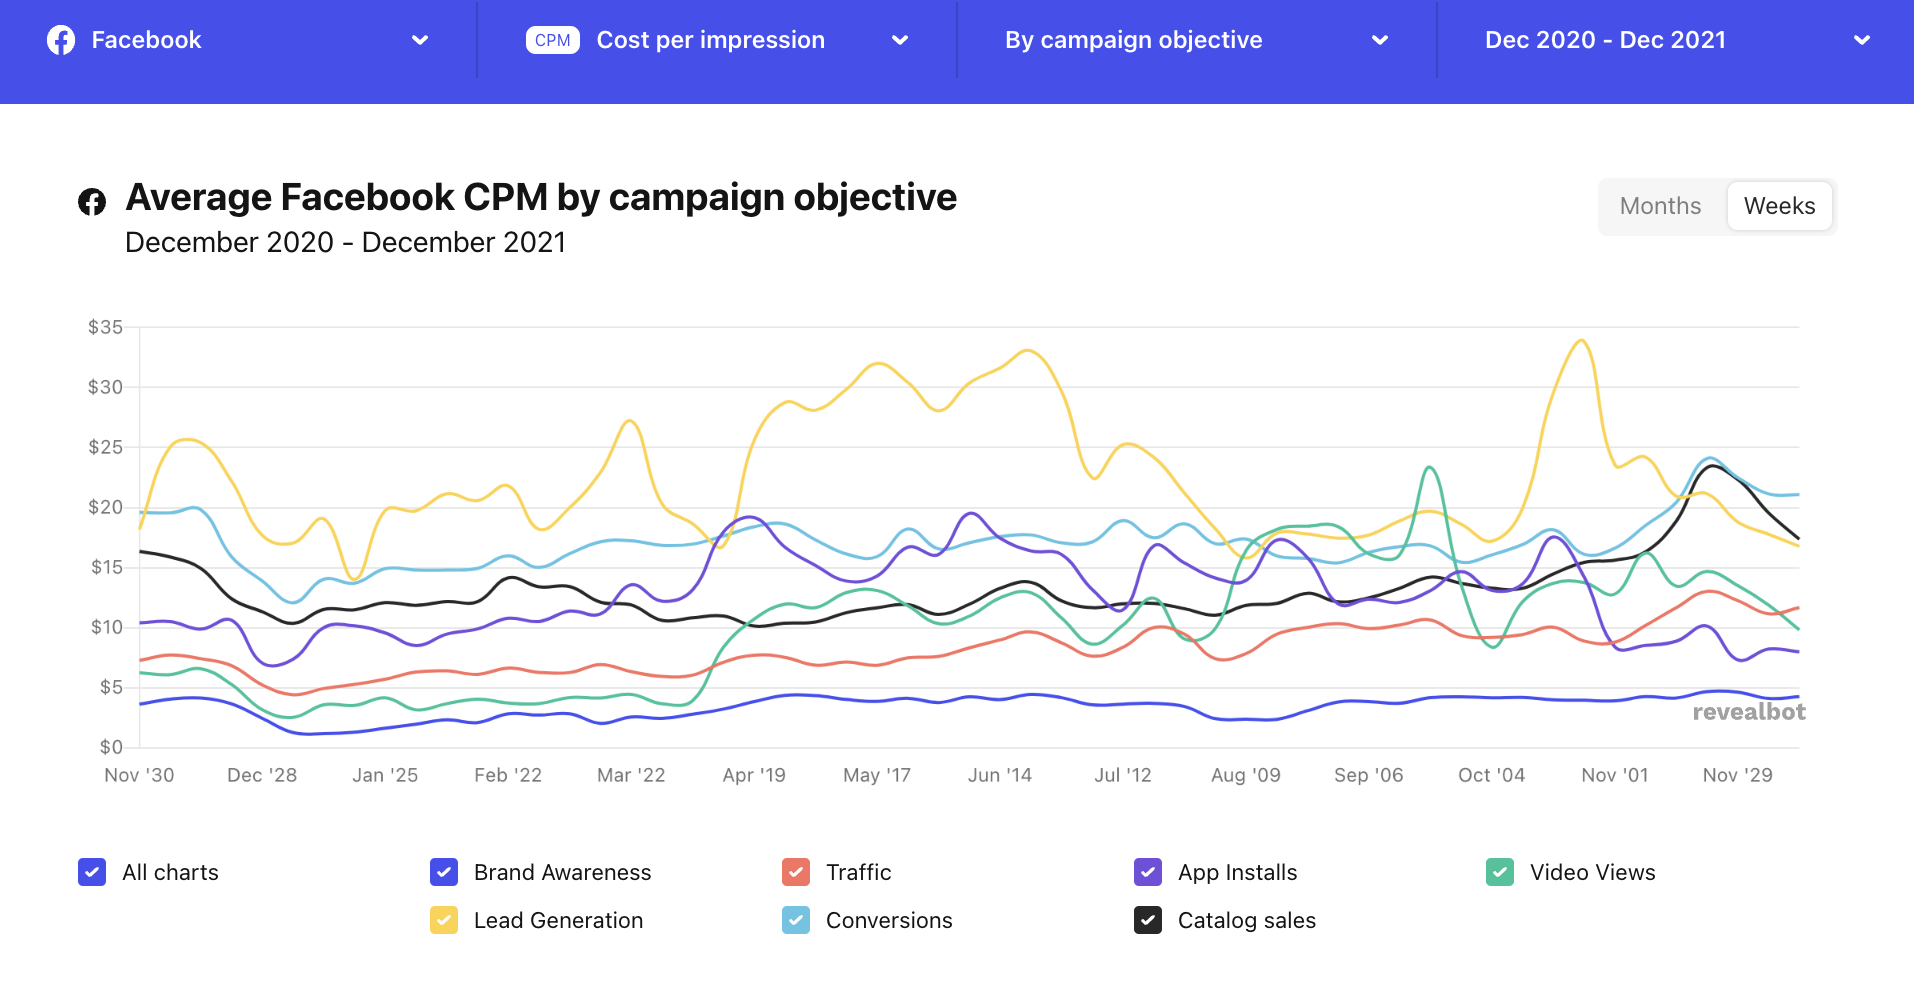
- Across all industries, the average CPM on Facebook is $16.12. The cost per thousand impressions (CPM) across all industries stands at $16.12 as of December 2021. However, this figure varies based on the campaign objective selected (Revealbot, 2021).
- The average cost per click (CPC) is around $0.43. CPC rates have remained relatively stable as CPM rates have fluctuated within the past few years ( Socialinsider, 2020).
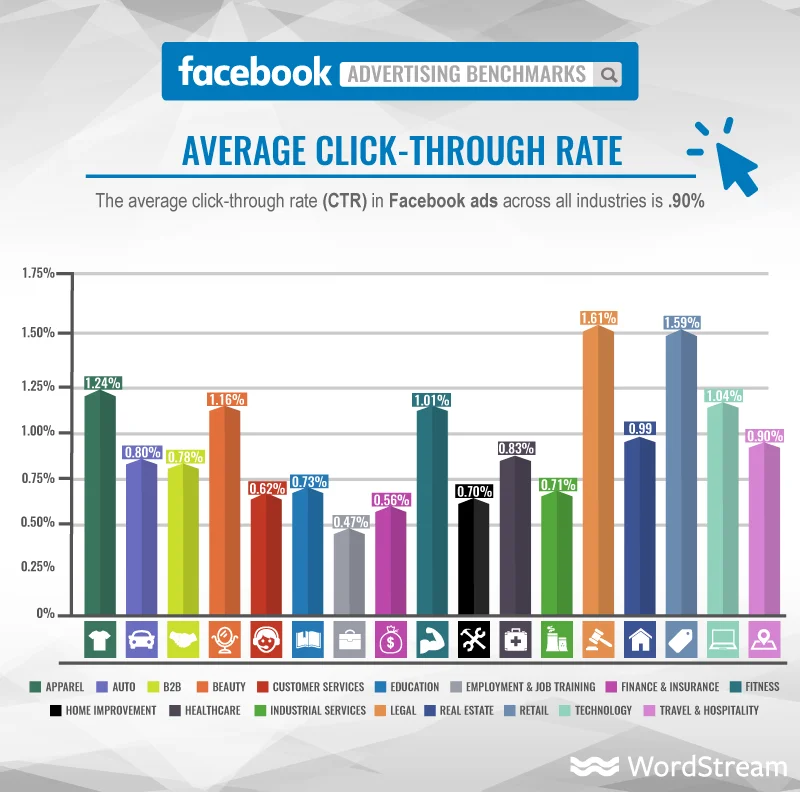
- Across all industries, the average click-through rate (CTR) for Facebook ads is 0.90%. While legal and job training sectors have some of the lowest overall CTRs, the retail, beauty, apparel, and fitness industries pull in strong CTRs. This is because the latter industries tend to feature models and high-quality images in their ads that are eye-catching and creative. The point here is, whatever industry you’re in, invest in high-quality visuals to show in your ads (WordStream, 2021).
- $18.68 is the average cost per action (CPA) for Facebook ads across all industries. Now more than ever, it will cost you to reach your audience on Facebook and get them to take a specific action based on your ad. While CPA rates vary by industry, consider the value of a consumer’s action to your overall growth and revenue goals (WordStream, 2021).
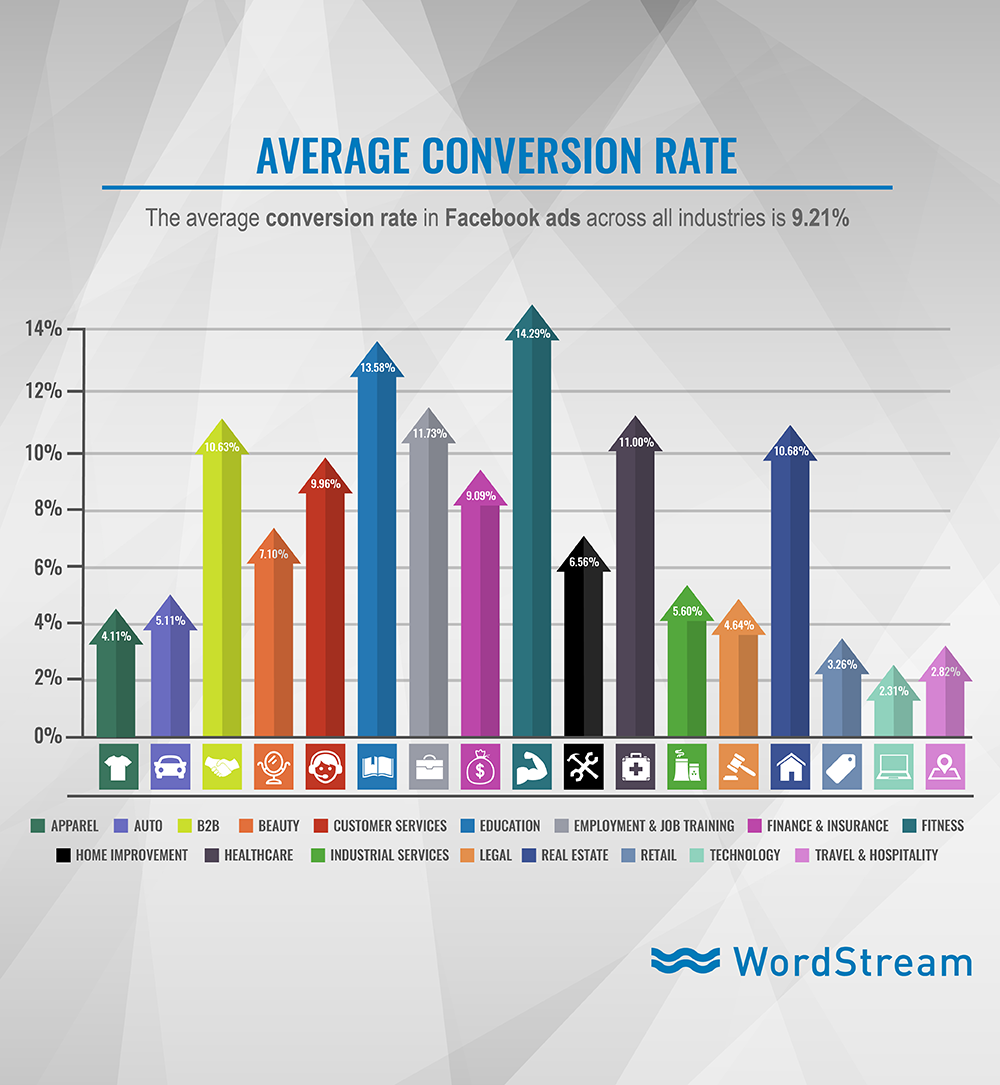
- The average conversion rate on Facebook ads is 9.21% across all industries. Lead conversion ads contributed to a major boost in conversion rates, as industries that tend to use them (such as fitness, education, and healthcare) help them yield higher success (WordStream, 2021).
Facebook video statistics
- 15% of all Facebook content is video content. From Facebook Live videos to Facebook Watch to native video content, video content totaled to 15% of all content on Facebook. Up to 71% of video content was published by Facebook Pages with over 100,000 fans in 2020. This shows that video is a growing and significant part of the Facebook user experience, that video marketing is an area of opportunity for advertisers (Socialinsider, 2021).
- Facebook video posts have an average engagement rate of 0.26%. Compared to the average overall engagement rate of 0.18%, video posts have a significantly higher margin of engagement with Facebook users. This reinforces our belief that you should include video content in your Facebook marketing strategy (Hootsuite, 2020).
- Facebook Live viewership is on the rise, increasing by 50% in 2020. The pandemic has been a driving force in the increase of Facebook Live viewership, as more in-person events have shifted online, including fitness classes, concerts and live discussions. In addition to Facebook Stories, Facebook Live is a prime spot for you to consider placing video ads that will reach a lot of people (Facebook, 2020).
- Users aged 18-24 have 75% less of an attention span for video ads than users over 65. Younger generations are increasingly impatient when it comes to video ads, which makes it necessary for digital advertisers to prioritize eye-catching visuals in the first few seconds of their videos ads. If your video ad content doesn’t engage viewers right away, it won’t be worth investing in, especially if you’re attempting to reach younger audiences (Facebook, 2019).
25. The average click-through rate (CTR) for Facebook ads is 0.90%. Here’s a list of the average click-through rates in specific industries, shared by Wordstream:
- Apparel: 1.24%
- Retail: 1.59%
- B2B: 0.78%
- Technology:1.04%
- Finance & Insurance: 0.56%
Read our guide to learn how to increase your Facebook ads CTR.
26. The average conversion rate for Facebook ads is 9.21%. The same report by Wordstream revealed that the avg. conversion rate is highest in the fitness industry (14.29%) and education (13.58%). It’s the lowest in the technology (2.31%) sector.
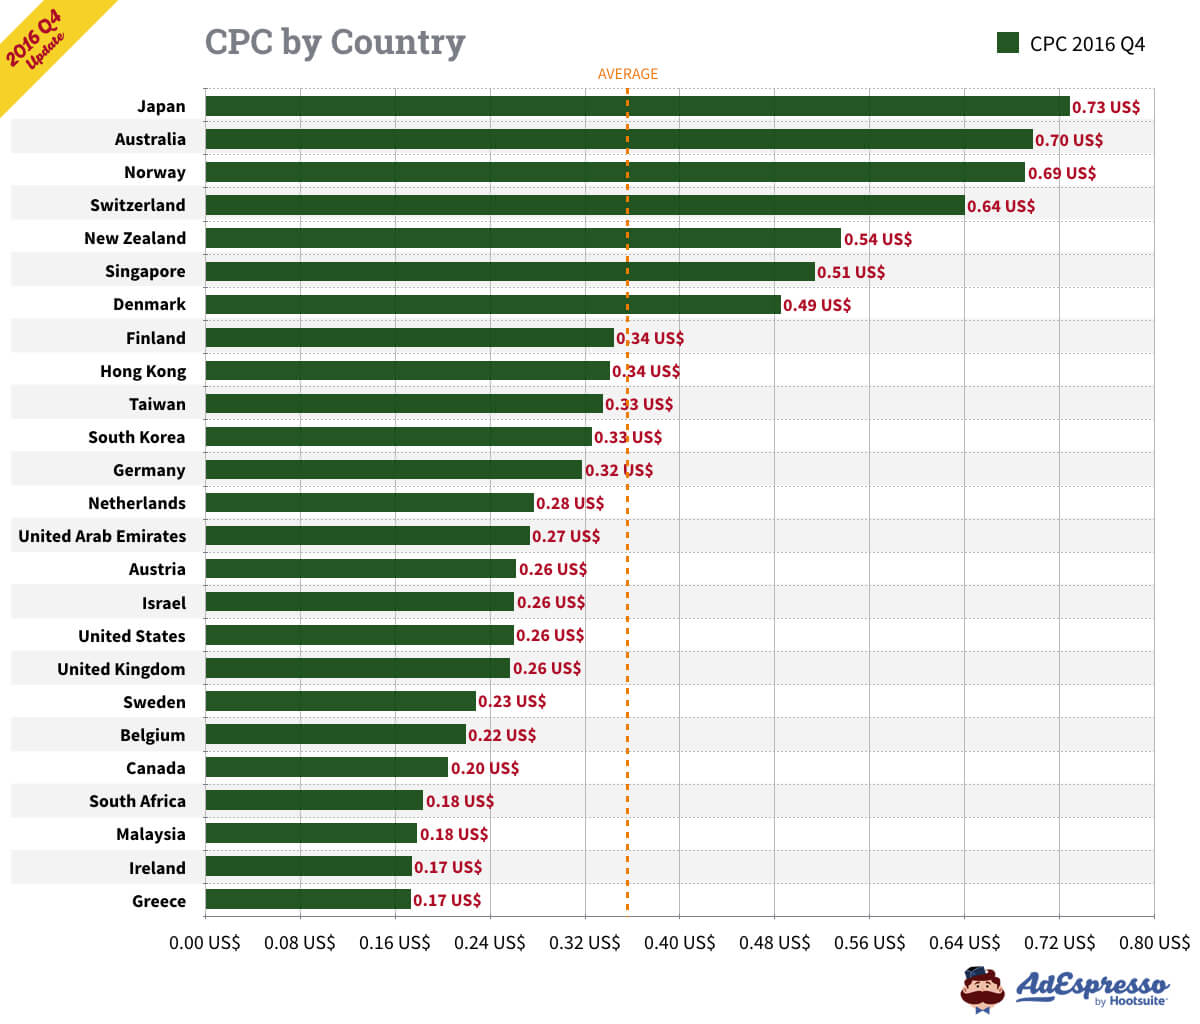
54) The average CPC for Facebook ads is $0.35
When analyzing the Q4 2016 Facebook ad stats, AdEspresso found that the average cost-per-click of Facebook ads is $0.35. In the U.S., the avg. CPC is $0.26.
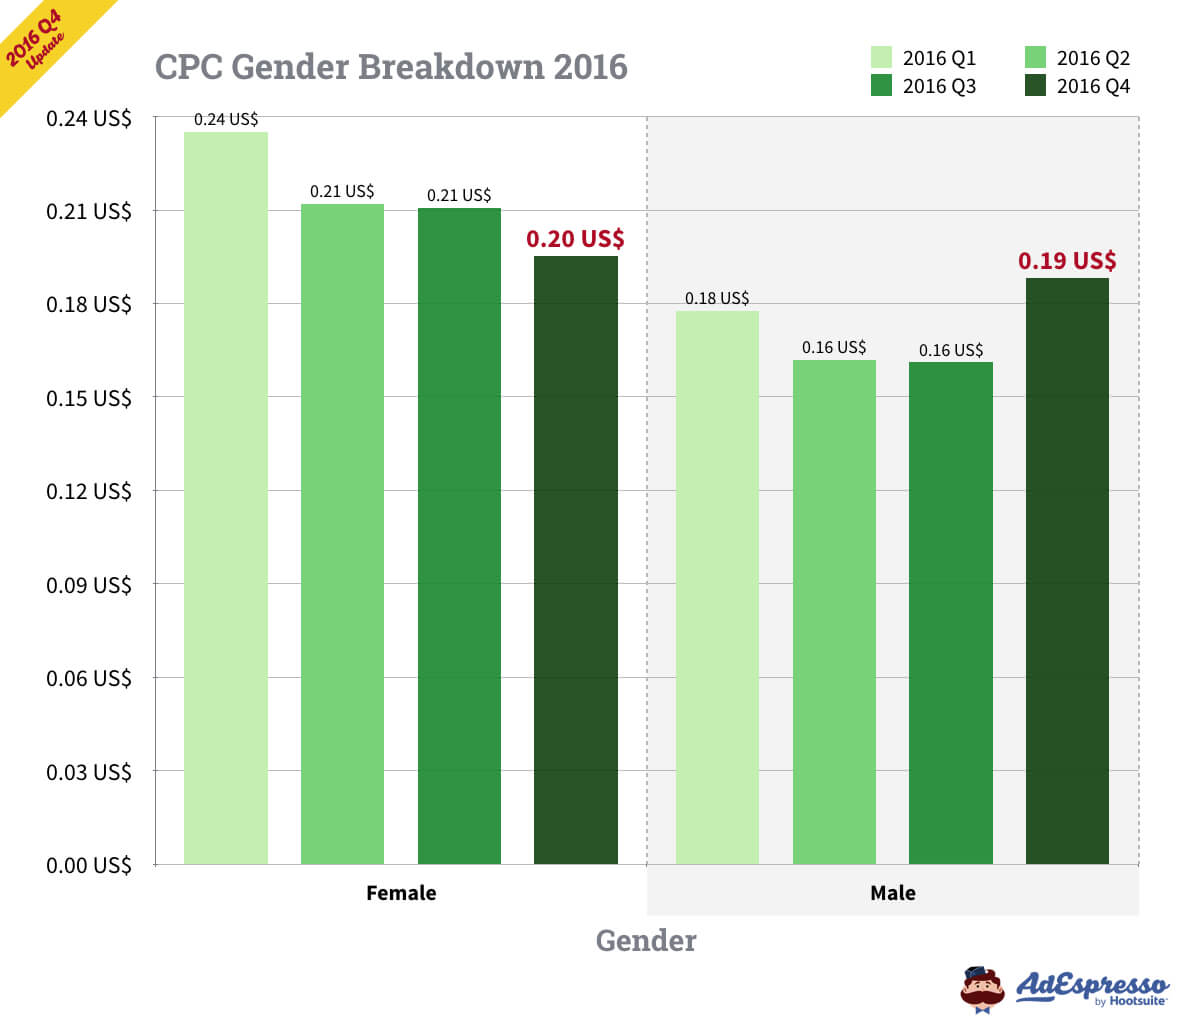
55) The average CPC is higher for female audiences
When compared by gender, the CPC tends to be higher when advertising to female audiences, according to AdEspresso’s data. In Q4 2016, the avg. CPC for female audiences was $0.24 and $0.19 for male target groups.
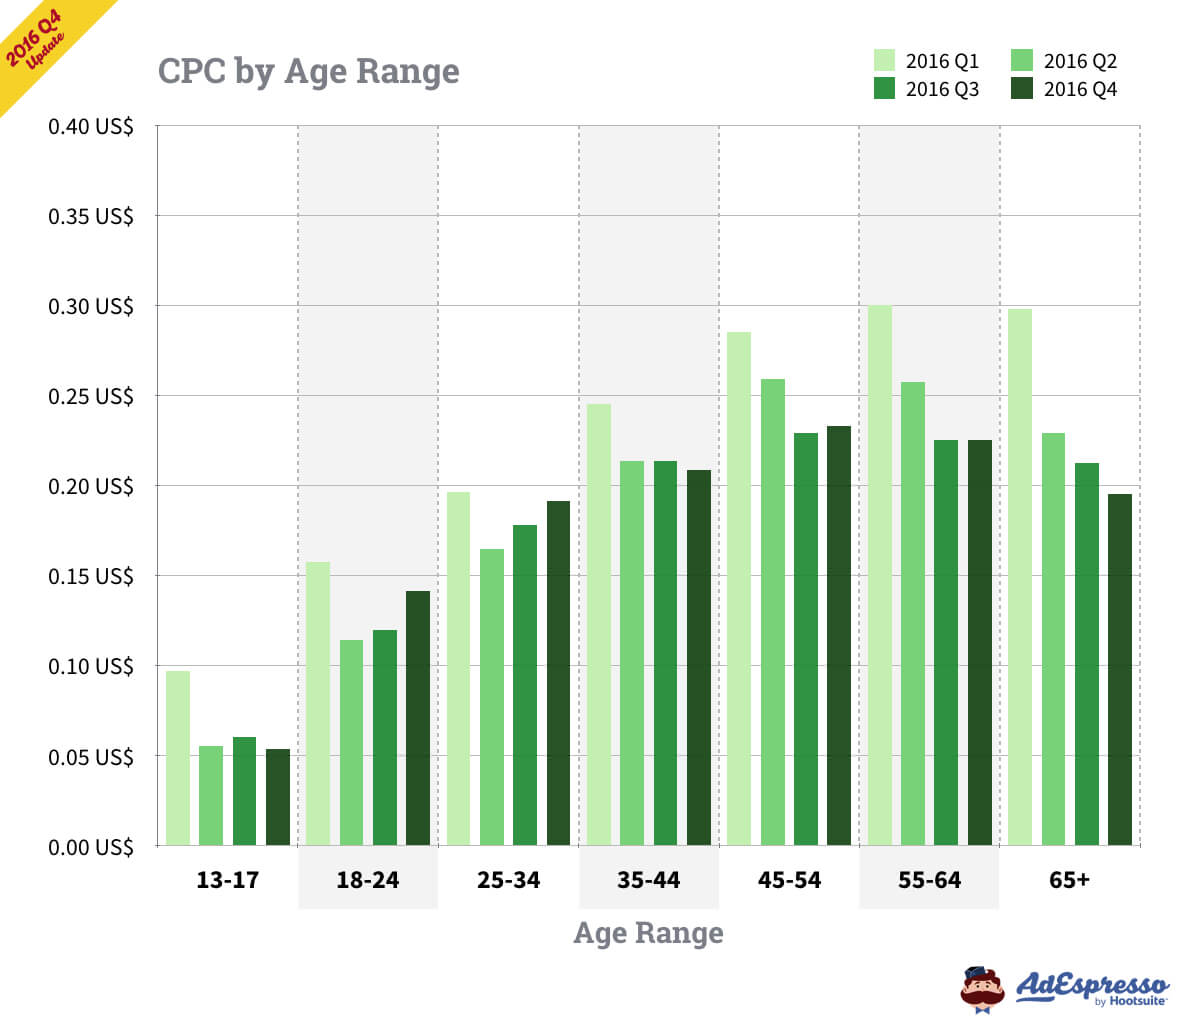
56) It’s more expensive to advertise to older audiences
AdEspresso’s research also showed that it’s slightly more expensive to be advertising to audiences aged between 45-65+ years, compared to say people aged 18-44 years.
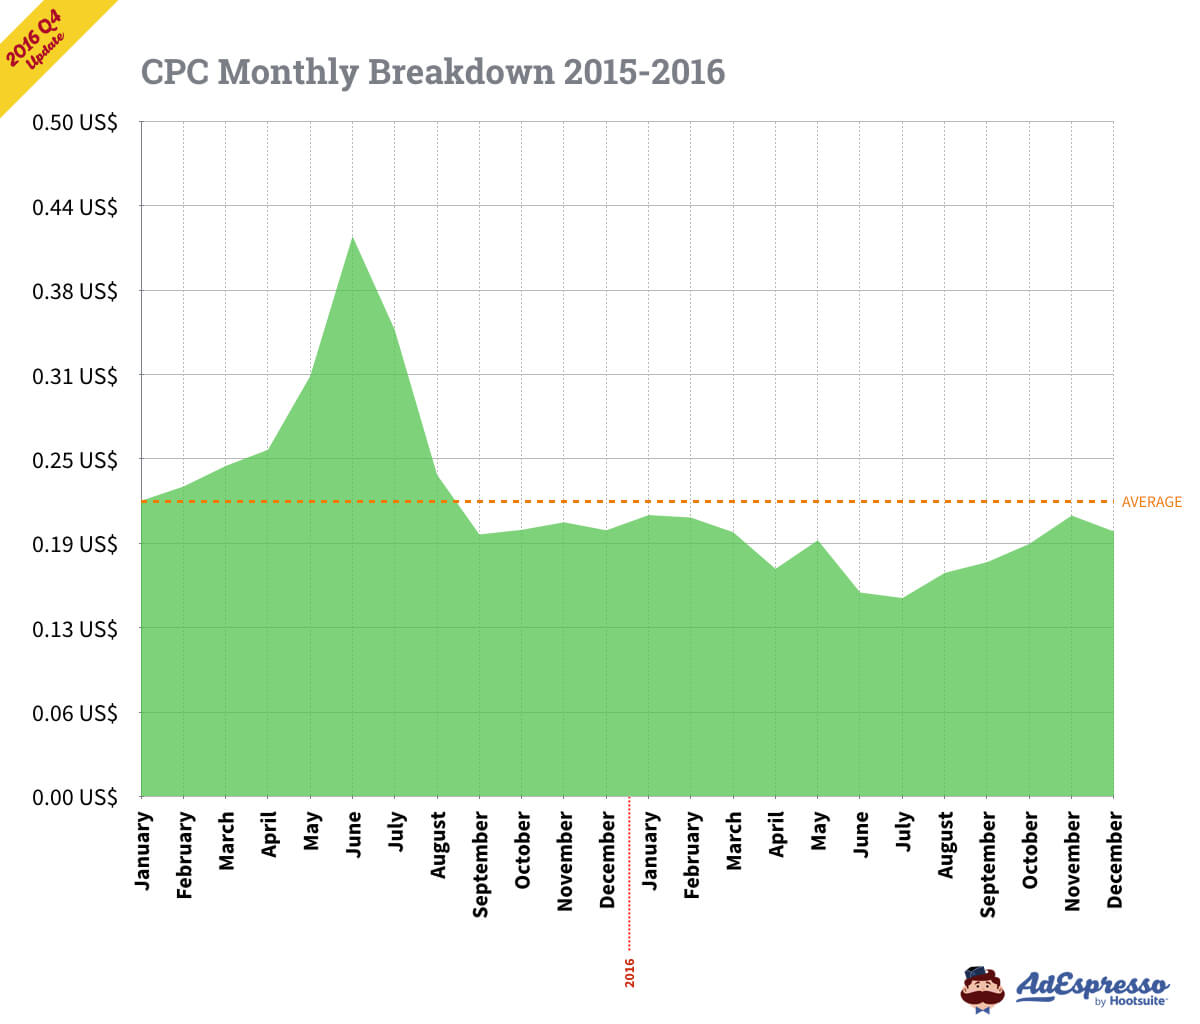
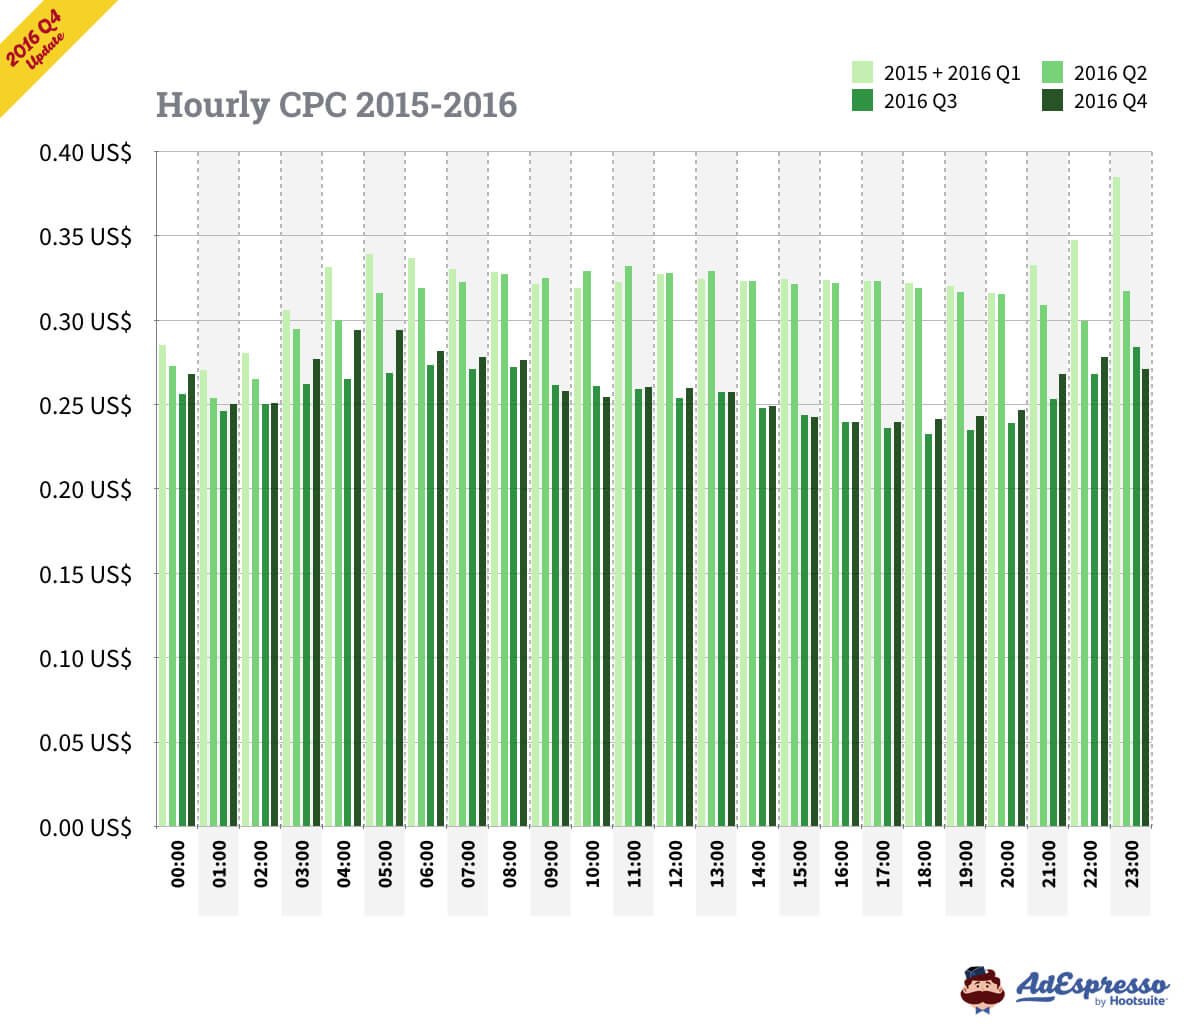
57) The avg. Facebook ads CPC is lower in summer months
According to AdEspresso’s research, the average Facebook ads CPC in 2016 was highest in October and November. The cheapest months for Facebook advertising in 2016 were June and July.
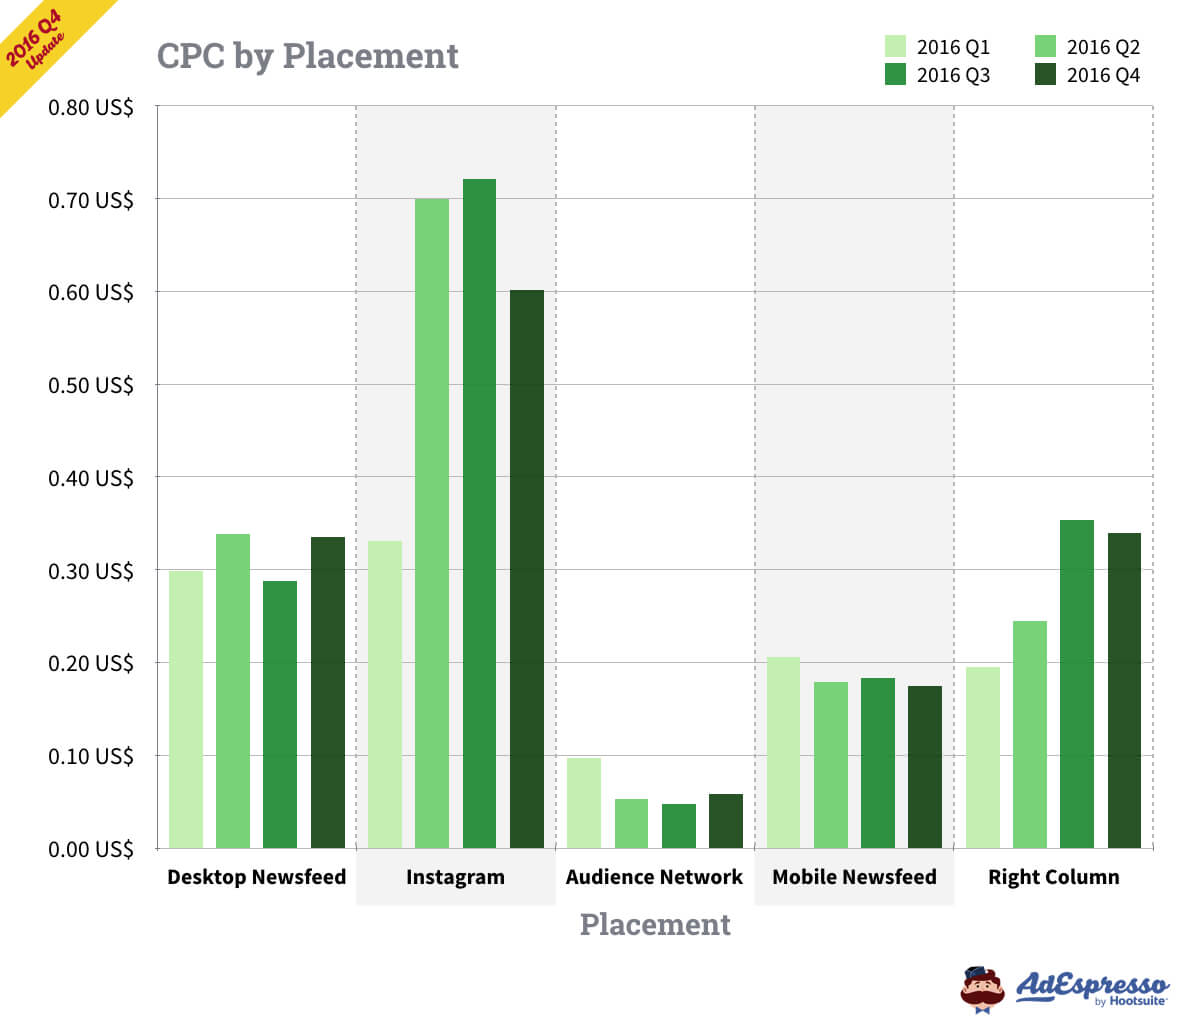
58) Right-hand column and Desktop ads have the highest CPC
In Q3 2016, the average cost-per-clicks across different Facebook ad placements were the following, as reported by AdEspresso:
- Desktop newsfeed – $0.32
- Mobile newsfeed – $0.19
- Instagram – $0.60
- Right-hand column – $0.32
- Audience network – $0.06
59) The most expensive day to advertise on Facebook is Friday
According to AdEspresso’s analysis of Facebook ad costs, the average cost-per-click of Facebook ads is at its highest on Fridays ($0.27), followed by Thursday ($0.25).
However, this is a general stat and the CPC might vary depending on your industry, audience, offer, and many other factors.
60) The cheapest time of day to advertise on Facebook is evening
Surprisingly, the cheapest time to advertise on Facebook is arguably the most popular one – the evening commute. AdEspresso’s research showed that the avg. CPC between 4p.m. and 8p.m. is around $0.23.
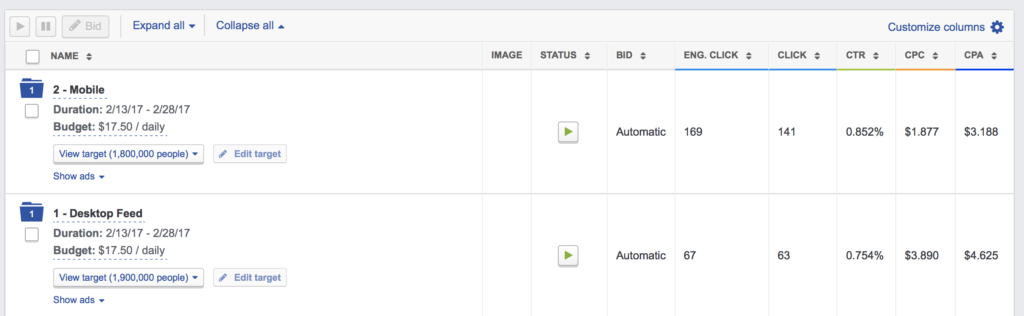
61) In one Facebook ad test, mobile outperformed desktop ads by 34%
AdEspresso ran a Facebook ads experiment where the Desktop ad placement (avg. CPA $4,625) had an over 34% higher cost-per-acquisition compared to Mobile ads (avg. CPA $3,188).
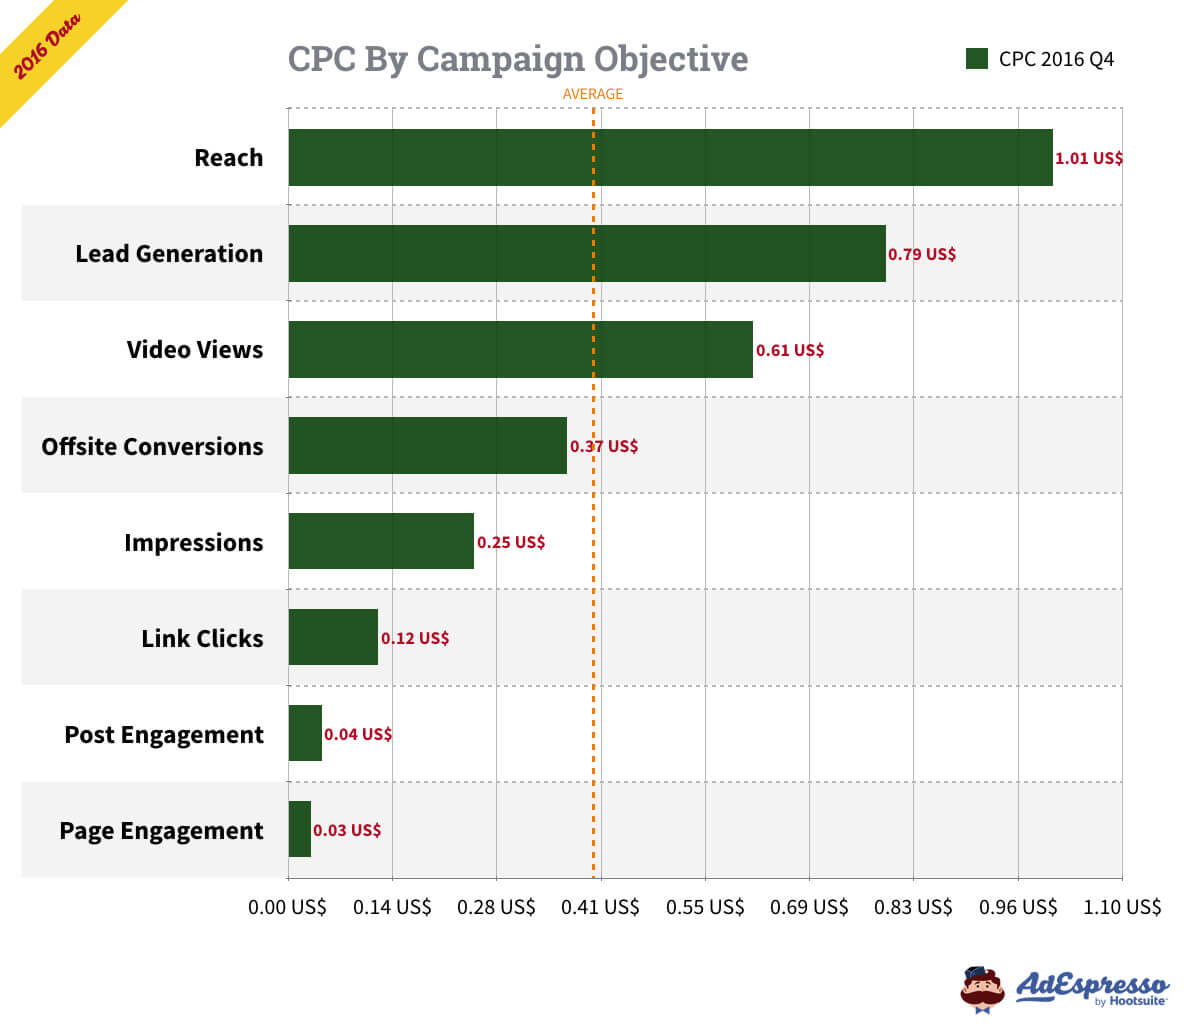
62) The CPC with Page Engagement campaign objective is $0.12
If your goal is to drive many clicks at a low cost, AdEspresso recommends that you use one of these campaign objectives:
- Page engagement – avg. CPC $0.03
- Post engagement – avg. CPC $0.04
- Link Clicks – avg. CPC $0.12
63) The average cost per action (CPA) for Facebook ads is $18.68
While the report by Wordstream fails to mention what exactly they mean by cost per action, we’re fairly sure they meant the cost per conversion or cost per acquisition.
According to the report, the average cost per action (CPA) for Facebook ads is $18.68. It’s around three times higher for the technology ($55.21) sector and a lot lower for education ($7.85).

64) The avg. cost per 1,000 ad impressions (CPM) is $7.19
AdEspresso analyzed thousands of Facebook ad campaigns and discovered that the average cost per 1,000 ad impressions (cost per mile) is $7.19, and $7.34 for ALL objectives.
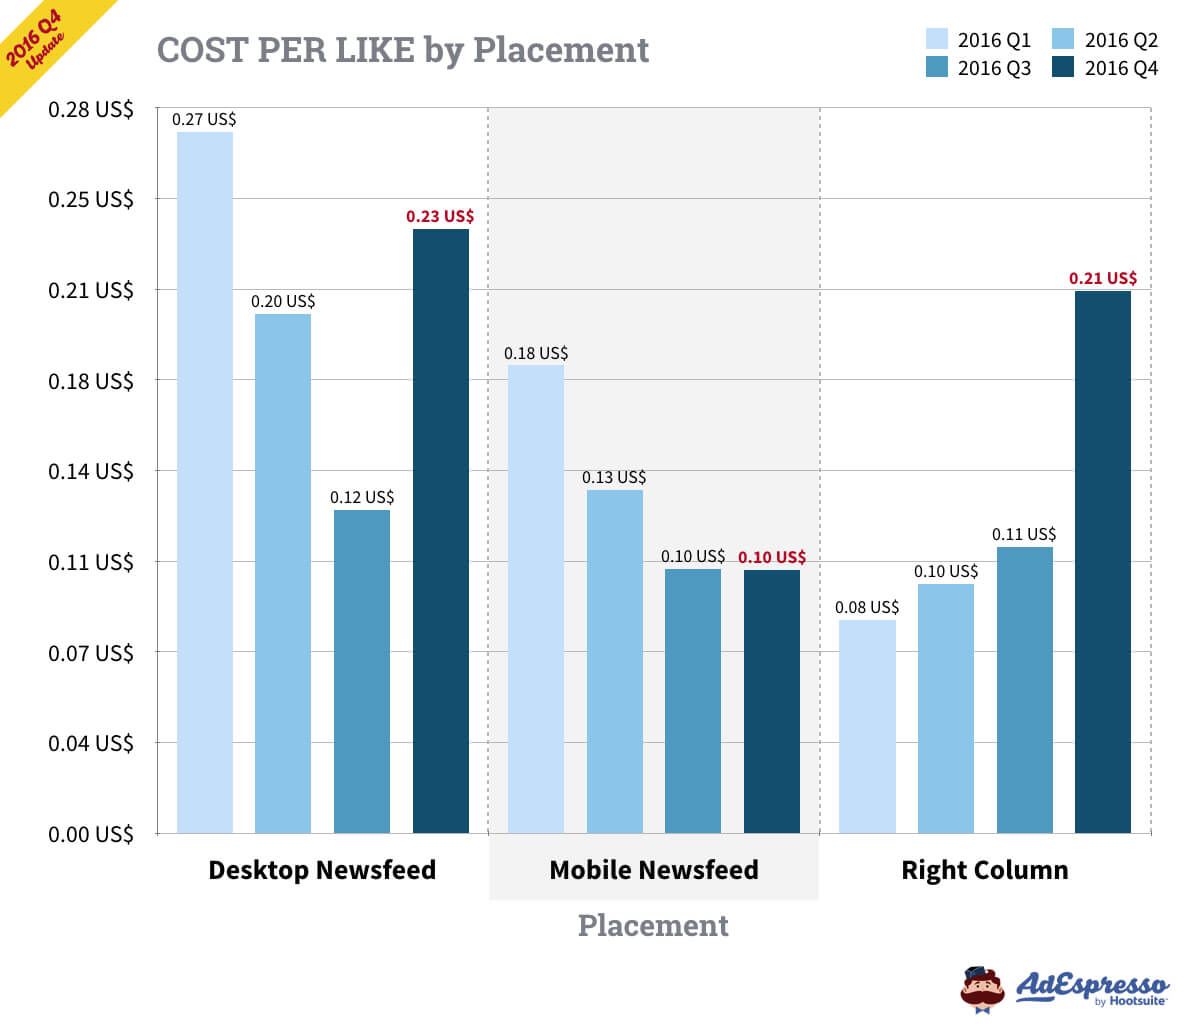
65) The average cost-per-like for Page Like campaigns is $0.26
AdEspresso’s research showed that for campaigns created with the Page Likes objective, the average cost-per-like was $0.26 in Q4 2016. It was even lower with Mobile newsfeed ad placement ($0.10).
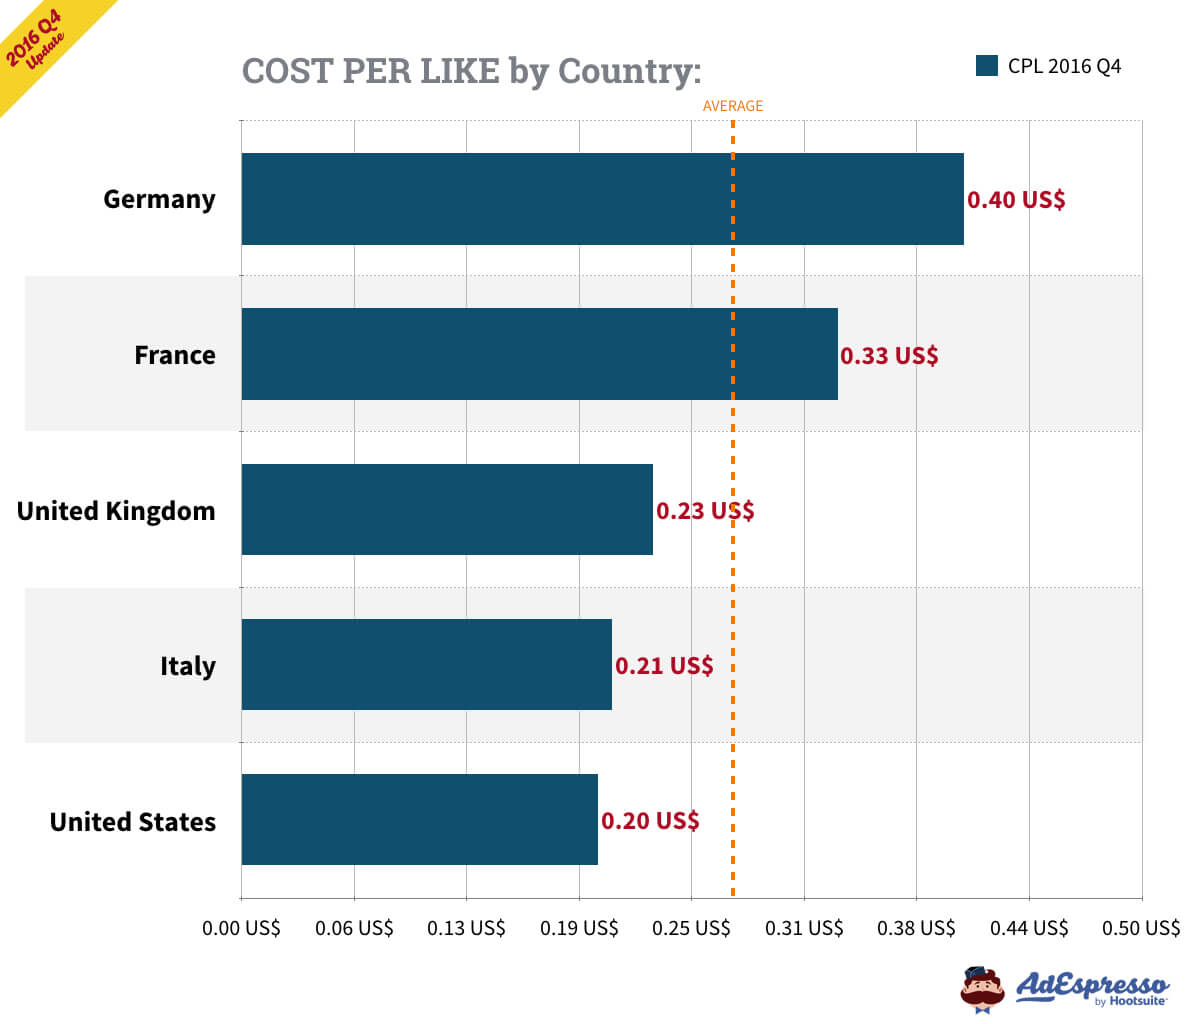
66) If you want more page likes, advertise on mobile
AdEspresso’s research also showed that the avg. cost-per-like is the lowest for mobile Facebook ads. In Q4 2016, the average cost-per-like for mobile placement was $0.10, compared to $0.23 for desktop and $0.21 for right-hand column.
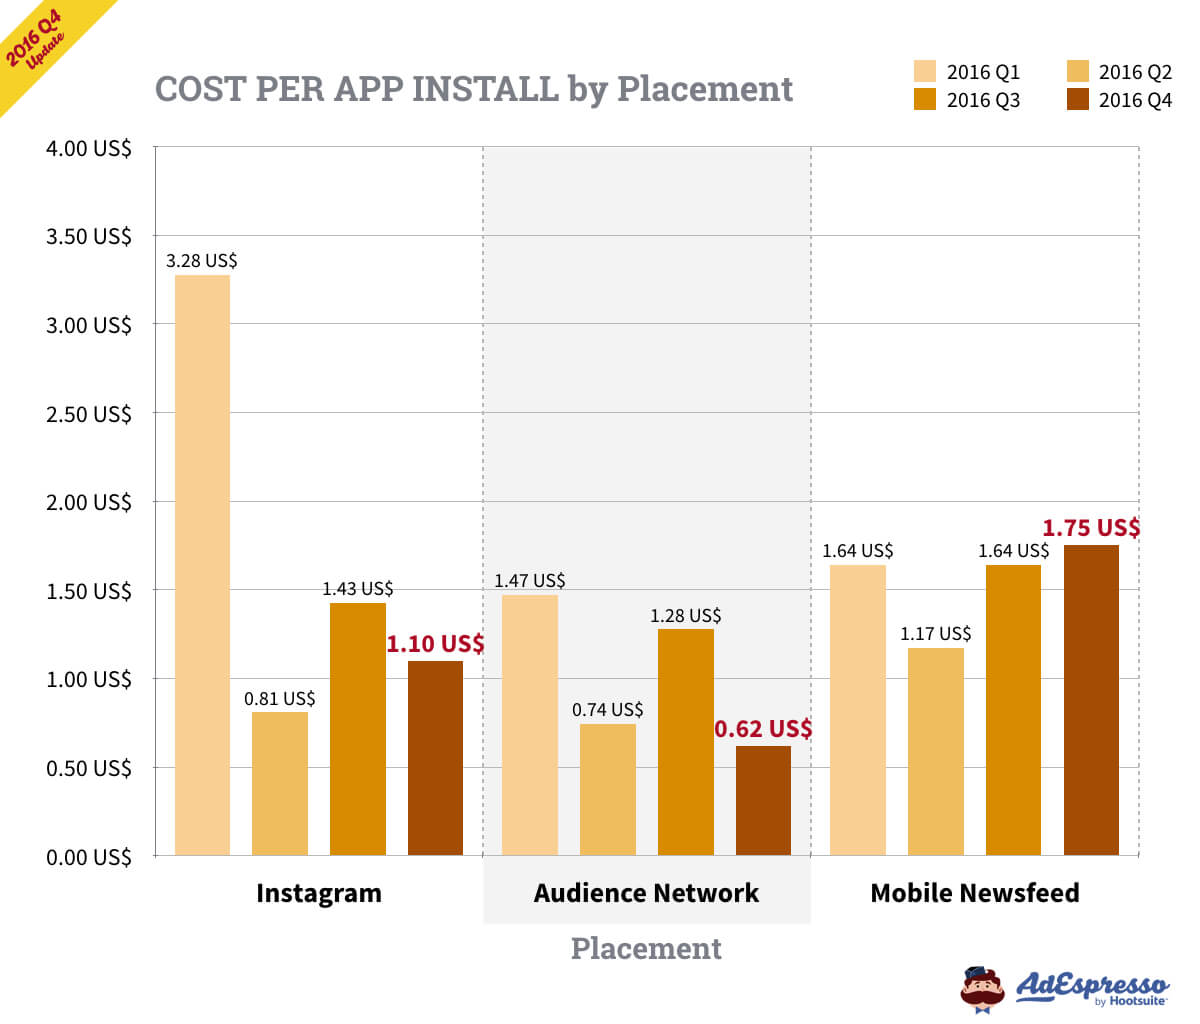
67) The average cost per app install for Facebook ads is around $1.70
According to AdEspresso’s research, the cost per app install is highest in the UK ($5.40), Germany ($3.18), and the U.S. ($2.28). The avg. cost per app install for Facebook ads is around $1.70.

68) The average cost per app install is lowest in Audience Network
While you may have guessed that it’s best to advertise your mobile app in Facebook’s mobile newsfeed, it’s not necessarily true. AdEspresso’s data shows that the cost per app install is lowest for the Audience Network ad placement ($0.62).
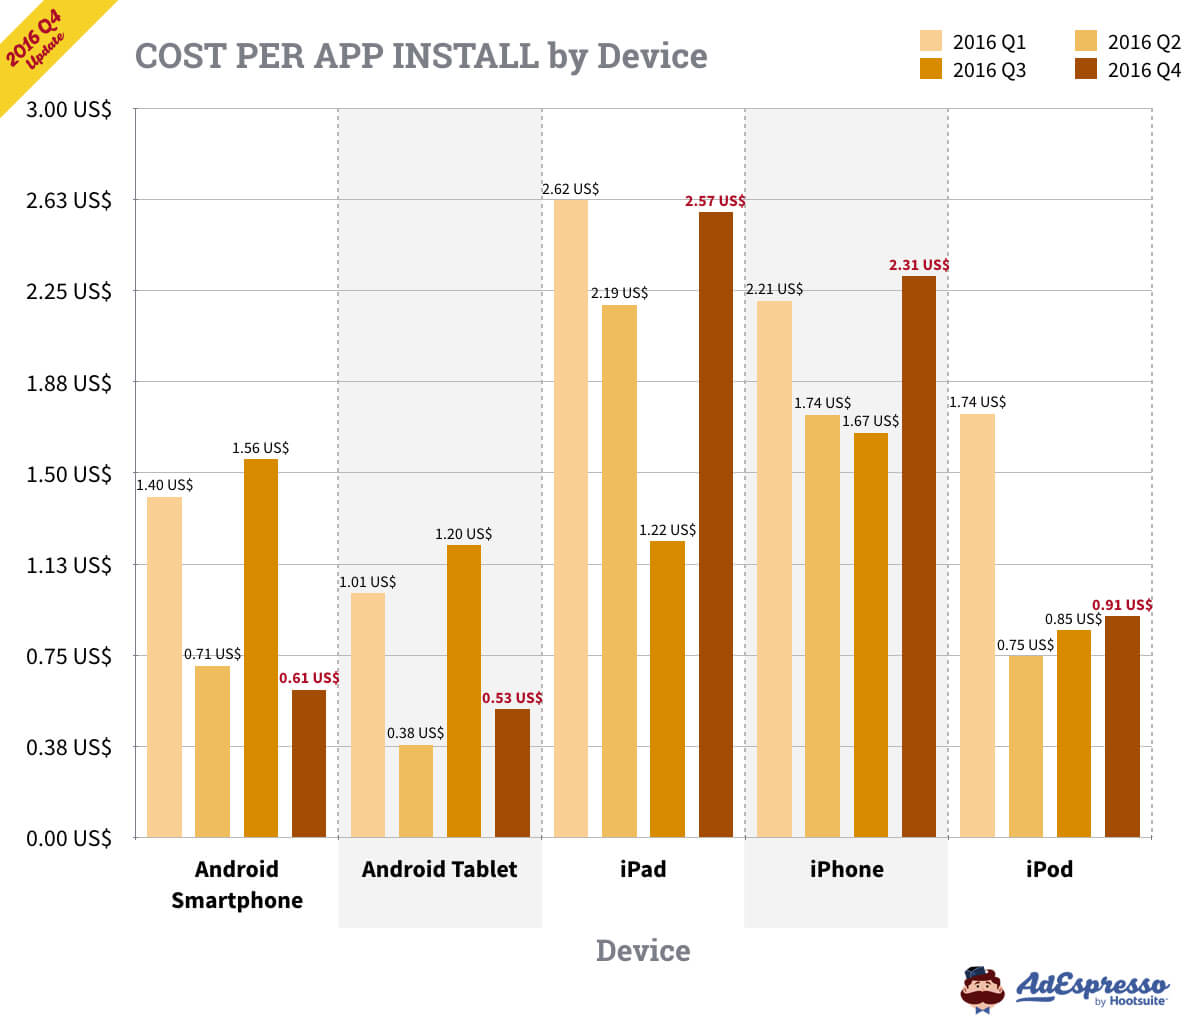
69) The avg. cost per app install is cheapest on Android devices
If you’re unsure which device users to target with your Facebook ads promoting a mobile app, test advertising to Android tablet and smartphone users. It’s sometimes three times more expensive to get iPad and iPhone users to download your mobile app, AdEspresso found.
70) 69% of Facebook ads link to a landing page
AdEspresso’s Facebook ad analysis revealed that 69% of all Facebook ads link to a landing page. 20% of ads link to a Facebook page and 11% to the company’s home page.
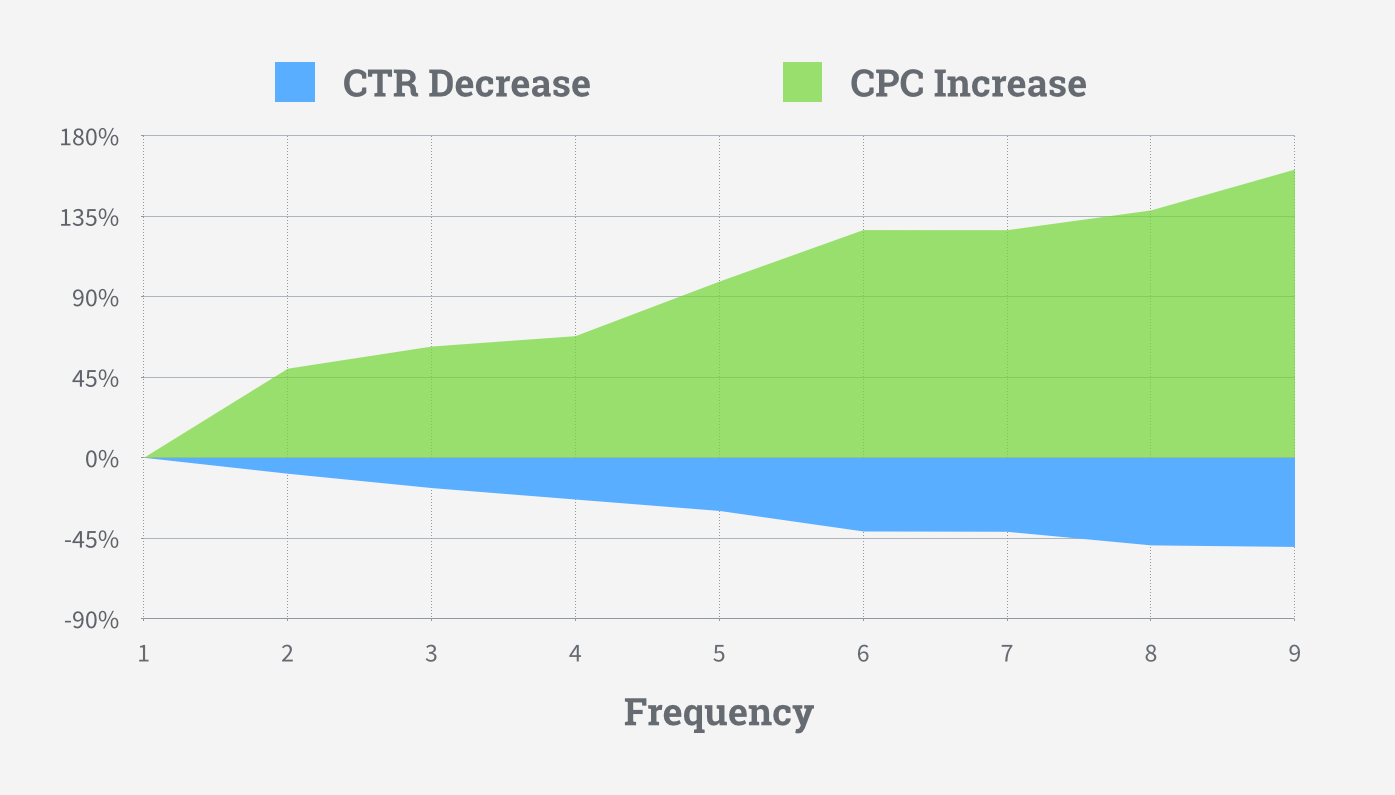
71) Your CPC increases by 49.82% when ad frequency reaches 2 points
Ad frequency is a Facebook ad metric showing how many times your target audience has seen your Facebook ads on average.
AdEspresso found that once your ad frequency reaches 2 points (people have seen your ad at least for two times), the average CPC increases by 49.82% and the CTR decreases by 8.91%.
72) 1% Lookalike Audience has a lower CPC than 10% Lookalike
AdEspresso ran a Facebook ads experiment, testing three different Lookalike Audiences: 1% Lookalike, 5% Lookalike, and 10% Lookalike.
The 10% Lookalike Audience had a 70% higher cost-per-conversion than the 1% Lookalike Audience.
73) $5 Per Day on Facebook Ads Can Buy You 9 Page Likes
Buffer tested what advertisers can get for a $5/day Facebook ad spend. They discovered that you could get 9 page likes at $0.57 per like.
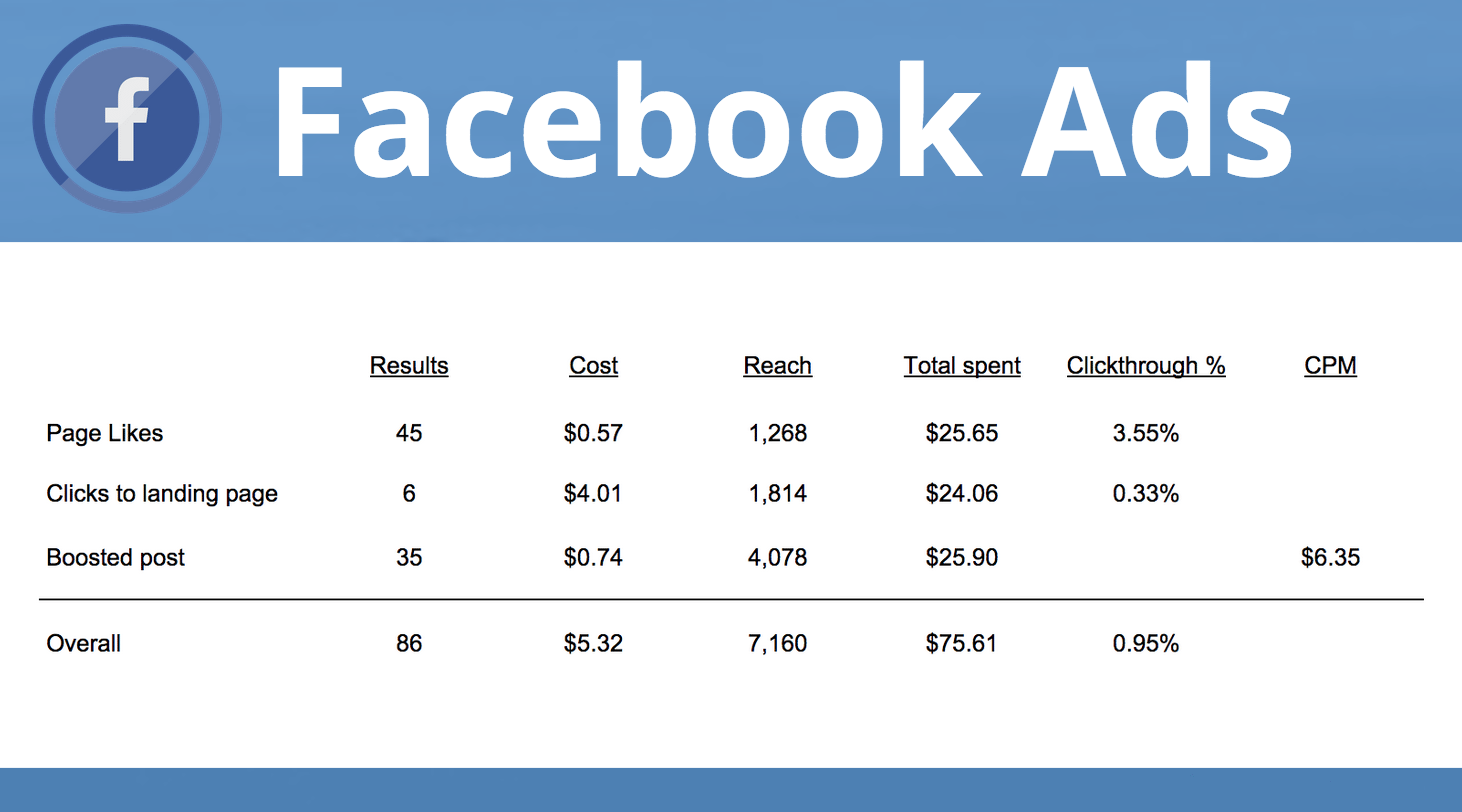
74) A Facebook ad click taking to a B2B site costs $4.01
According to an experiment by Buffer, the average cost per landing page click to a B2B website costs $4.01. However, if you’re able to create highly relevant Facebook ads, this number could be a lot smaller.
75) Reaching 1,000 people with Facebook adscosts $6.35
In the same experiment, Buffer’s team uncovered that reaching an additional 1,000 people with your Facebook ad campaigns costs around $6.35.
However, Buffer was targeting a B2B audience in a highly competitive industry. You can get results by a lot lower budgets.
76) $5 boostedpost can help to reach 787 people
The third key takeaway from Buffer’s Facebook ad experiment is that boosting a Facebook page post for $5 helped them reach 787 people on average.
As Buffer’s team also noted in the article, their advertising costs were really high compared to the industry average.
77) 75% of your Facebook post’s engagement happens in the first 5 hours
According to Post Planner’s research, 75% of the engagement you get on your posts happens within the first 5 hours.
After that, engagement pretty much dies off.
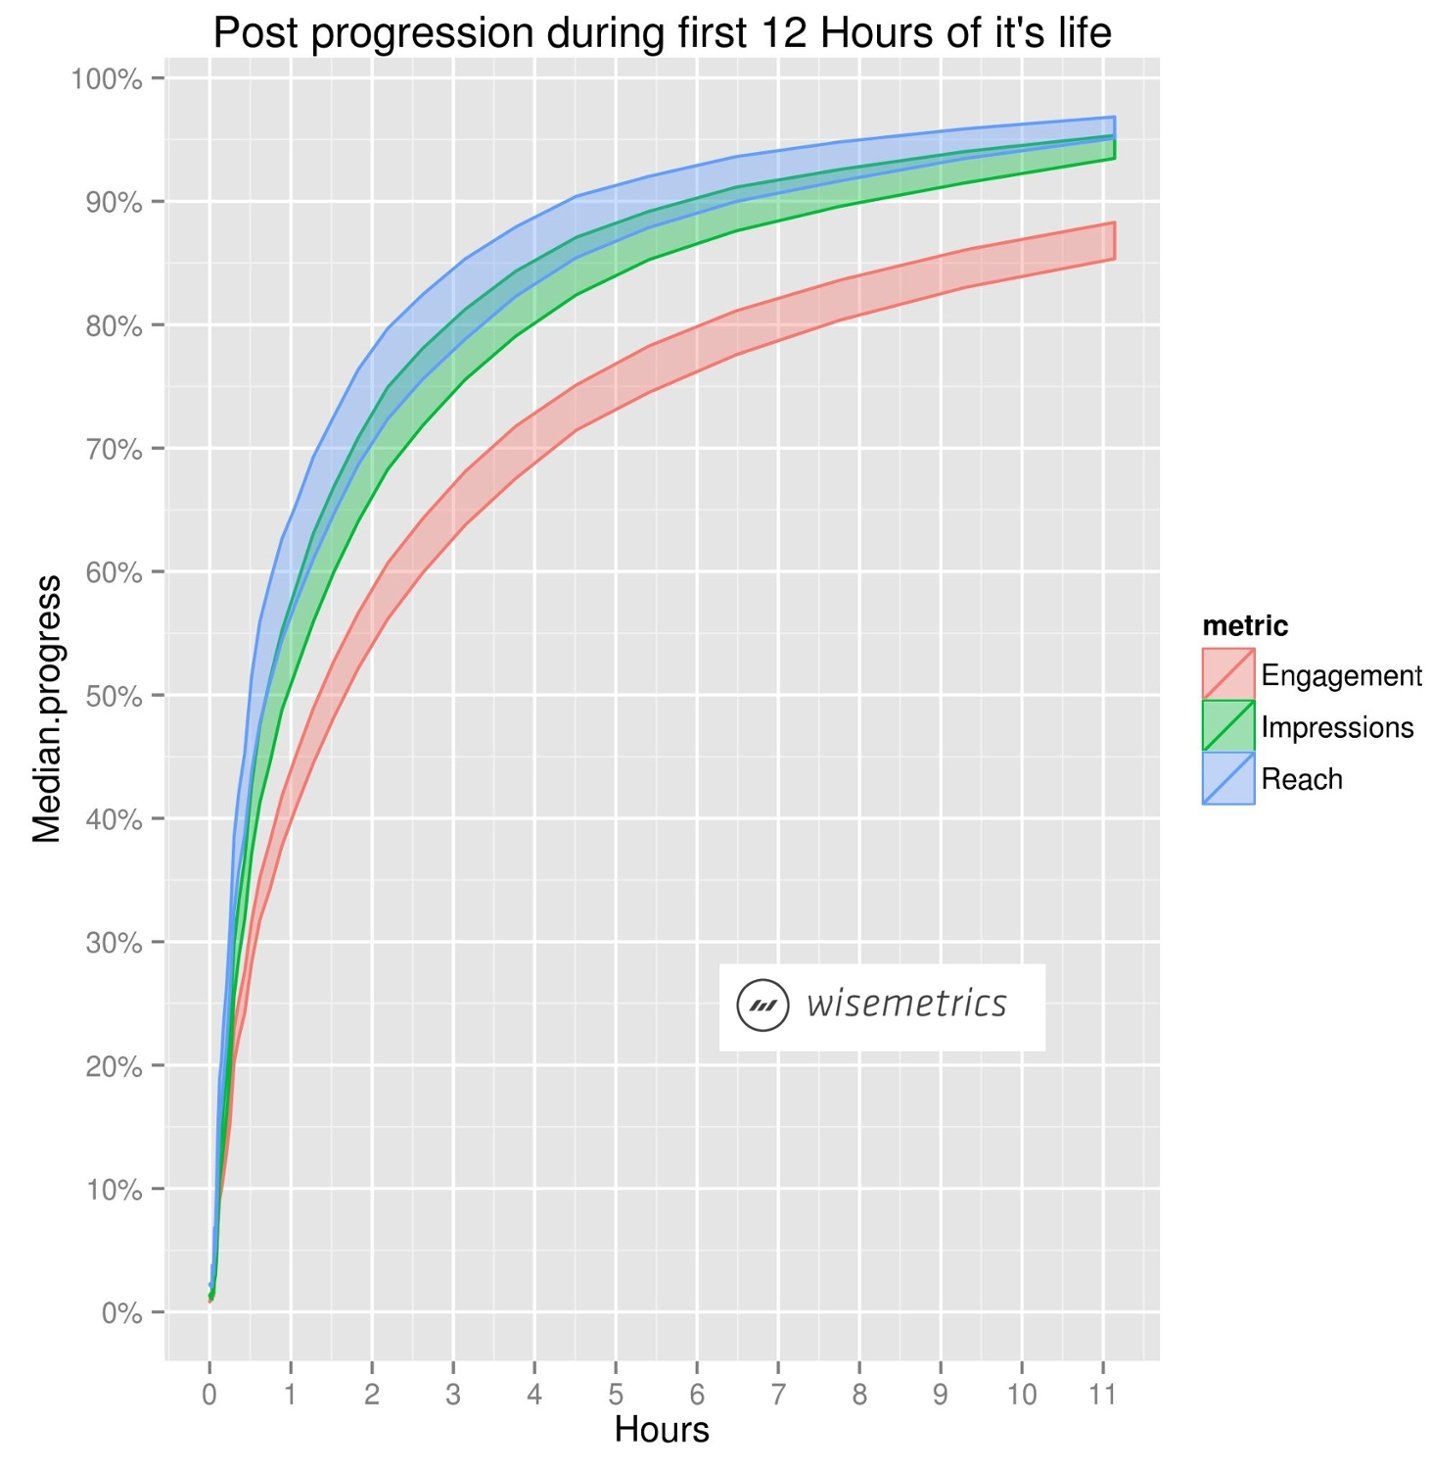
78) 75% of Facebook post’s lifetime impressions happen in 150 minutes
The same case study by Post Planner, data showed that 75% of impressions happen in just the first 150 minutes after publishing your Facebook post.
This could mean that once your Facebook post has been published for 2.5 hours, it might be a good time to boost it for further reach.
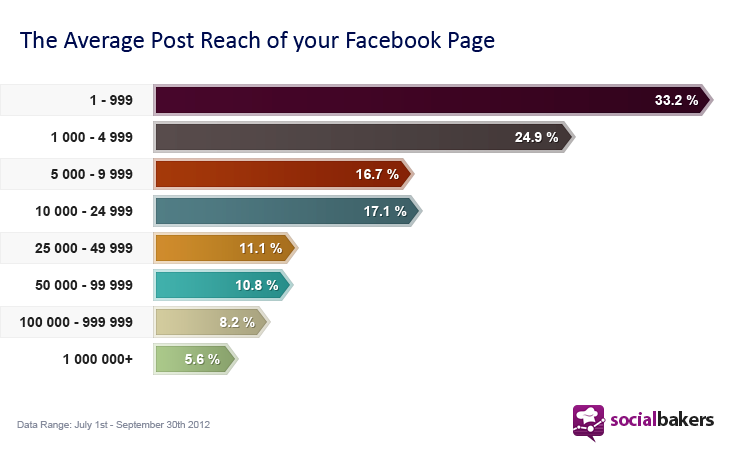
79) Your Facebook post’s reach depends on the size of your fanbase
According to research by Socialbakers, the organic reach of your Facebook posts depends on the size of your Facebook fanbase. The fewer page likes you have, the more people liking your page will see your post in their newsfeed.
What this means is that with growing your Facebook fanbase, you’ll also need to start using more expensive Facebook boosted posts to reach your entire audience.
80) The best time to post on Facebook is between 12 p.m. and 3 p.m.
Buffer looked into the best times to be publishing on various social media platforms. They found out that you could potentially get the highest post engagement when posting between 12 p.m. and 3 p.m.
On Saturday and Sunday, it’s between 12 p.m. and 1 p.m.
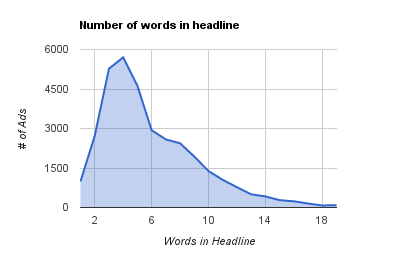
81) Most Facebook headlines are 5 words long
Regarding Facebook ad copywriting, most marketers prefer to use headlines that are 4-6 words long, AdEspresso’s analysis shows.
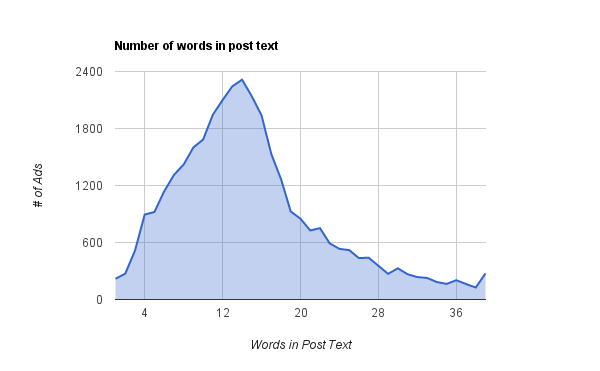
82) The average Facebook ad main copy is 14 words long
When analyzing 37,259 Facebook ads, AdEspresso discovered that the median length for ad post text is just 14 words long.
83) The average Facebook ad link description is 18 words long
The Facebook ad link description tends to be a little longer than the main copy, averaging at 18 words, as reported by AdEspresso.
84) Using a CTA button can lift click-through rates by 2.85 times
AdRoll’s research shows that Facebook ads with a call-to-action button can potentially return 2.85 times better results.
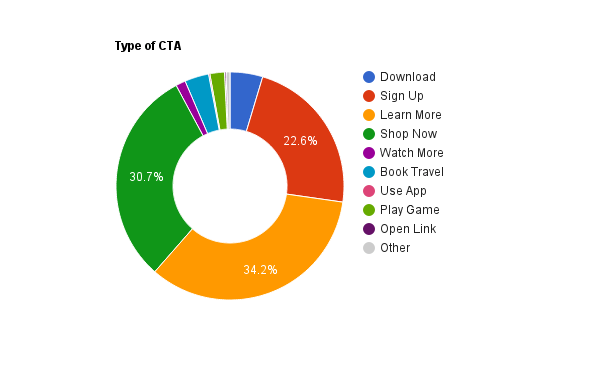
85) The most popular Facebook ad call-to-action button is “Learn More”
According to AdEspresso, the top three most widely used Facebook ad CTAs are:
- Learn More – 34.5% of all ads analyzed
- Play Game – 30.7%
- Sign Up – 22.6%
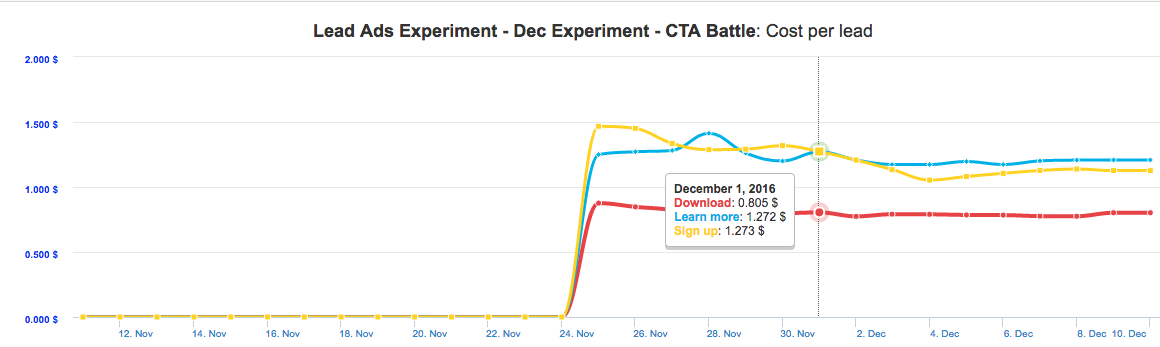
86) According to an experiment, “Download Now” is the best CTA
AdEspresso ran a Facebook ad experiment where they tested three different call to actions: “Download Now, ”Sign Up “,” and “Learn More.” The goal of their campaign was to get people download an eBook.
The “Download” CTA outperformed the “Learn More” CTA by 50.6% and the “Sign Up” CTA by 40.4% regarding the cost per lead.
That’s a wrap on Facebook Ads statistics
Statistics always help show what’s important to pay attention to moving forward.
As a marketer, staying on top of Facebook ads statistics and trends can help you to make the best decisions with your ad budget. While user trends may come and go, we hope these Facebook ads stats will help give you a deeper sense of behaviors and phenomena that are here to stay.
One of the biggest influences on Facebook user and advertiser behavior was the COVID-19 pandemic, and as society continues to respond to that disruption, the future and fate of advertising will live online. In the years to come, investing in your digital strategy is a smart move as more people will increasingly spend time online, and use social networking as a means for communication and information discovery.
Whether you’re scaling your budget to embrace social media advertising and eCommerce, or you’re looking to use social media marketing as an entirely new way to interact and build community with your customers, embracing social media marketing can yield strong and (surprising) results for your business.
Now that you’ve got all the Facebook ads stats and facts, make sure you didn’t miss any of our other Facebook tips that’ll bring high conversion rates.
