


When it comes to your AdWords account performance, have you ever wondered which hours of the day are performing the best?
Or maybe which cities are kicking the most butt and making you some serious money, like this sloth?

The AdWords dimensions tab will tell you just that, and a lot more actionable insight.
What kind of actionable insight? Well, just to name a few, you can:
See which days of the week are performing the best and the worst. Maybe your Tuesdays are twice as expensive as your Thursdays?
See which hours of the day have the highest performance fluctuations.
See how the performance of your destination URLs differ (especially helpful if you’re running multiple landing page tests at once).
See which geographic locations (city, metro, state, country, or region) are making you the most money and which are making you poor.
See which automatic placements (website URLs) in your Display Network and Remarketing campaigns are getting you the best return on ad spend.
See new performance abnormalities/anomalies are happening and what’s causing them.
I guess you could say that the AdWords dimensions tab is like your all-in-one AdWords data dashboard, to help you get to where you want, faster.

A stones throw away from all the questions you have, yet crave answers to.
But what good is data if you can’t act on it?
Short answer? Not good.
So to make sure you can actually improve your AdWords agency performance, let’s take a look at each of the AdWords dimension tabs, what they mean, and what you can do to take your AdWords account to the next level.
In order to get to the AdWords dimensions tab, go within your AdWords account and click on the "Dimensions" tab (too simple right?)
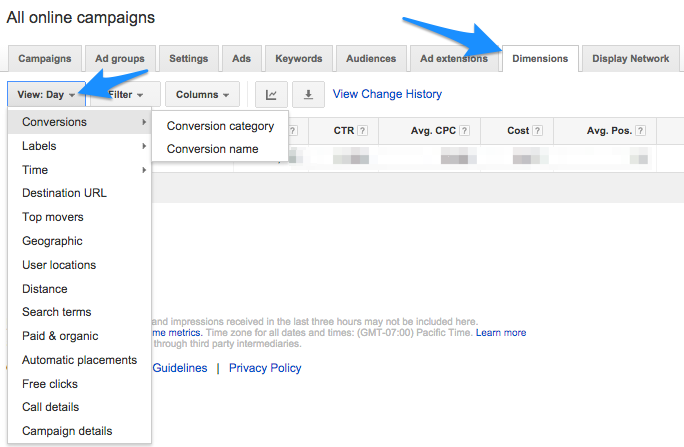
Let's dive in:
Get brand new Google ad strategies straight to your inbox every week. 23,739 people already are!
-Conversions (Category & Name):
If you have multiple conversion codes created, this view allows you to see which conversions are being tracked and counted.
Conversion categories are split up into: Purchase/Sale, Sign-up, Lead, or View of a key page.
Conversion names are the names you set and give the different conversion codes you've created in the Tools > Conversions menu at the top of your AdWords interface.
-Labels:
Let's say you're running isolated tests between keywords, ads, ad groups, and/or campaigns.
AdWords labels allow you to quickly filter between parts of your account where you have assigned labels to.
You could be running a certain ad test across 10 different ad groups and then labeled each ad.
A week later, you come back and filter by label to see how those ads are performing against the rest of the ad group, campaign, or account.
This AdWords dimensions tab view allows you to quickly see all your labels in your entire AdWords account.
- Time (Best Hours, Days, Weeks, Months, Year):
Just like some businesses are seasonal, so are the hours of the day in which you advertise.
Sometimes you’ll think that if you advertise at night (when your competitors aren’t) then you may get more conversions at lower costs.
And while that could be true, you also have to be aware that conversions at odd hours sometimes don’t give you the same quality conversions compared to conversions at rush hour.
The AdWords dimensions tab helps you break down which hours of the day perform the best and can give you insight whether or not you should modify your bids to save money or be more aggressive.
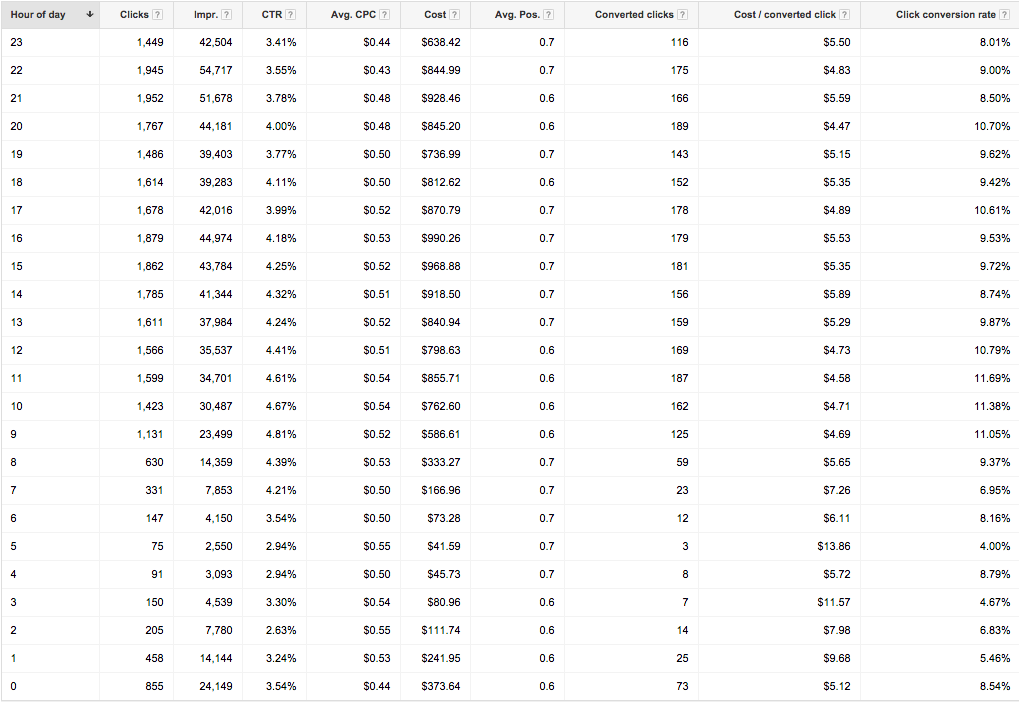
You can also see if advertising on the weekends make sense, or like I mentioned earlier, if Tuesdays are in fact twice as expensive as advertising on Thursdays.
You can then take that data and figure out if you’re squeezing out your impression shares to the max on Thursdays to get the best possible results.

The other great thing you can do within the same view is compare stats of weeks, months, and years to see if you or your Adwords management agency are putting in the work necessary to get better results and moving the needle in the right direction over time.
- Destination URLs:
I’m probably gonna make some landing page enthusiasts squirm with this statement:

"It’s quite common that sending AdWords traffic to a dedicated landing page
doesn’t perform better than a homepage."
Why?
Because of the isolating nature of landing page optimization, your visitors and potential customers often want to know more about you and your services before converting.
They need more intel to be able to trust you.
So they want to check out how good your blog is, your social media marketing, and how many people work at your company. They want to see the social proof that the landing page doesn’t tell them.
Because of this reason alone, the destination URL view in the AdWords dimensions tab could tell you if your homepage or landing page performs better.
Another example is if your an Ecommerce store.
Have you ever wondered if sending traffic to your home page performs better than your category or product page?
Sounds counterintuitive right?
But depending on how good your site is, these are valid questions to ask yourself.
The AdWords dimensions tab uncovers which destination URLs are performing better.
Use it to quickly gauge which direction you should use to lift your conversion rates and if you should switch traffic flow to a different destination URL.
- Top Movers:
Have you ever asked yourself: "What's for dinner?"
Or maybe with more AdWords specificity: "What made my CTR drop or my CPCs go so high yesterday?"
The Top Movers report tells you just that.
Within this view, you'll be able see a comparison of time between your entire account, campaign, or specific ad group for 7, 14, or 28 days at a time.
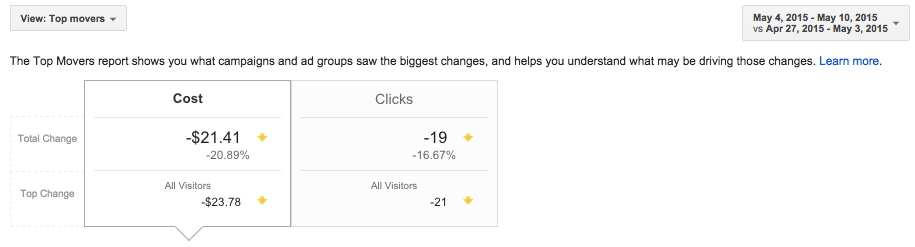
You can then drill down further and see the Top increases and decreases for cost in specific areas of your account and see if anything from the Change history report actually influenced those changes to happen.
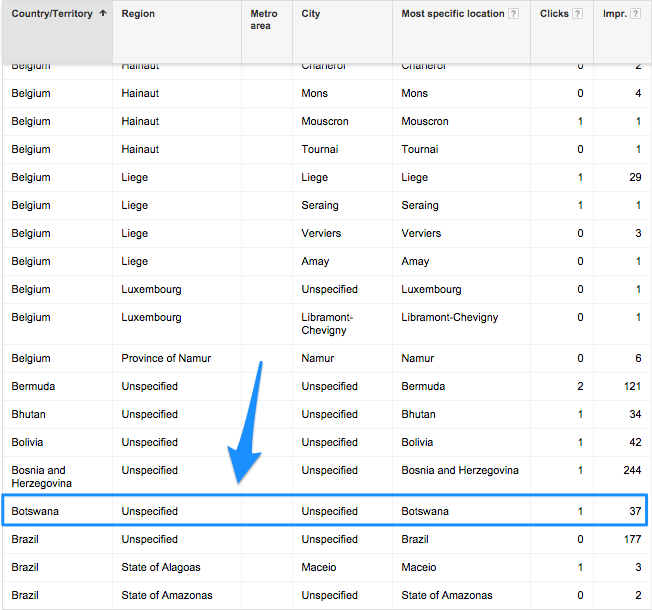
-Geographic:
There's been a lot of confusion between the next two AdWords dimension tab reports - Geographic vs User Locations.
The Geographic report shows your visitors' physical locations (where they were physically when clicking your ad) OR, and this is important, or locations that they've shown interest in.
Hmmm...
"Shown interest in? What does that even mean?"
Yes yes, I see the confusion on your face, but don't worry.
It has to do with your campaign settings, under Location options (advanced). If you look at the screenshot below, it'll all make sense.
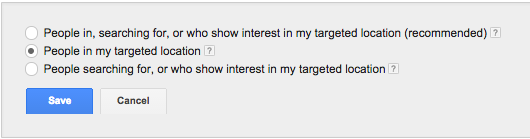
If you choose the first radio button as your Location options, then you may be getting clicks from outside your targeted geographic area.
This is simply because people in Botswana (no offense to anyone from Botswana reading this) could be interested in your ads.
But the question is, are you interested in visitors from countries you're not targeting?
Probably not.
- User Locations:
To our point prior, did you know that your ads are probably showing up in other countries?
Google was smart to change the campaign location targeting settings back in November of 2014, to allow more “relevant” impressions to happen.
So, if your AdWords campaign settings aren’t set to “People in my targeted location”, then there’s a good chance your user locations tab has people in Botswana seeing your ads, even if your Locations targeting is set to the U.S. for example.
Unless you’re advertising internationally, then it might be good idea to quickly change your campaigns’ location targeting settings.
The clicks and cost might not be racking up, but your lower click-through-rates and not-so-great relevancy are hurting the overall health of your AdWords account.
Now let's say you have your AdWords location settings on lock down, you can use the Geographic and User locations reports to see which geographic areas are performing best.
It could then be a good idea to create new AdWords campaigns isolating well performing geographic areas to make sure you grab all possible impressions and clicks.
- Distance:
If you're a brick-and-mortar business, have you ever wondered how far people are willing to travel to do business with you?
The Distance report gives you clear insight how far out your clicks are leading to conversions and also the click-through-rates to see if would make sense to potentially extended your geographic radius targeting from 10 miles to 20.
With this report, you'll be able to see increments of distance performance from as close as 0.7 miles to 40 miles out.
Pretty neat eh?
- Search Terms:
The Search terms report is just like it sounds - it shows you the actual searches that have created impressions and clicks on your ads.
You can also access this report through your regular Keyword tab and then by going down to the "Details" tab and selecting the Search Terms portion of the drop down.
As a common use for finding and adding new negative keywords, the Search terms report from the AdWords dimensions tab quickly allows you to see if your keywords are as good as you think they are.
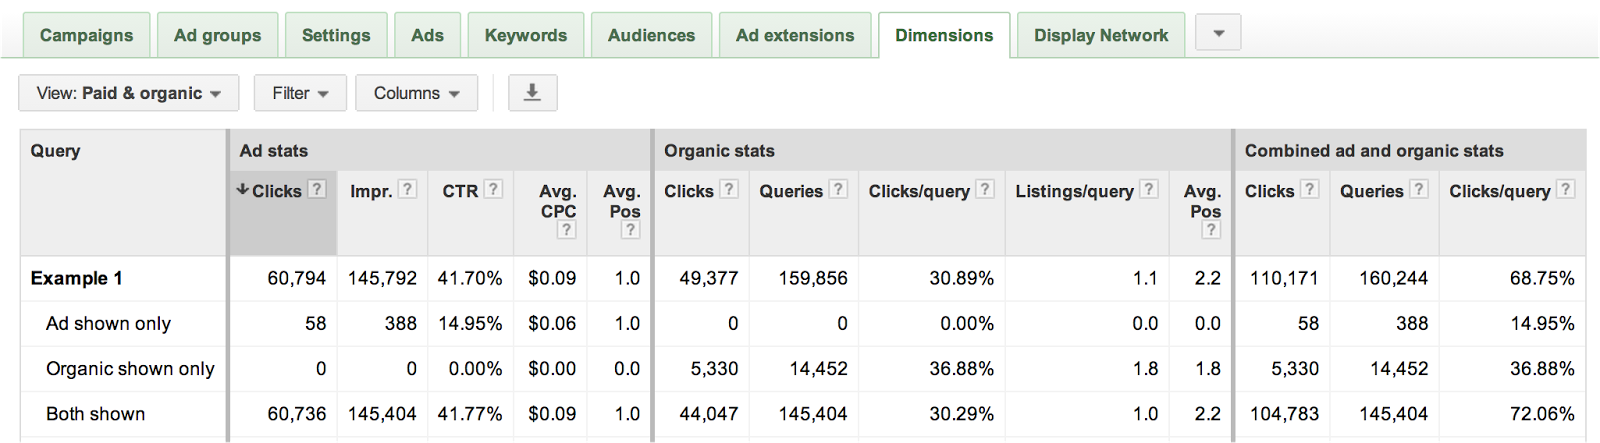
- Paid & Organic:
Have you ever wondered what if your organic listings on Google are messing with your AdWords ads?
Or vise versa?
If not, you should be wondering. Because, it's important stuff.
The Paid & Organic report shows you how your PPC management ads are performing when no organic listings are on the same page.
It also shows you how your organic listings are doing without PPC ads in the mix, and how the performance is when both an ad AND an organic listing are on the same page.
Now, you may be going to that exact report right now because it's so cool to look at.
You get to it, but realize that there's no data. Why?
It's because you didn't link your Google Webmaster Tool's account with your AdWords account.
To do so, go to your little top-right-handed-corner gear icon and click on "Account settings", then on "Linked accounts".
I believe you can figure out the rest :)

- Automatic Placements:
If you’re a brilliant AdWords advertiser (which I know you are), then you know how great a remarketing campaign can be.
By having your ads follow non-converting visitors around, your remarketing campaign reminds, pokes, and teases your past visitors why they should do business with you.
But do you know where your remarketing ads are showing up?
See, your visitors are some super weird people.

And all of them go to different websites after they’ve been on your site or landing page.
Those websites they visit perform differently when it comes to click-through and conversion rates.
Some give you a ton of clicks, but no conversions. And then there are some that are kicking ass and taking names.
The Automatic placements report in the AdWords dimensions tab helps you uncover which automatic placements your remarketing and display ads are showing up on.
You can then take the underperforming placements and exclude them completely, and take the better performing placements and create targeted ad groups around them.
- Free Clicks:
The AdWords universe houses a lot of different ad types.
Some are text, some are image, some are animated, some are videos, some are billboards (okay maybe not billboards).
And all these different ads have different success measurements. Because of that, Google will allow you to get free ad clicks on some specific ads.
For example: Let's say you have an animated ad the requires a click to expand, and then a second click to actually go to the Destination URL.
In the example above, your free click would the "expanding click", and this report tells you how many of those are happening.
Another example could be a video ad format on AdWords.
A beginning click to start the video is a "Free click" only if the visitor doesn't watch more than five seconds. If the visitor goes over that or any other "minimum time", then you will be charged.
If you're not using animated Display network ads and are more focused on the Search network, then this report won't do much for you.
- Call Details:
Do you use Google forwarding numbers for your call extensions? Then this report will be right up your alley.
The Call details report shows you which ad groups and campaigns are producing the most phone conversions for you, with some additional data.
If you know that these types of leads are the most important for you (as they usually are in lead generating industries), then you can use the report data to allocate more budget to the campaigns and ad groups that are driving you the best results.
In addition to pure phone conversion volume, you'll also be able to see:
- Call start times
- Call end times
- Whether you missed or received calls
- The caller's area code
- Call types (mobile vs. desktop calls)
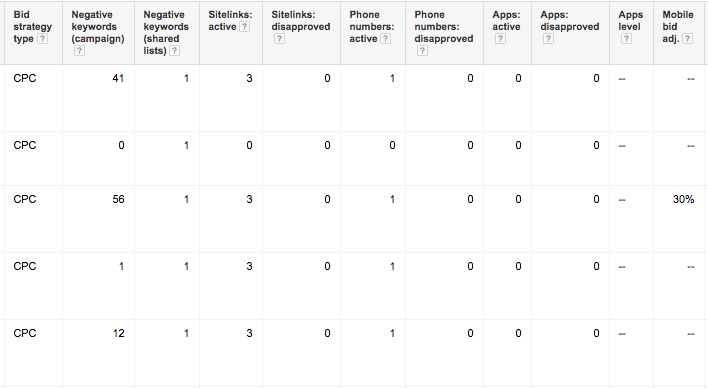
- Campaign & Ad GroupDetails:
Last, and certainly least, are the Campaign & Ad Group detail reports.
These reports show you a breakdown of all the vitals inside your campaigns and/or ad groups in regards to active sitelinks, negative keywords, disapproved ads, bid adjustments, etc.
If you ever wondered if you have all your bases covered, then this could be a great overview for you.
The AdWords dimensions tab is a universe in and of itself.
But at least you now have the tools to navigate and understand what actionable insight you can use to improve your AdWords performance.
What have you found to be the biggest shocker when looking at those reports?
P.S. If you liked this article, then please share it. It would help us grow.