If I had a dollar for every time I’ve been asked some version of “What’s a good ROAS?” I would have a great ROAS. (Technically the ROAS would be infinite because I’ve never paid anyone to ask me that question.) But, the truth is, there’s no such thing as a “capital G” good ROAS. Your ROAS is the result of multiple factors not just in your ad accounts, but in your eCommerce business itself.
I will be breaking it down so you’ll understand the business mechanics that shape your ROAS, how to know whether your ROAS is healthy for your business, and strategies that support your paid ads to help you build a stronger business. Between the three pillars that support your ROAS and four strategies for long-term improvement, you’ll learn the seven keys for long-term ROAS mastery.
Get brand new marketing strategies straight to your inbox. 23,739 people already are!
What is the ROAS formula?
Before we get into the thick of things, let’s start with the fundamentals. ROAS is a common marketing metric in the PPC world and stands for return on advertising spend. What’s the formula for ROAS? ROAS is simply your total revenue divided by your total ad spend:
[caption id="" align="aligncenter" width="590"]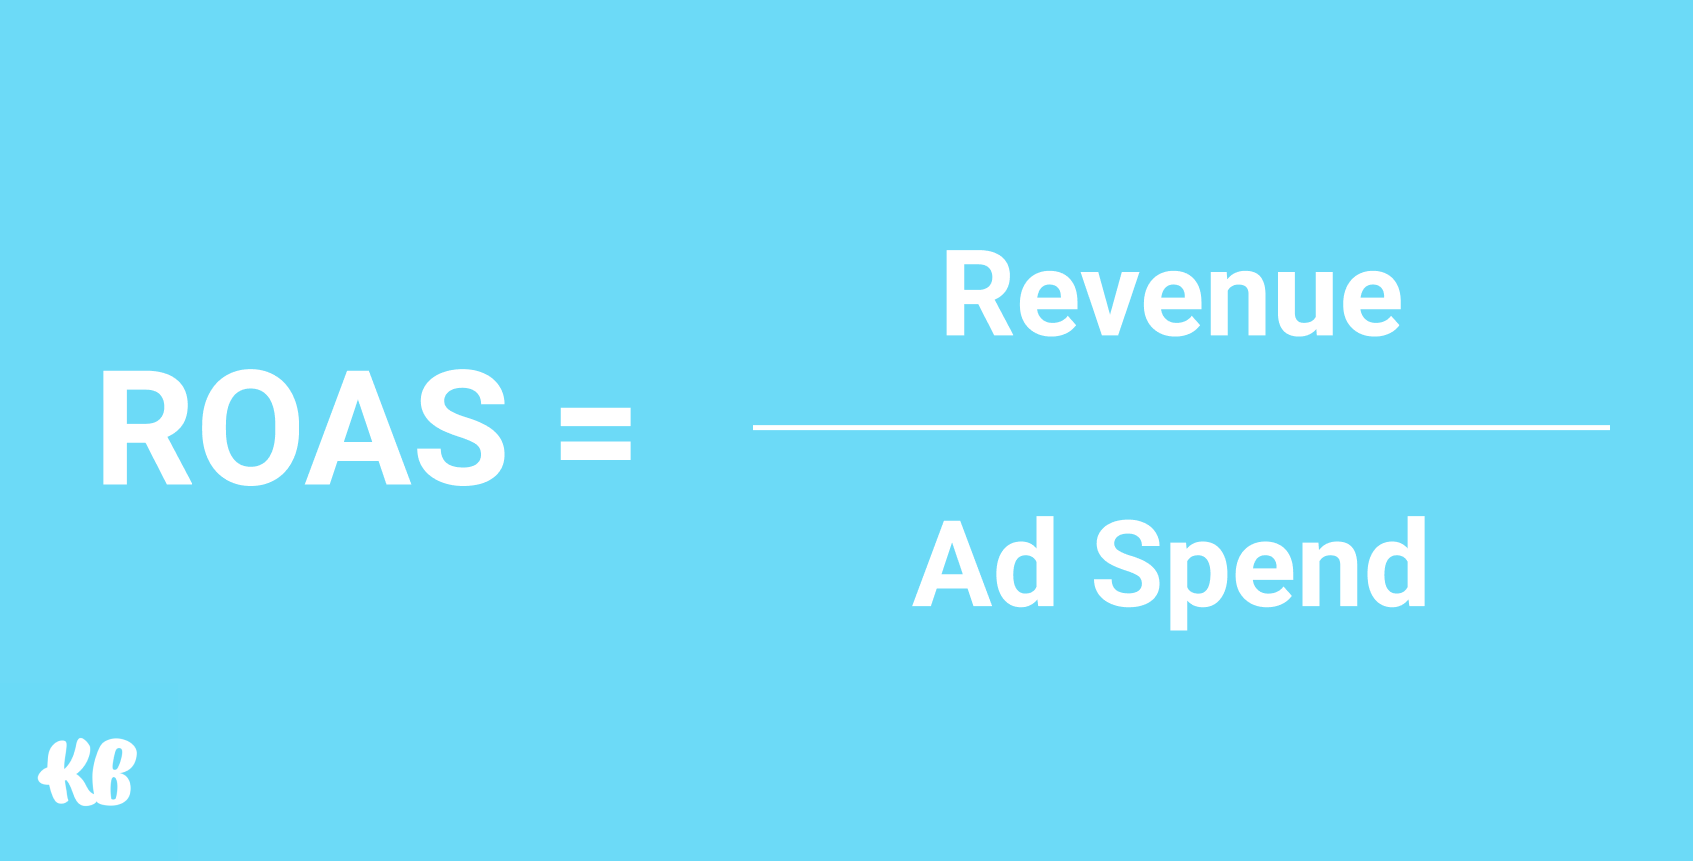 ROAS = Revenue / Cost[/caption]
If, for example, you generate five dollars in revenue for every dollar in ad spend, then your ROAS would be a 5. Or if you generated $80,000 in revenue and spend $20,000 on ads, then you’d have a 4 ROAS.
Platforms like Google Ads and Facebook will also calculate ROAS for you. In Google Ads, this is typically presented as “Conversion Value / Cost.” And in Facebook, it’s presented as “Purchase ROAS.”
One thing to keep in mind about ROAS: it’s not the same thing as ROI, or Return on Investment. The calculation for ROI is (Revenue - Cost) / Cost.
[caption id="" align="aligncenter" width="590"]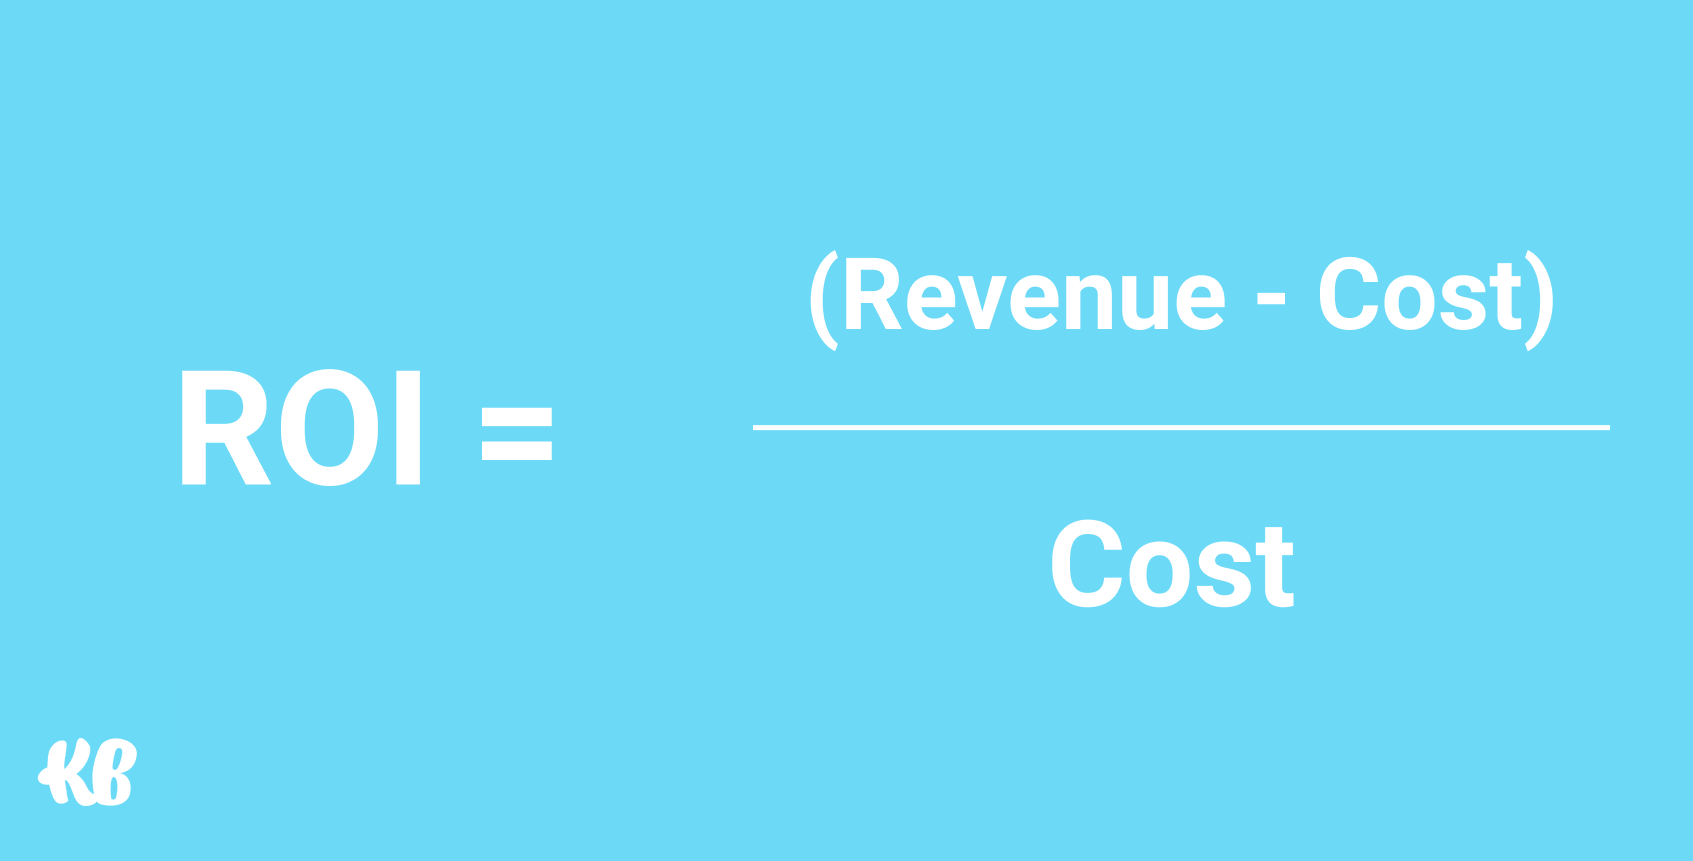 ROI = (Revenue-Cost) / Cost[/caption]
To use one of our earlier examples, if you generated $80,000 in revenue last month and spent $20,000 on ads, you’d have an ROI of 4. If you’re more concerned about understanding your return on investment, here’s a quick hack you can use: your ROAS calculation minus one equals your ROI. A ROAS of 5, for example, is equal to an ROI of 4.
While ROAS is a simple ratio of dollars earned to dollars spent, you may prefer ROI to get a clearer understanding of your earnings after costs.
These calculations are helpful for getting a quick understanding of the numbers of dollars made versus dollars spent. But there’s no one ROAS or ROI figure that guarantees profitability for everyone’s ad account. To help you understand whether your ad account is meeting business goals, you need to understand your ROAS through the lens of your gross margins and other variable costs.
The 3 Pillars That Support Your ROAS
ROAS isn’t a universal measure across ad accounts. Meaning, some businesses are happy to get a 1 ROAS while some may barely scrape by with a 4 ROAS. Part of this is goals and context. But it also depends on what’s going on under the hood of your business. Let’s talk about the three underlying pillars that support your ROAS.
1. Profit Margins
The first pillar that supports your ROAS is your profit margins. More specifically, gross margins. And deciding what ROAS you should have before understanding how your margins tie into it is a completely useless exercise. (That is if you want to make money.)
On the surface, for example, a 1.5 ROAS might not seem like a lost cause. You’re making $1.50 for every dollar you spend. Right? Well, it depends.
Let’s say your gross margins are 50%. If you’re selling a product that costs $100, you’ll keep $50 after the cost of goods sold (COGS). A 1.5 ROAS on that same product would mean you spent $66.50 on advertising to get that sale. After your COGS, you’ve actually lost $16.50. Yikes.
[caption id="" align="aligncenter" width="590"]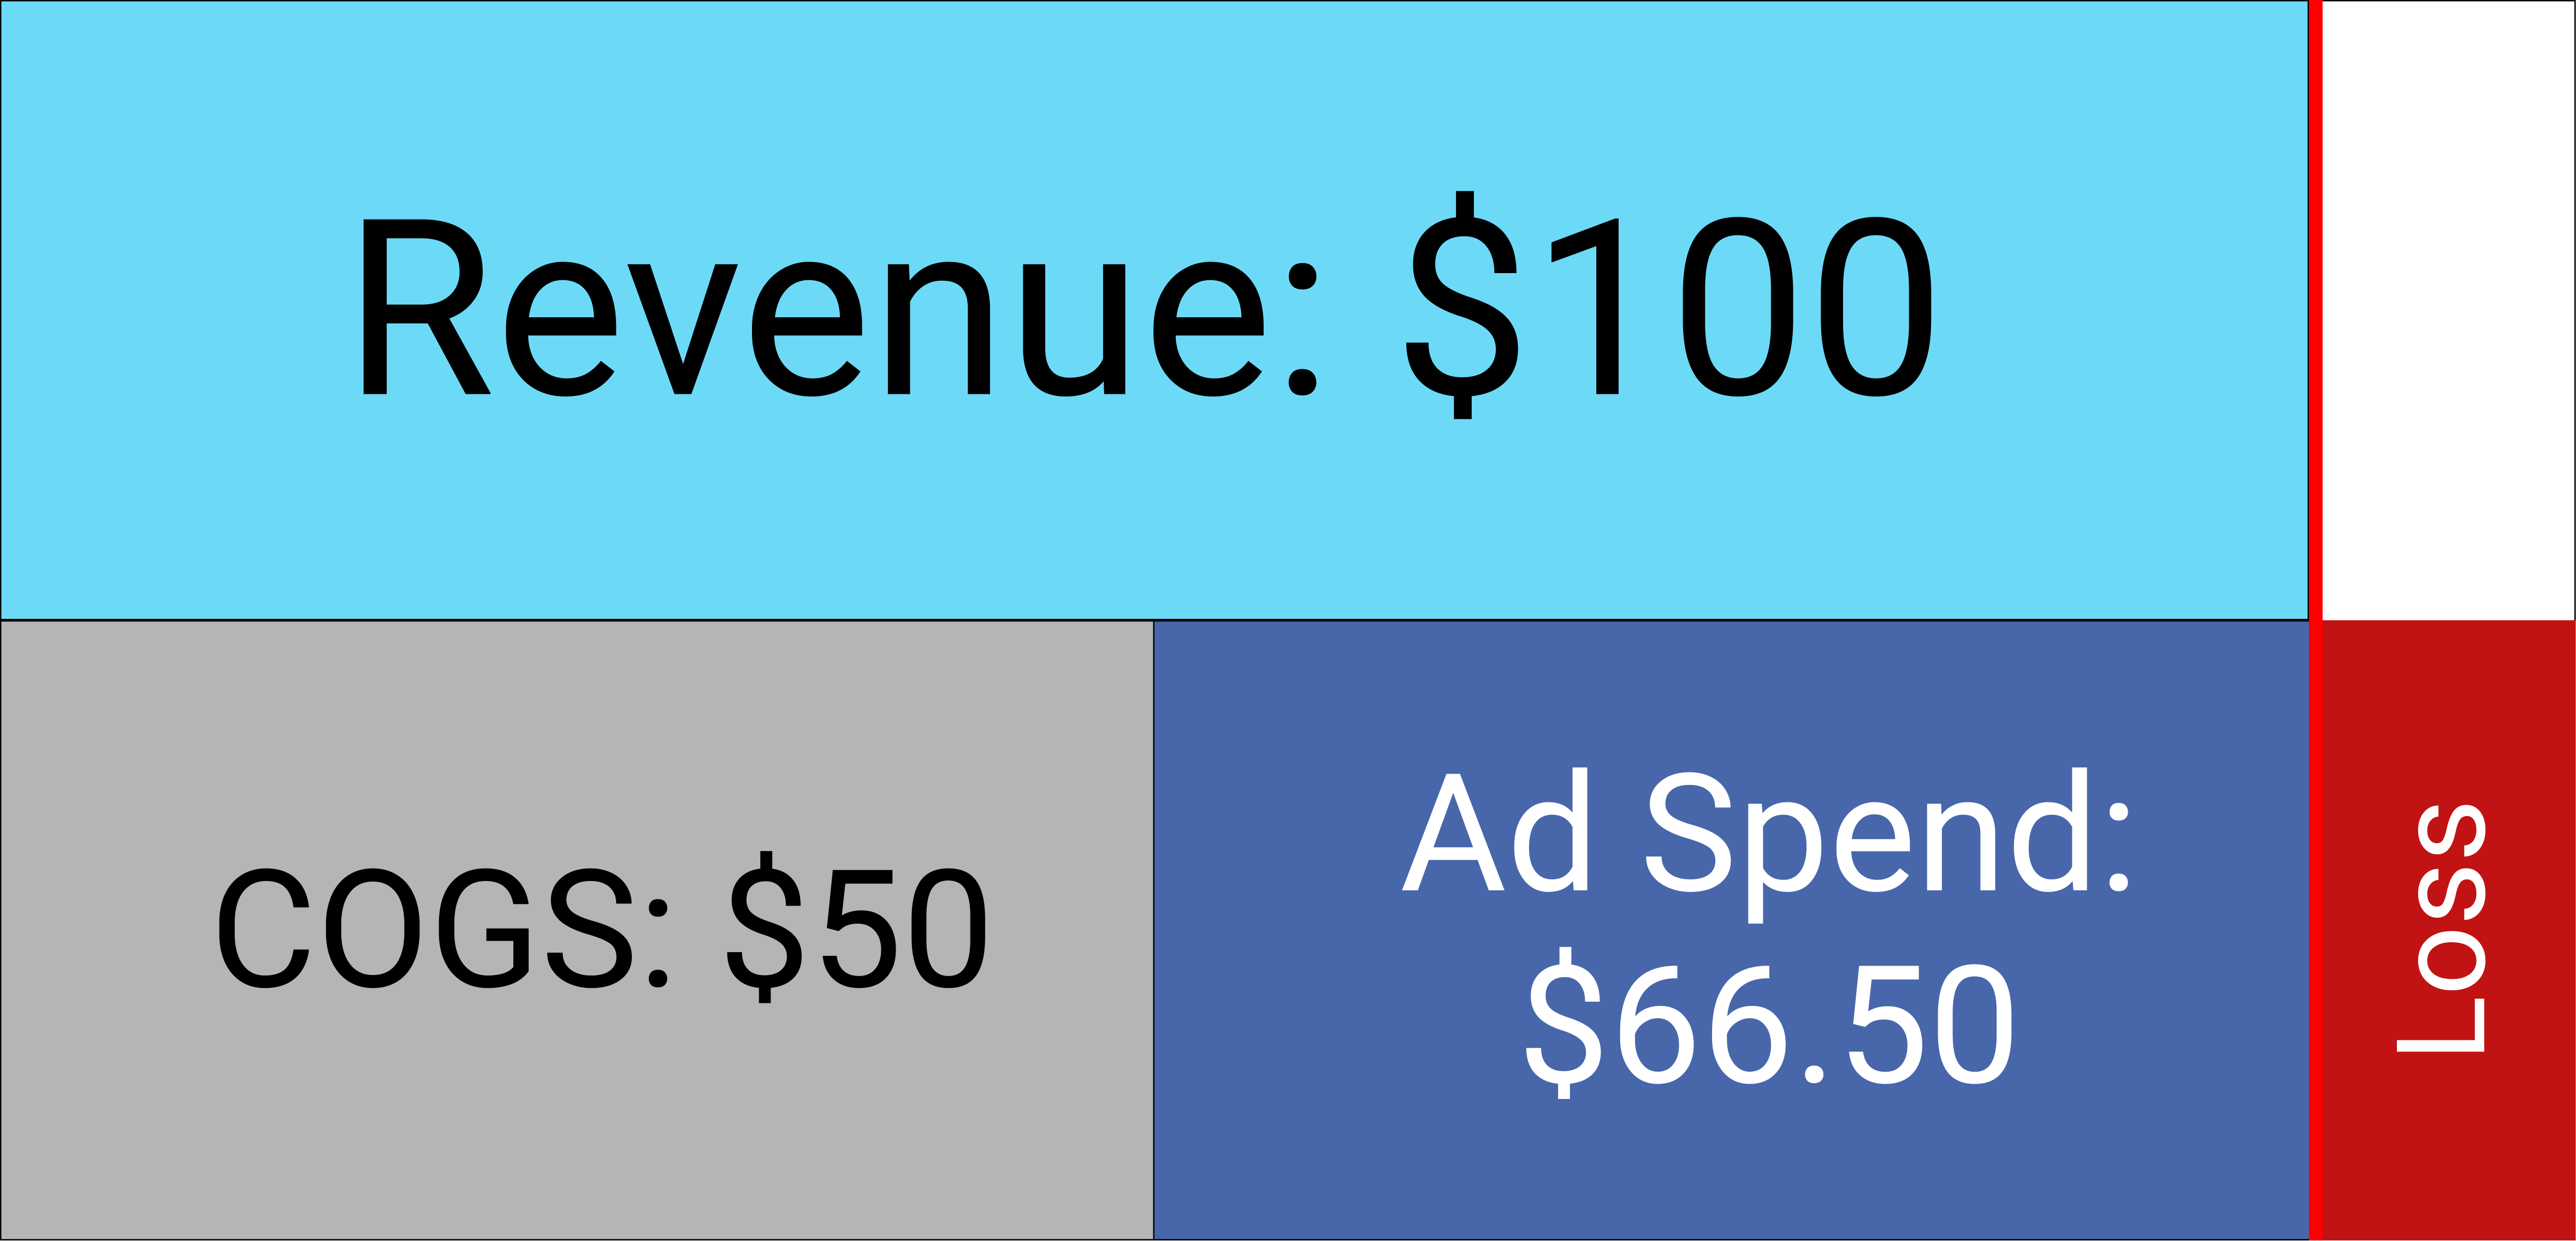 Make sure that you’re not unintentionally setting ROAS goals that put you past the break-even line.[/caption]
So, how do you at least break even?
You probably know what we need in this case. If your product sells for $100 and you have 50% gross margins, then you’ll need at least a 2 ROAS (no more than $50 in ad spend) to break even. If you have 25% gross margins, you’ll need a 4 ROAS. If you have 12.5% margins, you’ll need an 8 ROAS and a pretty expensive product that people are itching to buy. We’ll cover that in more depth next.
2. Average Order Value
The second pillar behind your ROAS is your average order value (AOV). Your AOV is the average amount your customers pay at checkout, and how much your customers spend at checkout can quickly make the difference between a low ROAS and a high ROAS. You can run a quick calculation of your AOV for different time periods or different channels by dividing the total revenue by the number of orders.
Now, if your goal is to get a profitable return from paid advertising, your AOV has a strong influence over whether you’ll be successful. For example, if your AOV is $10 (an exaggeratedly small number) and you’re paying $1 per click, then you’ll need at least a 10% conversion rate just to pull off a 1 ROAS. That’s a big ask for such a low payoff. Even without any COGS to consider, this is an uphill battle.
If your AOV is $100, on the other hand, you have a lot more breathing room. Let’s say your margins are still 50%, we’ll even go a step further and say that other variable costs, like shipping and payment processing, shave off another $15. So you really don’t want to pay more than $35 in order to actually break even.
If you’re paying a dollar per click, you have thirty-five chances to gain a conversion. In this case, you’d only need a 2.8% conversion rate. More realistic, right?
Strong AOV and goals focused on first-purchase profitability from paid ads go together like peanut butter and jelly. Without strong AOV, you’re stuck with two pieces of bread and some jelly—an unfavorable, sticky situation.
If you’re reading this and your palms are sweating over your low prices, don’t worry too much. Let’s dive into how to measure repeat purchases, how to extract the most accurate ROAS data from your ad platforms, and some cross-channel strategies you can use to support your ROAS.
3. Customer Lifetime Value
If hearing about lifetime value (LTV) reminds you of sitting in the backseat of your parents’ car as a kid and repeatedly asking “are we there yet?” I don’t blame you. Like a road trip destination that’s countless hours away, LTV feels too far off for comfort. So let’s put LTV into more practical terms—terms that don’t require us to sit around for the rest of our lives, waiting to see the value.
First, we have to confront an uncomfortable truth: acquiring customers is expensive. If you’re not putting any resources into increasing repeat purchases from your existing customers, you’re making your job harder than necessary. Why? Because returning customers are 9x more likely to buy than first-time shoppers while also having a higher AOV. Doesn’t that sound more fun than just focusing on acquisition?
If you sell a replenishable product, like food or supplements, for example, 20-30% of your customers should be buying from you more than once. This is good news. If you’ve been operating under the assumption that your ads need to deliver you profitable results on the first purchase, you can actually grow faster without falling into the red, because the customers you acquire will drive more profit over time.
The key here is to understand how much your customers buy in a 30, 60, or 90 day period after their first purchase so that you don’t overshoot your customer acquisition cost.
What is a good ROAS for Facebook?
According to a 2015 Nielsen study, the average ROAS across most industries hovers around 287% and according to another source, a common ROAS benchmark is a ratio of 5:1, or $5 in revenue for $1 ad spend.
The difference between 2.87 and 5 is a pretty wide gap. In the interest of being more specific (and more recent), our own data looking at nearly $5 million in Facebook ad spend for KlientBoost eCommerce clients shows an average ROAS of 3.62:
[caption id="" align="aligncenter" width="590"] Not a guess, not a study: actual results.[/caption]
But let’s be honest here: averages don’t help your actual advertising efforts. As we’ve already seen, your gross margins, average order value, and customer lifetime value can not only shape the kind of ROAS you end up with but also what you consider a good ROAS.
One more thing: we love fancy bid strategies and tactical nitty-gritty as much as—well, anyone. But if you’re trying to make a drastic difference in earnings, you’ll make a bigger dent in your goal from finding ways to improve your customer retention and AOV than making small constant tweaks to your ad sets every day.
In fact, you’ll want to err on the side of simplicity with your Facebook campaigns. Account simplification is one-fifth of Facebook’s Power 5 framework. And it improves your odds of generating a high ROAS.
How so? Facebook ads rely on machine learning to find your ideal customer. And with a simpler account structure, the machine learning’s calculations are split across fewer moving pieces. More practically, your advertising budget isn’t spread as thin across different audiences either.
It’s also important to understand your ad account’s delayed attribution and how your ROAS differs throughout the funnel. If you understand these two things, you can ensure you don’t become a barrier to your own growth.
How to Calculate Delayed Attribution for Facebook Ads
Calculating your delayed attribution sounds harder than it is. All we’re doing here is solving the gap between the time visitors click your ads and when they buy. This gap usually gets wider when you’re selling something relatively complex or expensive, and it’s good to know exactly what this gap looks like so that you can look at yesterday’s ROAS and know whether you’re on track or not.
To calculate your delayed attribution, you’ll need to open up your columns in Facebook ads manager, customize your columns, and click on the “Comparing Windows” link so that you can view your 1 and 28-day attribution windows.
[caption id="" align="aligncenter" width="590"]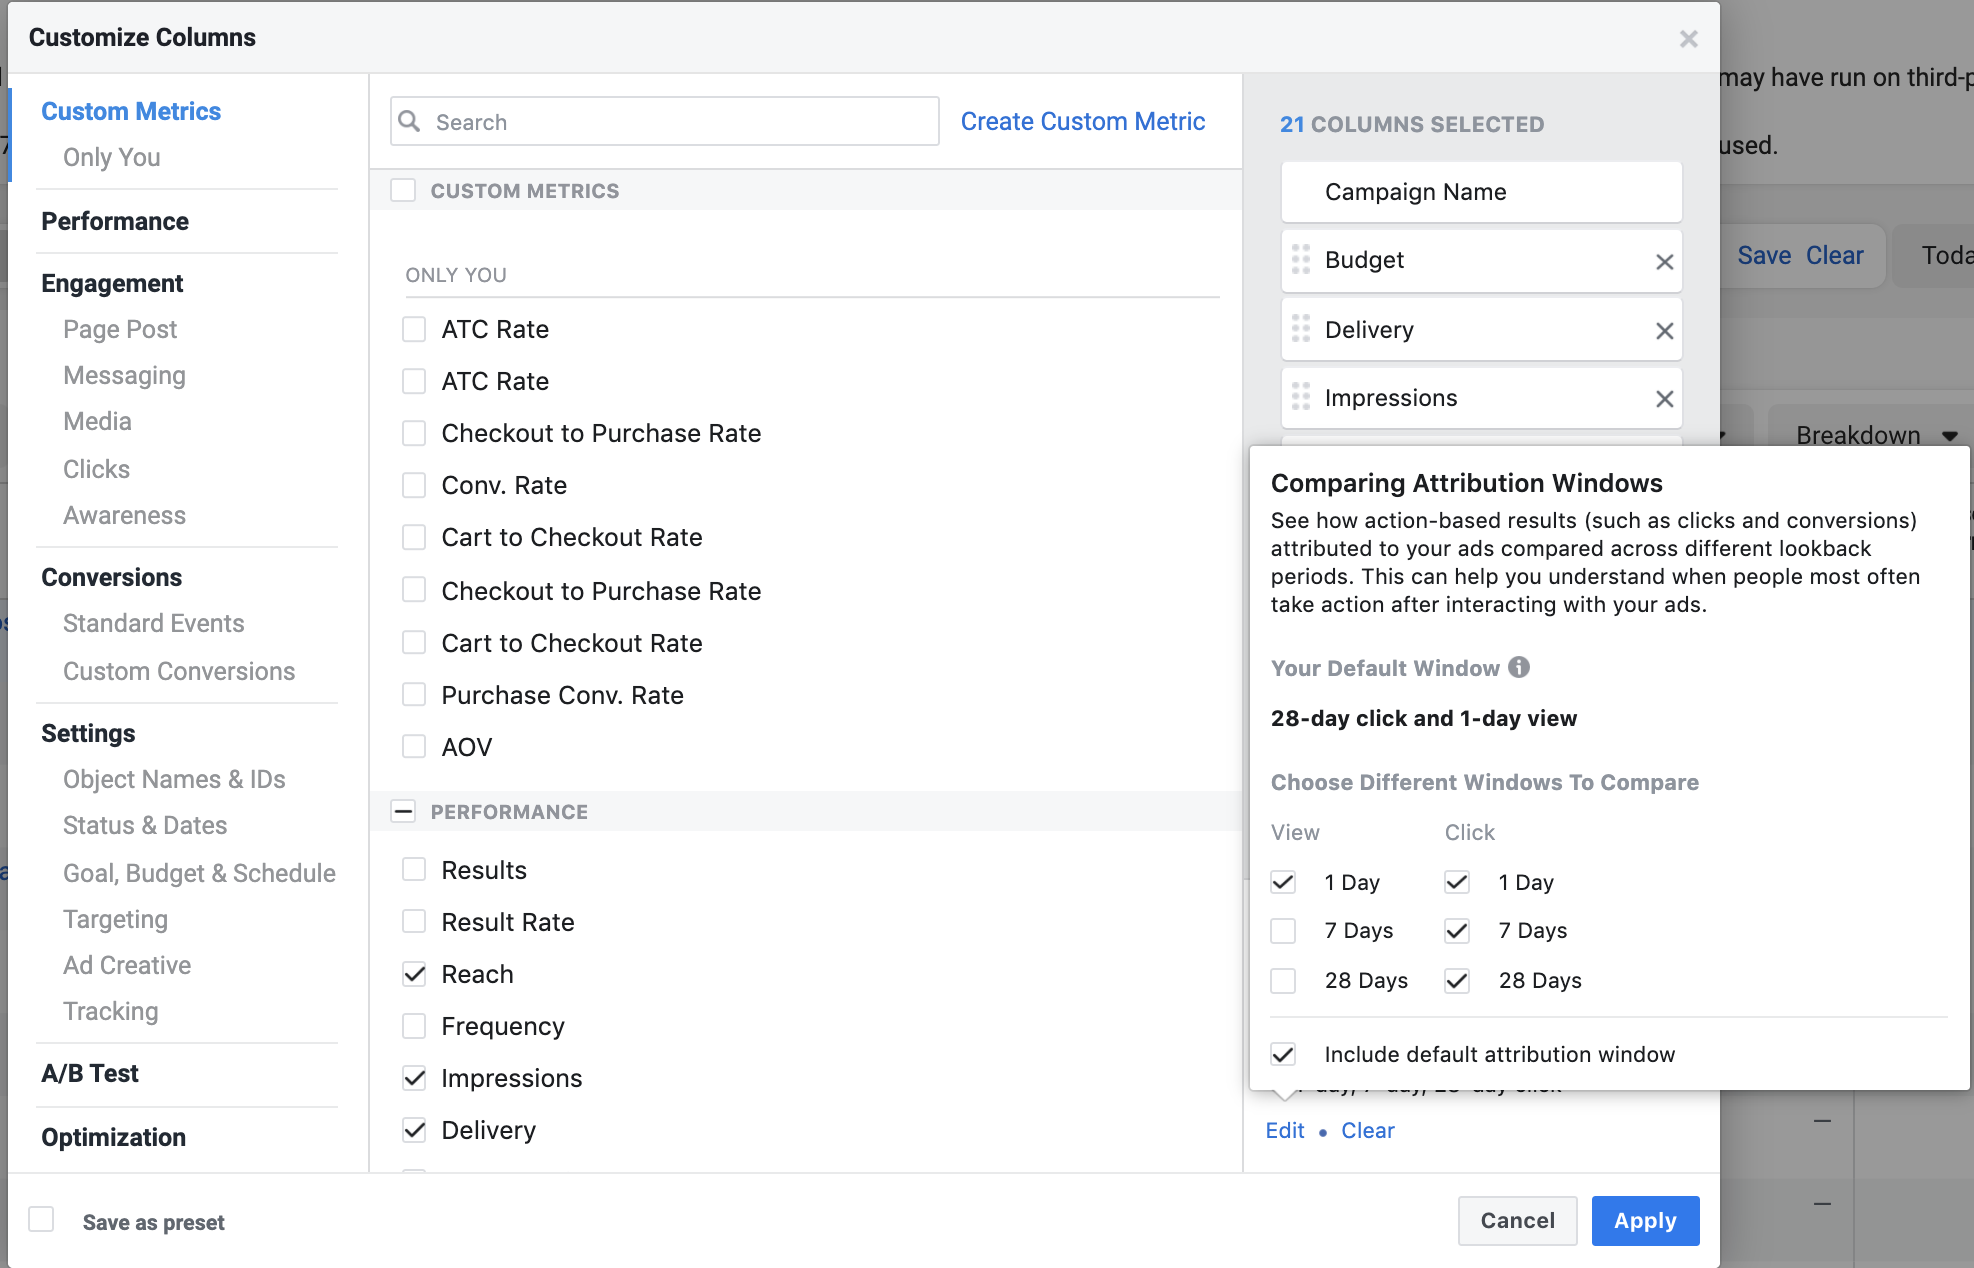 This lets you view ROAS from 1, 7, or 28 days since someone’s click.[/caption]
If our target ROAS is 2, for example, we want to know what our ROAS should look like on a 1-day basis so that we can look at yesterday’s numbers and know what ROAS we need to hit to stay on track.
The first thing you’ll do is add your 1-day view ROAS and 1-day click ROAS. Next, you’ll add your 1-day view ROAS and 28-day click ROAS. If you’re analyzing data over the last 30 days, this will tell you what ROAS you’re seeing a day after visitors click and view your ads, and then the ROAS over your full attribution window.
After that, divide your 28-day click and 1-day view ROAS by your 1-day click and 1-day view ROAS. This will give you your delayed attribution difference.
Once you have that, divide your target ROAS by your delayed attribution difference. This will give you a 1-day ROAS target so that you can make sure you’re making progress toward your goals in the short term.
[caption id="" align="aligncenter" width="590"] It’s a lot of math. Google Sheets makes it a little more bearable.[/caption]
That might seem like a lot of math, but it’s better than waiting a whole month to find out whether you hit your goals!
One last note on understanding your Facebook ads ROAS. Generally, you should expect your ROAS from new visitors (prospecting) to be lower than your ROAS from returning visitors (remarketing). Because you need a steady stream of new visitors to keep your remarketing audiences filled with new prospects, aim to meet your ROAS target at the account level rather than expecting each individual campaign to meet your ROAS target.
What is a good ROAS for Google Ads?
Just like with Facebook, delayed attribution can impact your ROAS, and your Google Ads ROAS will also depend on the kind of traffic you’re targeting. Generally, searches for your own brand will yield the highest ROAS. This is usually followed by remarketing audiences, shopping campaigns, and non-brand search.
Online advertising campaigns more focused on awareness, like upper-funnel Display and YouTube, will tend to return a lower ROAS, but can be useful for acquiring new email addresses. Shopping campaigns typically make up a larger portion of the budget for clients of ours at KlientBoost.
Before diving deeper into ROAS calculations, let’s talk about a few basic tactics you can use to make sure your account isn’t getting in its own way.
First, if you’re still using manual bidding, give smart bidding strategies like target CPA or target ROAS a shot. If you’re like most digital marketers, you like to control the process, but it’s ok to let go of this area. (Bidding is all math, and computers are good at math. We promise.)
If you have accurate conversion tracking and at least 50-100 conversions per month, you’re in a position to benefit from smart bidding, but if you’re still reluctant, you can create an experiment to split the traffic 50/50 against your current bidding strategy.
Second, machine learning is taking over Google too. If you’re thinking “account simplification,” you’re on the right track. If you apply smart bidding to a campaign that’s loaded with dozens of ad groups, this could hinder the results you get from smart bidding, instead cut down on ad groups that generate low amounts of traffic. It’s ok to have granular targeting but use a separate campaign to make smart bidding’s job as easy as possible.
How to Forecast Google Ads Conversion Delay
With basic tactics covered, let’s talk about delayed attribution in Google Ads and what it’s doing to your ROAS. This is more often referred to as “conversion delay”. If you’ve ever seen a blue dot next to the main chart in your Google Ads interface, your account experiences some level of conversion delay.
[caption id="" align="aligncenter" width="590"]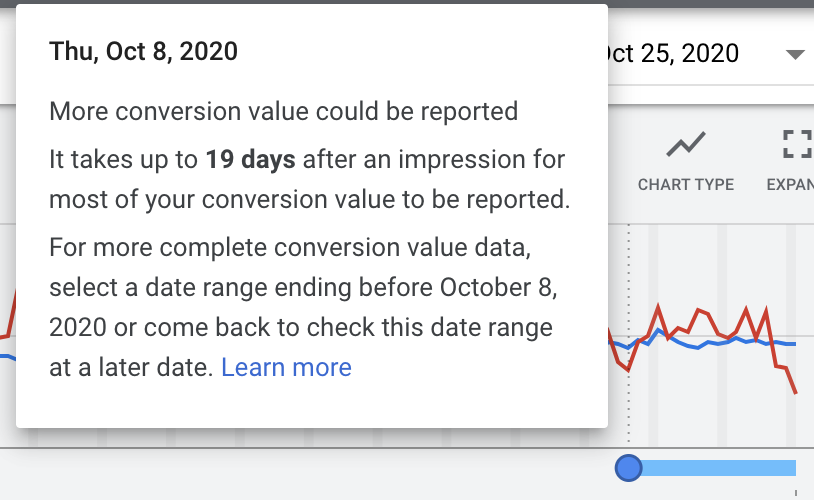 Your value will look different because this message is based on data from your account.[/caption]
Like Facebook delayed attribution, conversion delay represents the gap (in days) between when people click your ads, and when they make their purchase. When a product is pricier or more complex, this gap tends to widen as your customers will give themselves more homework to do during the buying process.
What does all this have to do with ROAS and why should you care? As with Facebook, understanding your conversion delay will help you plan your account growth more accurately because you won’t have to wait until next month for your delayed conversion value to kick in. You’ll have a better understanding of the ROAS targets you need to hit in the short term.
To understand your account’s conversion delay, go to the Tools & Settings menu in your account, then go to attribution. Once there, click path metrics. This table will tell you how many days it takes or your customers to buy from their most recent ad click.
To calculate your conversion delay, you’ll want to download this data to a spreadsheet. This will let you map out how much of your revenue should be accounted for by the number of days since the last ad click, and let you tie it back to your ROAS target.
[caption id="" align="aligncenter" width="590"]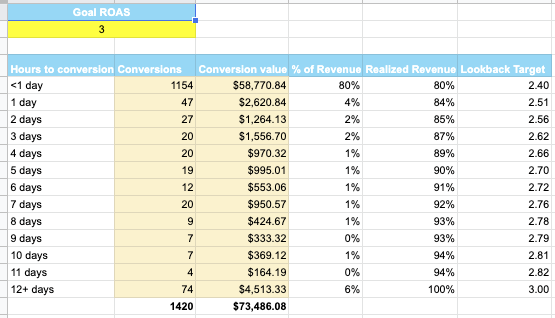 We’re calculating the percent of revenue realized by day and using that to figure out our proportional ROAS.[/caption]
It may seem complicated, but there’s a good tradeoff here. If you know what kind of ROAS your campaigns need to generate in the short-term to meet your long-term goals, you’ll spend a lot less time scrambling over bids and budgets trying to make sure you’re on track, because the ROAS will look lower in the short-term.
4 Strategies to support your ROAS in the long-term
Having a clear strategy with ongoing adjustments to support your strategy is crucial to maximizing your ad account’s ROAS, but that doesn’t mean your eCommerce store needs to live and die by that ROAS. Changes in competition and seasonality can affect your ad costs and conversion rates. Don’t let these fluctuations put you through feast or famine cycles.
1. Use Email Marketing to Your Advantage
Emails today equal revenue tomorrow. As such, email marketing is one of the best ways to get more mileage out of your ROAS.
How so? 95%+ visitors to your site won’t buy from you on their first visit. This immediately hurts your ROAS from visitors discovering you through prospecting efforts via paid social or non-brand search. You can (and should) bring those visitors back for a second chance to buy through remarketing.
But who says that’s the only way to do it?
Email capture popups can help add another 5-15% of visitors to your email list. Subscribers don’t automatically translate to more money in the bank. You still have to put out effective email communications, but adding subscribers does help offset your ad costs by:
- Adding new visitors to a list that you own
- Growing a channel that doesn’t make you pay per click or open
- Having a channel where you can communicate with customers long-term
Email marketing campaigns can be especially helpful to your ROAS in the months leading up to the holidays. Email marketing makes up 27% of revenue for eCommerce retailers during Q4, and on top of that, 60% of 2019 Cyber Weekend sales were driven by consumers who engaged with a brand’s email prior to Q3.
While we don’t have time to get into detail on email marketing, here are a few places you can get started:
- Welcome Series: Don’t let a new subscriber hear crickets. Introduce yourself. Why do you exist? Why should they love your brand? Throw in a small discount if you can.
- Cart Abandonment Series: People abandon carts, but it doesn’t have to stay that way. Create an automated sequence to follow up with cart abandoners. Make sure they don’t have any objections and help them complete their purchase.
- Customer Winback: Has it been a month or even a few months since someone bought? Let them know if something they’ve had their eye on is back in stock or if you’ve added an exciting new product. Make the effort to stay in touch, and offer something valuable.
Not everyone wants to buy from you on the first click. In fact, most people don’t, but email marketing lets your customers get to know you over a longer period of time. Some will hold out for discounts, some just want to get to know you better, and even if it doesn’t happen right away, turning an extra 5-15% of your clicks into customers over time is the right thing to do for your ROAS.
2. Offset Your Advertising Costs with SEO
Speed and control are on your side with paid ad campaigns, but you can offset some of these advertising costs by investing in SEO. For example, if a keyword costs you $4 per click, you could potentially save $400/month in advertising costs by ranking high enough organically to get 100 visits per month. Or you can just use it to add even more fuel to your growth engine.
Two ways you can get started with SEO are by having sound technical SEO and having a content strategy that educates and delights your prospects.
For technical SEO, do the title tags on your product pages line up with how people search for your products? Are they clear and descriptive?
On the product page itself, do you offer unique, detailed content that gives a potential customer everything they need to know about your product to make their buying decision? This question is worth spending some time on since your product pages are practically doing the heavy lifting of a brick and mortar sales associate.
Outside of product pages, your content strategy should touch on themes that your customers will care about. For example, if you sell kites, do you have content about how to fly a kite? Advanced kite-flying tutorials? Sure, it’s a cheesy example, but don’t ignore the kernel of truth here: if you’re offering your customers nothing other than a transactional experience, they’ll eventually shift to a brand that better understands their emotions.
3. Improve Your Conversion Rates with Chatbots
If your online store has ever had a brick and mortar component, you’ve probably seen that your brick and mortar store has a higher average order value. There’s nothing crazy about that because in your store, there are sales associates to help your customers find what they need, compare different options, and point out relevant benefits. Online, a lot of this work is left to a single landing page or product page, but what if you could replicate the effect of having an in-store associate?
You can use chatbots to help your customers find a product they’re looking for, learn more about your brand, and even answer simple questions. This might sound like overkill for conversion rate optimization, but, customers reported site navigation as one of their biggest frustrations.
While ongoing testing and optimization will make your site better over time, an automated chatbot can help fill in the gaps without skyrocketing your customer service costs.
4. Build Subscriptions, Referrals, and Loyalty into Your Offerings
If there’s one takeaway you get out of this post, it’s this: you’ll generate more earnings from loyal, existing customers than from trying to acquire every new customer you can. Let’s talk about a few ways you can add some spice to your offerings.
Subscriptions offer a chance to generate more predictable revenue from existing customers. If you’re thinking this doesn’t apply to you because you don’t sell something like food or supplements, don’t skip this paragraph yet. You don’t have to sell something consumable to create a subscription.
Cuts, an apparel retailer, created a program where members get two shirts of their choice per month at up to 36% off. Not everyone will sign up, but their most loyal customers will. And this predictable revenue will add up over time.
[caption id="" align="aligncenter" width="590"]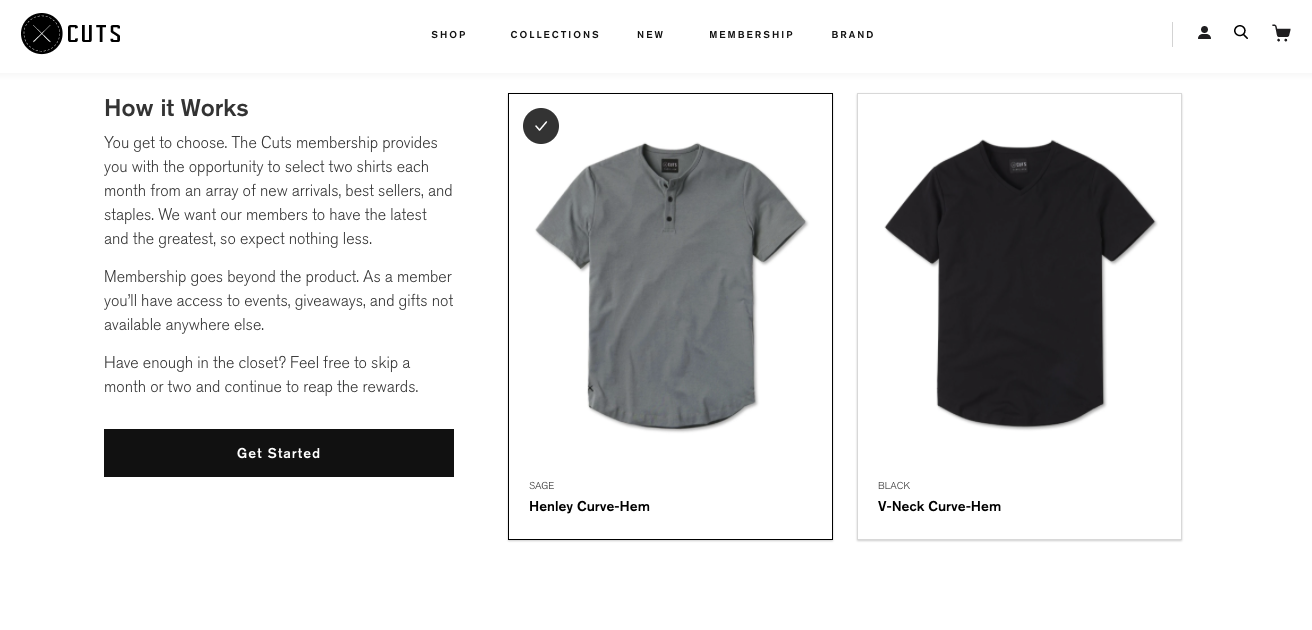 Get creative. Reward your customers for liking you.[/caption]
Referrals are another great way to leverage your existing customers. Customers who love you are the likeliest to refer their friends, and what does that do? Attract more high-value customers. (A real-life lookalike audience, if you will.) And make it worth their while.
Consider splitting what you’d typically pay for a customer between the two parties, and give it to them upon purchase. Because it’s offered upon purchase, this kind of investment is virtually immune to unexpectedly low ROAS.
If you’re ready to go the extra mile, loyalty programs get returning customers even more excited to shop with you. 81% of customers said loyalty programs made them want to continue shopping with a brand, and 66% said they’re willing to modify their spending to get the most benefits.
Rhone, for example, offers its loyalty program members free 2-day shipping on all orders, accumulated points, and other perks.
[caption id="" align="aligncenter" width="590"] For now, the program is free to join.[/caption]
Loyalty programs aren’t one-size-fits-all. Monitor engagement with your loyalty program like you would other marketing efforts to make sure your customers are getting value out of it. If repeat purchases decrease, you’ll be more sensitive to temporary fluctuations in ROAS.
So, as we said, there is no such thing as a “Good ROAS”
ROAS is a relative metric. How you interpret your ROAS begins with your AOV and the cost of goods sold and ends with the money your customers spend with you after their first purchase. A bad ROAS for other eCommerce companies could be a great ROAS for you—and vice versa.
To understand the ROAS your ad account’s reporting, you’ll want to make sure you understand the account’s delayed attribution and the different parts of the funnel your campaigns are contributing to. Products with higher price and complexity will have longer delayed attribution. Colder audiences will report lower ROAS.
Once you understand where your ROAS is, and find that it isn’t even close to where it should be, get back to basics. Is your AOV high enough to sustain the costs of paid advertising? Do you have a strong customer retention strategy in place?
Are you using other marketing channels, like chatbots and SEO, to help offset your costs and generate sales organically?
eCommerce marketing is a three-legged race, and paid ads only make up one of them.
