I don’t know who needs to hear this, but you don’t have to customize your Facebook Ads reporting columns every single time you log in.
(I needed it. Entry-level, just-starting-out Lauren badly needed to hear this.)
Every second of your day is valuable. You deserve to make things easier for yourself.
If you’re spending more than 10 minutes of each day, adding, subtracting, and customizing columns within ad manager…there’s a better way.
Once you do the initial work of figuring out how to accurately report on your Facebook Ads, the hard work is over. With your key performance indicators (KPIs) in hand, we’re about to make your life a whole lot easier.
You’re about to get a clear understanding of how Facebook ads reporting works, why you should review advertising analytics regularly, and how to streamline the process with templates.
Get brand new Facebook ad strategies straight to your inbox every week. 23,739 people already are!
What are the benefits of Facebook ad reporting?
If you’re running Facebook ads, you need campaign analytics. Here’s what you can do with reports:
Monitor key performance indicators (KPIs)
What goals did you set for your Facebook ads campaigns? Reports can help you understand if you’ve reached them successfully—or if you’re missing the mark. With ad reports, you can monitor KPIs for everything from impressions and reach to engagement and clicks to in-app and off-page conversions.
Benchmark campaign performance
How do your campaign trends look over time? With Facebook ad reports, you can see whether your ads are continuing to improve or if performance is declining. They can also help you determine what’s typical for your ad account so you can budget more effectively.
Identify ways to optimize campaigns
Do you want to get better results from your paid campaigns? The detailed reports in Facebook Ads Manager can pinpoint what’s working and what isn’t. From campaign types and optimization events to target audiences and creative assets, you can gain valuable insights and optimize your ads.
How to get the best four Facebook ad report templates
Whether you want raw data, visual charts, or side-by-side comparisons, Ads Manager has the report you’re seeking. Here are four types of Facebook ad report templates to add to your workflow.
Ads Manager analytics
When you first open Ads Manager, you can see analytics for all current and past campaigns. You can click through the tabs to view analytics by campaign, ad set, or ad. You can also use the filtering options to set a specific time frame, or you can search for certain campaign or ad set names.
By default, Ads Manager displays a set of columns labeled Performance, which shows data like Facebook ads budget settings, delivery status, and bid strategy. You can use the Columns dropdown menu to choose another preset option, such as Performance and Clicks or Targeting and Creative.

Although these preset options can help you access Facebook ads data efficiently, they may not answer the unique questions your team has about campaign performance. To display the data you need, choose the Customize Columns option from the dropdown menu.
Then add all the performance metrics you want to track and drag and drop them into the optimal order. For example, you may want to monitor metrics like results (which shows the results that match the objective and settings you selected while creating the ad), cost per result, click-through rate (CTR), cost per click (CPC), and conversion value.

Then click the Save as Preset box so you can return to the same settings every time you open Ads Manager. You can also click the Set as Default option in the Columns dropdown menu to ensure you always see the most relevant data every time you open Ads Manager.
To access more detailed results, click the Breakdown button and choose how to filter the data. For example, you can view breakdowns by demographics, devices, placements, and platforms. That means you can see how your ads were distributed across the news feed, Stories, and other placements. You can also see breakdowns by day and time or by user actions.

Note that breakdowns can show metrics for in-app actions only, such as reach, impressions, engagement, and clicks. Because of iOS 14 privacy limitations, Ads Manager no longer shows breakdowns for off-site results, such as website or mobile app conversions.
Ads Manager charts
Raw data can help you check campaign performance during a particular time frame. But when you want to view results over time, compare results to previous periods, or identify trends, charts are essential for visualization.
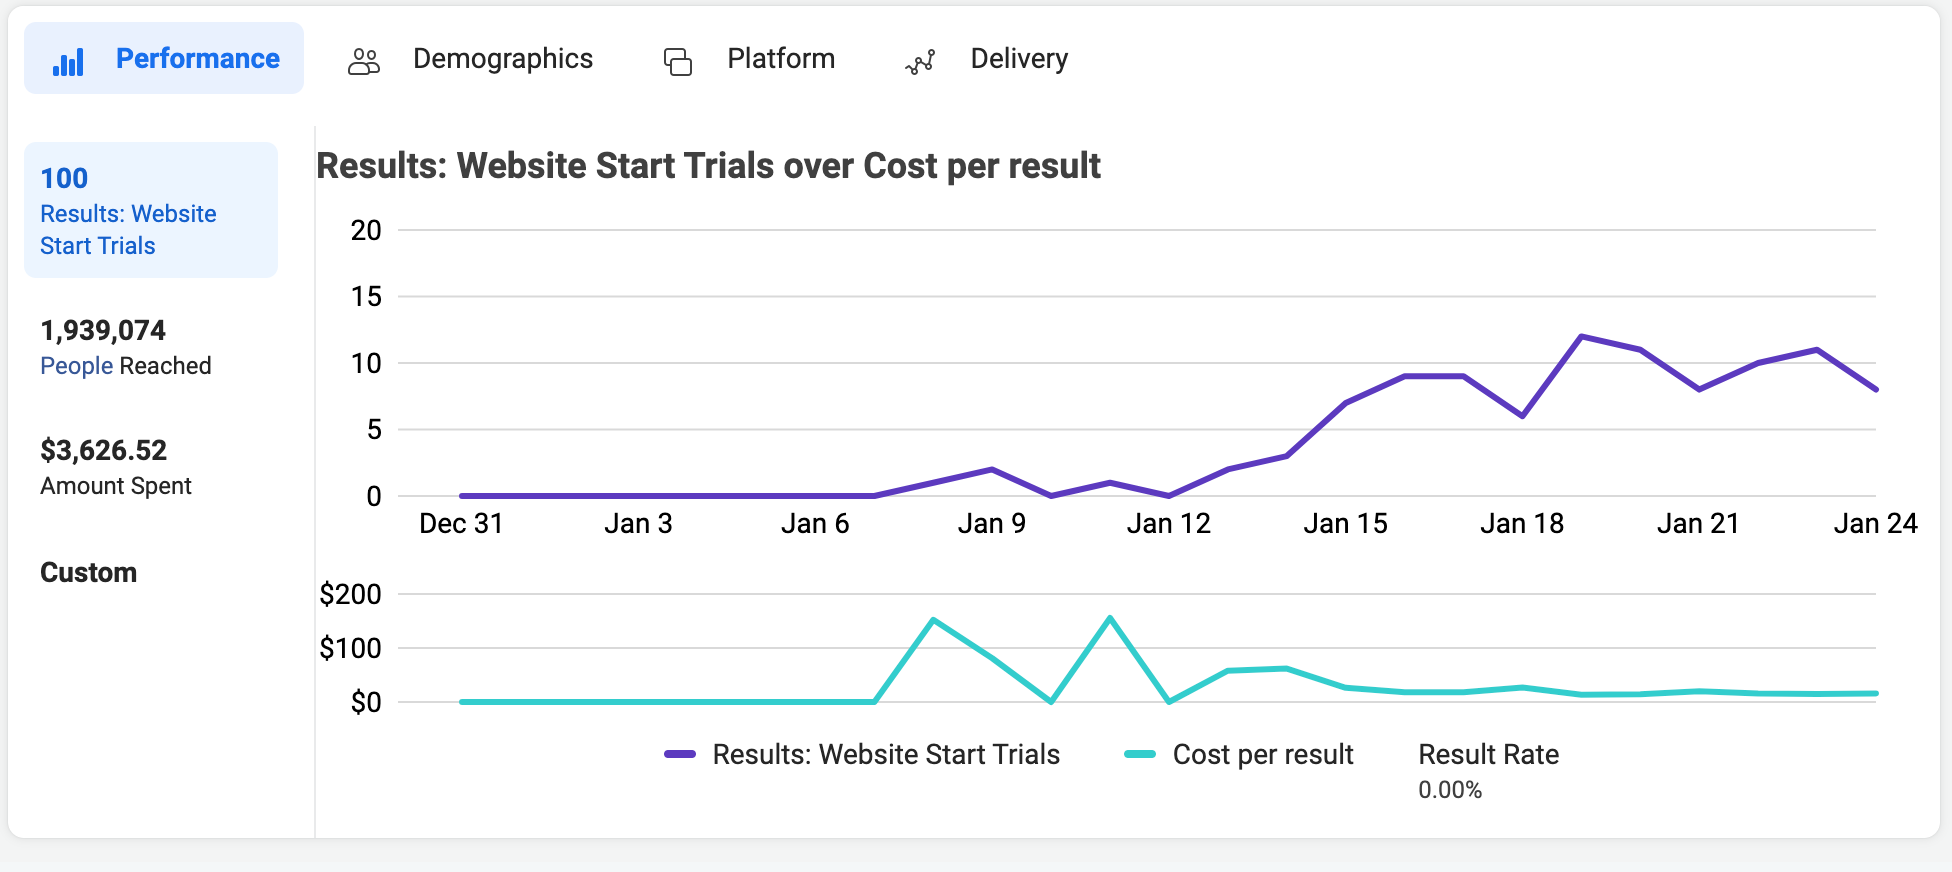
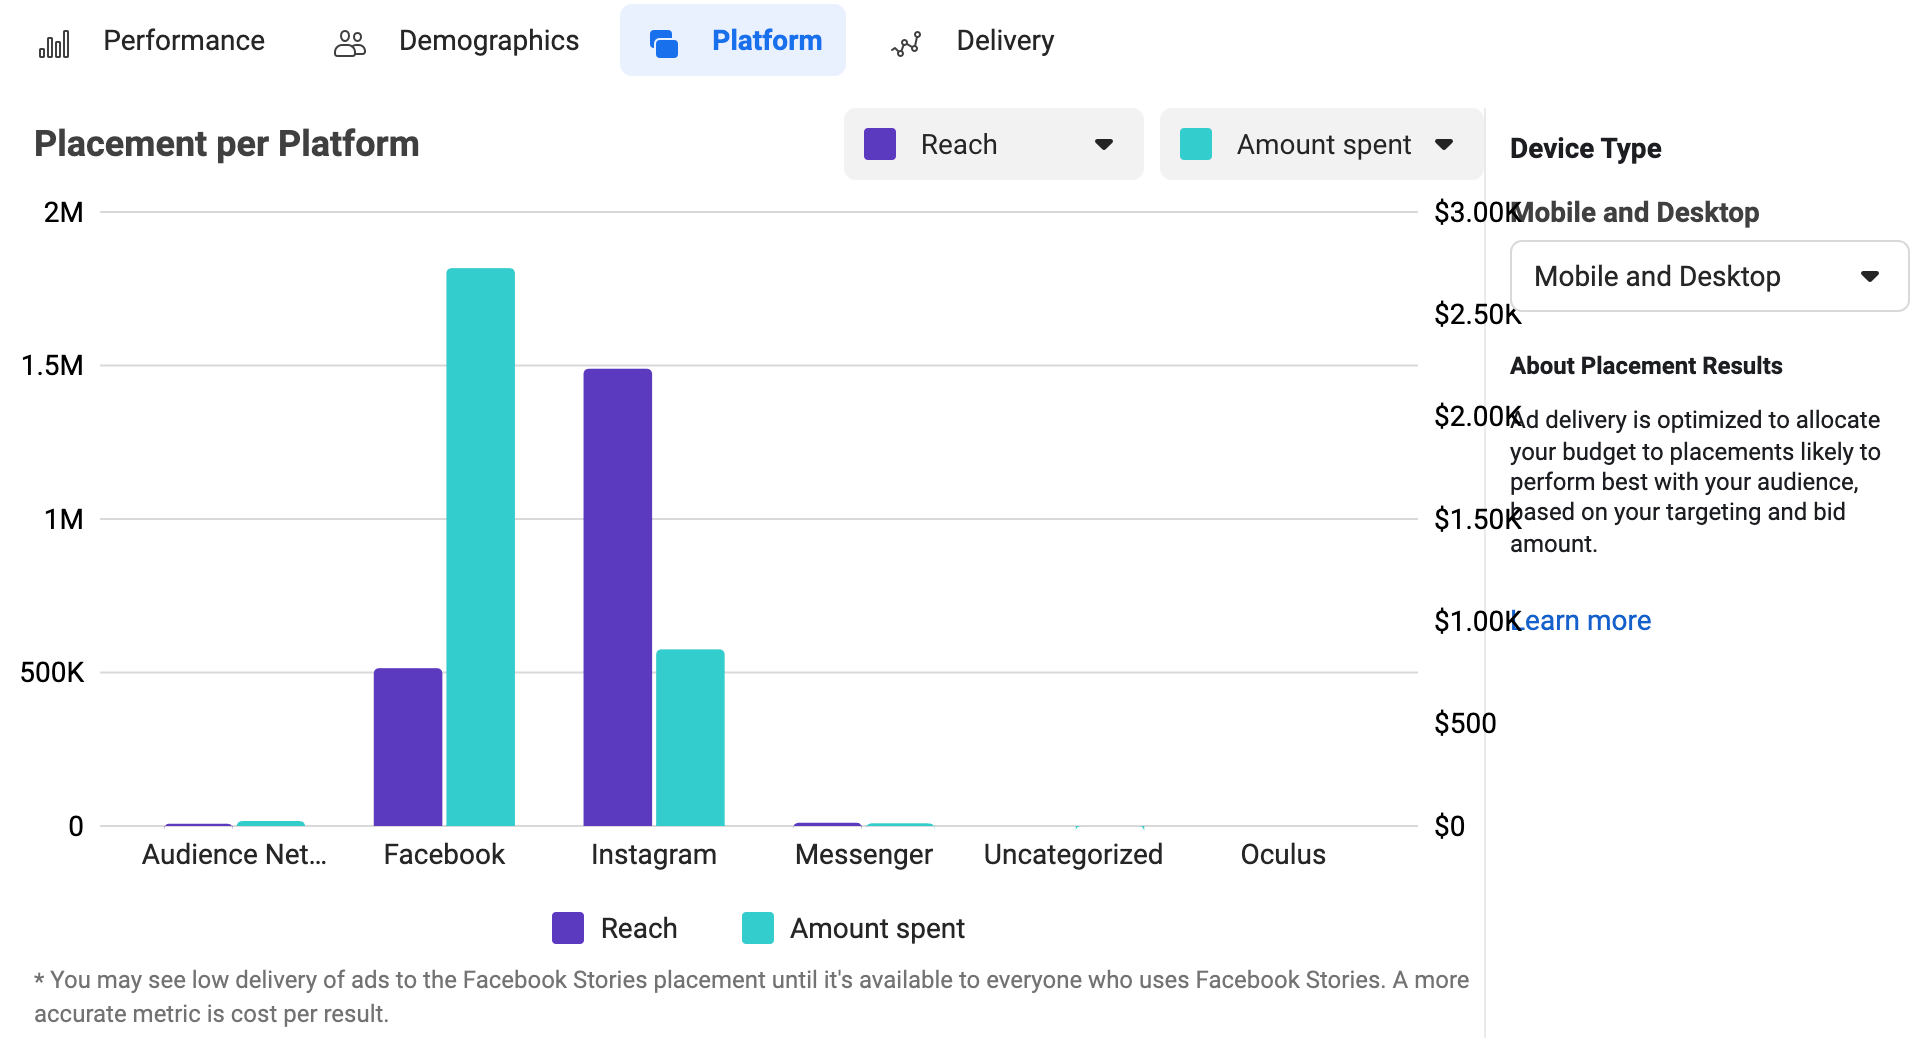
To access visual data for your Facebook ad campaigns, check the box next to the campaign, ad set, or ad you want to review. Then, click the “See Charts” icon at the top of the edit sidebar on the far right. You can see chart views for performance, demographics, platform, and delivery. In the performance tab, you can customize the metrics you see in your chart by clicking the “Custom” tab at the bottom left.

Then look for patterns. Is your reach declining over time, or is your cost per 1,000 impressions (CPM)increasing dramatically? Is your ad set generating far fewer results compared to the previous time period? If your campaign performance is declining rather than improving, it’s time to start optimizing your Facebook ads.

Are you curious about Facebook ads placements and demographics? Although Ads Manager charts don’t offer in-depth breakdowns, you can get a basic understanding of how Facebook distributed your ads across Facebook, Instagram, Messenger, and other platforms. If the demographics or platforms don’t align with your target audience, you may need to use detailed targeting to reach a more relevant audience.
Ads Reporting
When you want to switch between data and charts seamlessly and download performance reports to share with your team, use Ads Manager reports. There are two ways to access your Facebook ads reports:
- Click the Reports button on the right in Ads Manager and either export the current table, create a custom report, or choose a premade report from the dropdown menu.
- Go right to Ads Reporting and choose one of the available report templates.

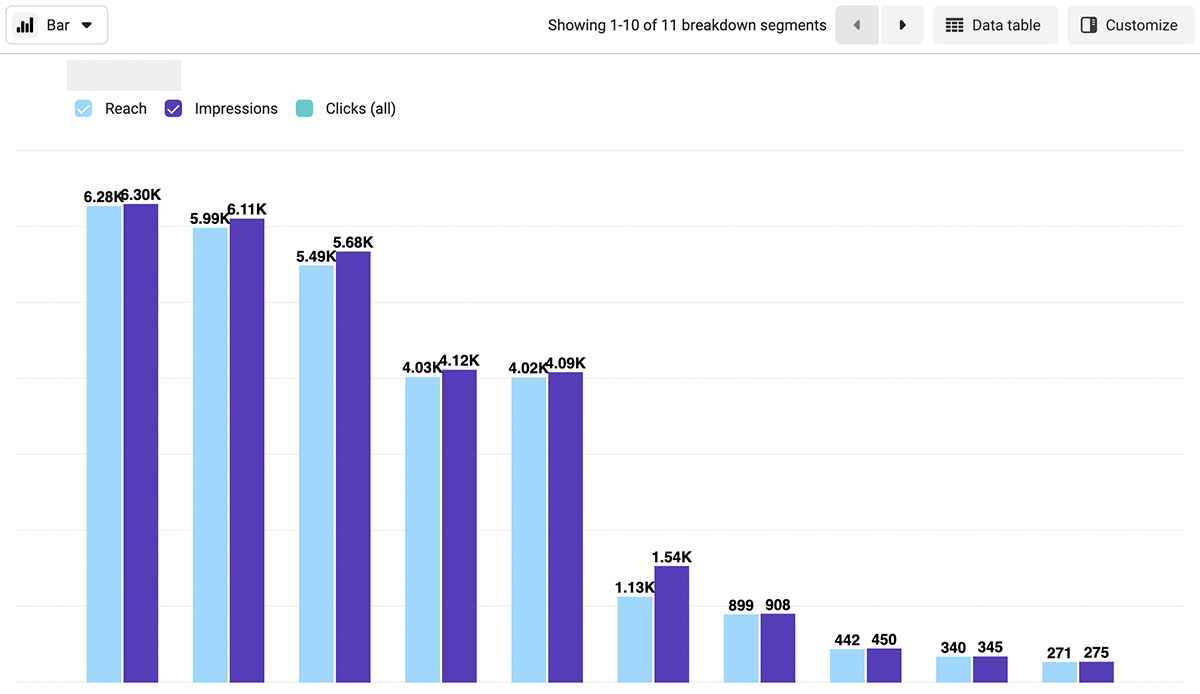
Once you’re in Ads Manager, you can use customization options to change the metrics that display in the table or choose breakdowns to organize the data. You can also toggle between pivot table, trend chart, or bar graph views for easier processing.

If you don’t spot the breakdowns you want in the list of available options, you can create a custom breakdown for your team. Select filters in the custom breakdown creation process to create segments that help you gain deeper insights into your campaign performance.

When you’ve created a view that has the data you need to analyze campaign performance, you can save it to your Ads Reporting account for quick access. You can also export reports as Excel files or images to present to your team. Alternatively, you can share a link to your report for others to view.
With Ads Reporting, you can easily manage and update reports so you can review campaign performance efficiently. You can also share your most useful reports with colleagues who have access to your organization’s Ads Manager.
Creative Reporting
If you’re testing multiple creatives or experimenting with new iterations on existing assets, then Facebook’s Creative Reporting tool can help. This tool provides an overview of creative performance and automatically highlights creatives with the best and worst results.
You can identify best and worst creatives based on a variety of metrics, ranging from cost per result or purchase return on ad spend (ROAS) to CTR or reach. You can also compare results based on the custom conversions you’ve created for your Facebook Pixel in Events Manager.

Using these visual comparisons, you can make decisions about your organization’s creatives—quickly. You can figure out which Facebook ads to scale, which need more testing, and which need new iterations. You can also spot the creatives that would be best to stop running.

Facebook’s Creative Reporting tool also offers creative-focused tables, charts, and breakdowns that are similar to Ads Manager’s built-in tools. That means you can view charts, browse your saved tables, and use breakdowns to analyze your creatives.
Does reporting ads on Facebook do anything?
Do your reports show that your Facebook ads are falling short of your KPIs? Does it seem like your campaigns underperform, no matter what you do?
In certain cases, your Facebook ad reports may not have all the answers you need. Instead, the problem may stem from reports against your Facebook ads or your Facebook page.
Facebook users can report ads for any reason, but the most common complaints are sensitive topics and bad targeting. Over time, too much negative feedback can prompt Facebook to remove your ad from the platform.

Negative feedback on your Facebook page or in your Facebook shop can also compromise your ad account performance. Meta has confirmed that if a business receives excessive negative feedback on Facebook, its ads may face delivery restrictions.
It’s essential to maintain the quality of your paid and organic content and to build well-targeted ad campaigns. But if you suspect that your page has received a lot of negative feedback, you can check your Facebook account quality and resolve outstanding issues.
Get the answers you need from Facebook ad reports
From campaign trends to creative reports, Facebook ads reporting tools have all the data you need to track paid social performance. With guidance from an experienced Facebook ads agency, you can gain advanced insights and make smarter decisions about your ad campaigns and your paid social strategy.