There seems to be an endless sea of Google Ads PPC Stats floating around the SERPs these days. And if you don’t know which metrics are valuable and which are valueless, you can find yourself completely rewriting your campaigns based on bogus Google Ads PPC Stats you read in some unqualified blog or study.
“The key to extracting the value for statistic driven blog posts is to understand what KPIs (key performance indicators) are guiding your own PPC campaigns.”
Otherwise, you might very well find yourself in worse waters than you were in before. This is often where the expertise of an actual PPC management agency can come in handy.
Get brand new Google ad strategies straight to your inbox every week. 23,739 people already are!
The Agency Versus In-House Debate
First, I’ll set the scene with a brief background on the debate between in-house and agency PPC work. We’ll cover their pros, their cons, and their different value points.
Then we can get to the good, meaty stuff: Google Ads PPC stats.
Now – to be clear – nobody is knocking in-house PPC analysts. It takes a truly brilliant mind to juggle not only the client relationship side of a PPC manager’s job while also understanding the best way to strategically target their ideal prospect, where they are in the funnel, and how best to manage the budget.
Heck, I’m getting stressed out just thinking about it.
But there is a well-known in-house versus agency debate when it comes to the ROI and efficacy of digital marketing investments.
Questions like the ones below become very important when you’re considering in-house PPC management or outsourcing to an agency dedicated to digital marketing.
- “What kind of goals are you focused on?”
- “Which metrics are you looking to increase?”
- “What is your goal ROAS versus goal ROI?”
These are only a few questions that need to be answered on your end before you start looking into how your agency (or potential agency) handles your campaigns.
The Case For Google Ads PPC Agencies
The case for hiring a dedicated Google Ads PPC agency is fairly straightforward. It usually comes down to a few options. Either:
- You have no PPC experience and are forced to outsource your PPC work
- Your campaigns have grown in size and complexity (and therefore so have the consequences of mistakes and mismanagement) and so you need expert assistance
- You don’t have the time or confidence to manage your campaigns yourself day-to-day
If this is the case, hiring a PPC agency is probably a perfect solution for your work balance. You just need to make sure that whatever agency you choose to go with is running on a payment model that aligns its goals with your own.

This is very important when choosing a PPC agency. Otherwise, you might end up signing an agency that spends all its time and money driving up your click-through rate without increasing conversions or even worrying about traffic quality.
This would in turn only increase your bounce rate and burn through your budget, and leave you having spent more money and having made less – plus you paid the guys to do it for you.
And nobody likes that.
The Case For In-House Google Ads Work
On the other side of the aisle, we have in-house Google Ads work. These teams have their pros and cons as well, a few of which you can check out below:
Pros:
- Keeping your advertising team in-house puts them in direct contact with/control of your brand messaging, which allows them to better mold your ad copy and creative
- There’s no turnaround time when it comes to communicating with your in-house team
- You can rest easy knowing that your in-house team is dedicated to your campaign only
- Obviously, it eliminates the cost of an agency (however, depending on the size of your team, you still have to pay their salaries)
Cons:
- In-house PPC teams often lack the dedicated resources agencies supply their advertising teams with, including full sweets of integrated tools
- PPC agencies and their shuffling culture allow for new idea curation that promotes creativity in your campaigns that most marketers would agree in-house teams lack
- You often have to choose between specialists and saving money from an agency
- Keeping your team small and in-house leaves little room for growth and granularity, as singular employees are forced to take on larger, more generalized roles to manage day-to-day campaigns.
Now, that’s just a short pros and cons list. It’s hardly the full debate between the PPC Agency versus In-House struggle for dominance. And it doesn’t even have stats!
What kind of Google Ads PPC stats post would this be without a single percentage point to boast about?
It’s time we get to the nitty-gritty of this bad boy. So let’s go!
37 Google Ads PPC Stats To Make You Choose Agencies
I’ll be honest upfront, we are a PPC agency after all. So if you were expecting us to skip on a chance to prove how hiring us is a good decision with actual numbers, you’d be wrong.
Below are 37 Google Ads PPC stats that will make you reconsider your in-house digital advertising strategies and make you choose a PPC agency.
1. PPC Averages A 200% ROI
That’s right. According to WordLead, Google Ads on the Google Search Network average and ROI (return on ad spend) of about 200%. In layman's terms, this means that for every $1 an advertiser invests into a PPC campaign on the Google Search Network, they tend to earn $2 back through those ads.
This stat is fairly straightforward, and it speaks for itself. Google Ads is a valuable advertising platform that you can’t afford to skip out on.
2. Paid Versus Organic Was Barely A Thing 3 Years Ago
Back in 2016, Ofcom did a study and found that nearly 50% of internet users in the study couldn’t tell the difference between paid ads and organic results. Granted this was 3 years ago, but it was only 3 years ago. When you take a look at some of the statistics later on in this post regarding the attention span of average users you’ll begin to see how sneaky and versatile even the most basic PPC campaigns can be.
3. Users Clicking On PPC Ads Are 50% More Likely To Convert
There is a long-running debate over which converts better – organic or paid traffic. If you’re new to the debate, it basically stems from the idea that different levels of intent in the purchase funnel match up with different search behavior on Google. So, depending on where you are in the funnel (research, consideration/comparison, purchase, etc), you’ll be more likely to click on different things.
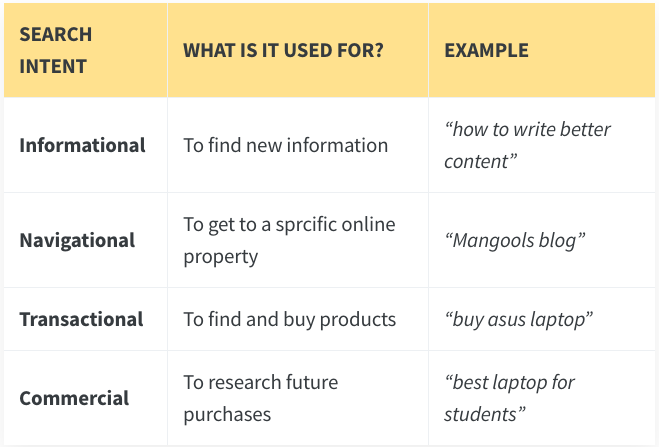
Many people have always believed that organic results, with their highly targeted long-tail keywords, represent the highest level of intent for search engine clickers.
But, according to some actual stats courtesy of Moz, it turns out that clickers of paid ads are actually 50% more likely to convert in the end than organic clickers.
4. The Average Google Ads Click Through Rate (as of 2019)
Across all industries using Google Ads, the average working click-through-rate as of 2019 is 5.06%. Which is doubly significant because this marks almost a 2% uptick in the CTR of Google Ads across all industries.
This means that even though users are growing more wary of digital advertising every day, we advertisers are growing more effective at providing relevant offers and helpful search results.
One more reason why you might want to start looking into partnering up with some experts in the field.
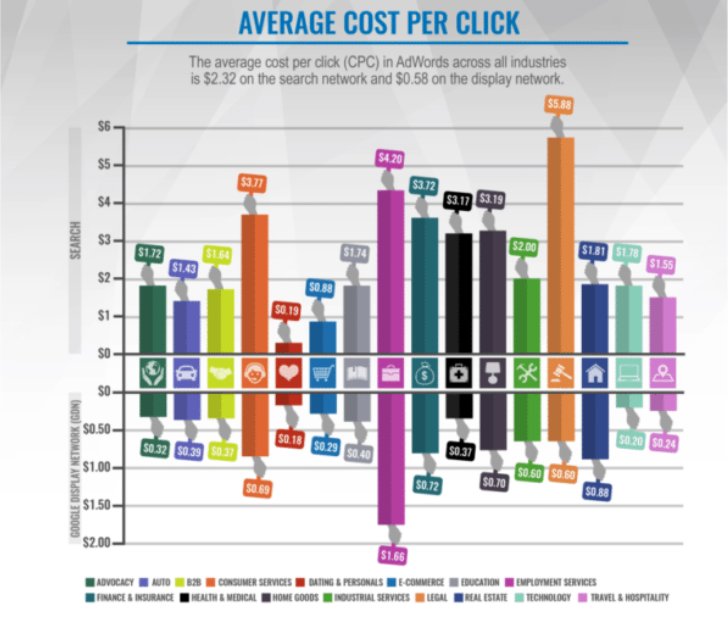
5. Average Cost Per Click For Google Ads (as of 2019)
The average Cost Per Click for Google Ads, as of 2019, sits at about $2.69. Of course this is only an average, and your CPC is going to vary quite a bit depending on the industry you’re advertising in, the keywords you choose, and the quality of your ads. But you can get a general idea of your industry’s CPC in the chart below.
6. Google Ads Dominates Over 37% Of The Market
Out of all existing PPC platforms, Google Ads alone dominates over a third of the entire market. 37% is no small number, and when it comes to walking the walk and talking the talk there’s a reason that so many digital advertisers turn to Google Ads to manage their PPC campaigns, regardless of size.
7. And Facebook Eats Up The Rest WIth 20%
After Google’s whopping 37.2% comes a heaping 19.6% allocated just to Facebook Ads. That’s nearly 1/5th of all paid ads traffic being generated from Facebook Ads. This also means that combined, Google Ads and Facebook constitute over half of all paid advertising platforms.
And when you understand the power of Facebook remarketing when partnered with Google Ads, you’ll really start to understand the value.
8. Other Platforms Have Their Perks, BUT...
You may have seen on certain posts that the less popular advertising platforms like Bing (now called Microsoft Ads) have their own unique benefits like lower CPCs etc. While it’s true that Bing’s CPC is about 33% lower than you see on Google Ads’ averages, it’s lower for a reason.
There’s Less People Seeing Your Ads.
It’s quite simple. If you want to pay less for less people to see your ads and risk having your audience (or far worse), then falling prey to the Bing “magical CPC stat” is right up your alley. But for the rest of us...well...let’s just say there’s a reason that statistic hasn’t fooled all of the digital advertising community yet.
9. Pay-Per-Click Advertising Top 3 Conversion Generator
According to Formstack, who focused their study on the generation of tangible on-page conversions as opposed to blackbox CTRs, CPCs, and Quality Scores that vary by industry and keyword, saw that PPC is still one of the top three generators of conversions and revenue.
10. Nearly 80% Of Marketers Preach The Power Of PPC
I wouldn’t want to say that just because 80% of people are doing it that it’s the right thing to do. But I won’t hesitate in saying that it’s probably worth checking out. And PPC is no different.
In their State of PPC Report for 2018-19, Hanapin Marketing stated the importance of PPC in the modern advertising world and cited the fact that 79% of marketers say PPC is vital to their business as proof.
11. Last Year, More Than 60% Of Marketers Increased Their Budget
The same study from Hanapin also reported that 62% of digital marketers would increase their budget going into the new year. More than half of the survey audience agreed with the statement and, twelve months later, the number actually jumped up from its original 62% prediction to a total 68% amount of marketers increasing the advertising budgets for PPC.
12. Almost Everyone Uses Search For Local Business
I know that “almost everyone” isn’t a useful Google Ads PPC stats. So, what about 97% of consumers using the internet to search relying on Google Ads for local search results to connect with local businesses.
That a powerful enough stat for ya?
Thought that might make you want to get in the PPC agency game.
13. More Than 65% Of Users Click On PPC Ads When Purchasing
Not only does the mass wave of digital consumers rely on the google search network for shopping, they’re also more likely to convert in the long run as well. With over 65% of internet users clicking on ads when making a purchase, you can rely on the PPC audience you’re targeting to be slightly more attuned towards conversion than any ordinary audience you may stumble across online.
This can help you weigh out your decisions when adjusting your campaigns for quick wins or long term remarketing campaigns, as each will alter how you spend and earn in the short term and long term of your campaigns.
14. 92% Of Ads Apparently Go Unnoticed By Users
Ad blindness. All digital advertisers talk about it but few talk about its perks. The truth is that not every instance of your ad being glanced over is a tragically missed impression. Sometimes letting a few ads slip by some unattentive eyes is just fine for your ad spend and your CPC.
You don’t need every single potential user to fall into your audience to see your ad. And, according to KOL, the harsh reality of the matter is that the vast majority of users probably aren’t going to see your ads. In fact, 92% of your ads aren’t even going to be noticed by users.
15. Over A Quarter Of Online Consumers Now Use Ad Blockers
That’s right, over 27% of users are now currently using Ad Blockers. And that number is still increasing Year Over Year (YoY), meaning that the bar is continuously rising on how relevant and high quality and informative your ads need to be to make it by the scrutinizing eye of today’s digital consumers. And that’s where our expertise helps.
16. Since 2017, Users’ Ad Dissatisfaction Has Dropped To 1%
Back in 2016 and 2017, user dissatisfaction with paid ads was around 7%. While that’s not the highest, in the past few years it’s managed to drop all the way to 1% last year. This is coupled with the fact that ad blockers have increased in popularity over the years as well.
What does this mean for your actual PPC campaigns? It means that the standard for relevancy of your PPC ads has been raised a significant amount in the past 2 years alone. Which isn’t a problem if you know how to write expert PPC ad copy and know your way around common landing page anatomy.
17. More Than Half Of Digital Marketers Still Want Bigger Budgets
According to Search Engine Land, 61% of digital marketers wanted bigger budgets to boost the efficacy of their digital campaigns in 2019.
Now compare this stat to the fact that Compare this to the fact that last year over half of digital marketers already increased their budget. It becomes clear from the overlap just how effective a truly powerful and dynamic PPC budget can be.
18. Google Takes Up 92% Of Search Engine Specific Market Share
Google may take up 37% of the total PPC platform market share. But when it comes to actual search engine market share, what was once a Goliath turns into one heck-of-a Godzilla.
The search engine titan reigns in 92% of all search engine searches, according to the last report in September of 2019. This means that if you’re looking to engage with a classic search engine advertising audience, there’s no better place than the “Big G.”
19. Google Earned Over $116 Billion From Google Ads Alone
In 2018 alone Google earned over $116 billion just from their Google Ads clicks. Take a second to think about that. In the pay-per-click space over $100B was spent on clicks in a single year alone. And this number is on the rise year after year after year.
This means that, regardless of its monopoly of the search engine market space and overwhelming PPC market share, Google is continuing to grow its user base and it’s engagement rates to favor that of the advertiser. Or – to be clear – the qualified advertiser. Because believe you me, with the way these numbers are increasing, costly PPC management mistakes are more devastating than ever.
20. Of All Those Clicks, Over 40% Went To Top Three Results
It’s no surprise that the search engine titan is capable of generating such a massive amount of revenue from paid ads alone. More important than the amount being spent on paid ad clicks, however, is where the clicks are occurring.
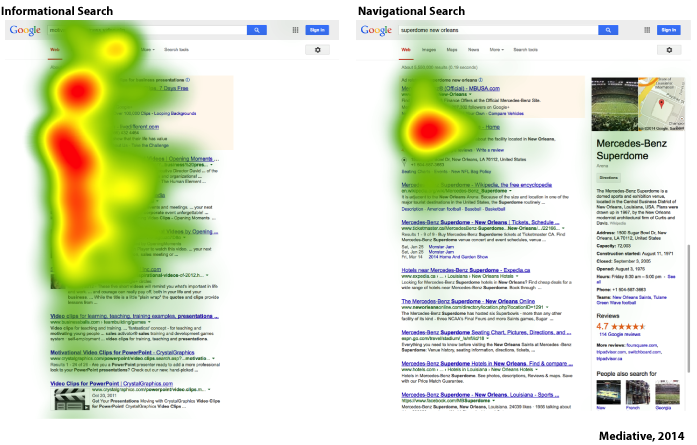
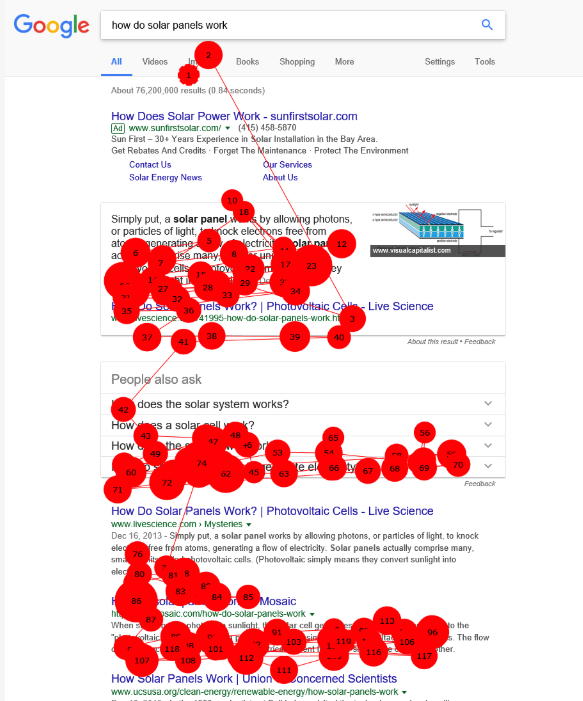
Out of the vast majority of ppc clicks occurring on Google’s search engine, over 41% of those clicks go straight to the top 3 results on any given SERP.
Now, if you’ve been in the PPC game for more than a day or so, you’ve already been told about the importance of being above the fold with your results.
Well...now you know why.
21. The GDN’s Rotation Reaches Nearly All Internet Users...Fast
You heard it from the mouth of Google themselves: the Google Display Network reaches more than 90% of all internet users over their 2 million listed sites. It’s a rare and splendid thing when you can rely on such a dynamic advertising platform to reach nearly all of any potential audience you may want to target.
22. How Fast? How Fast 2 Million Websites Are Visited...
Not only does the GDN reach such a massive audience of 2 million users, it does so at an unbelievable rate.
The GDN manages to reach 65% of all these peopleevery 24 hours.
That means every day there’s a turn around of over 1.17 million users at your PPC fingertips when advertising on the Google Display Network.
23. More Than 70% Of Smartphone Users Are Search Consumers
As smartphones become that much more prevalent to the everyday consumer (as if they could even be more popular than they are today), it’s important to remember just how many of these smartphone users are also mobile consumers.
And it turns out that 72% of mobile users are active local search consumers. Which means that nearly 3/4ths of all mobile users are a primed local audience just waiting for your stunning ppc ads.
24. Over Half Of all Paid Ad Clicks Are On Mobile Devices
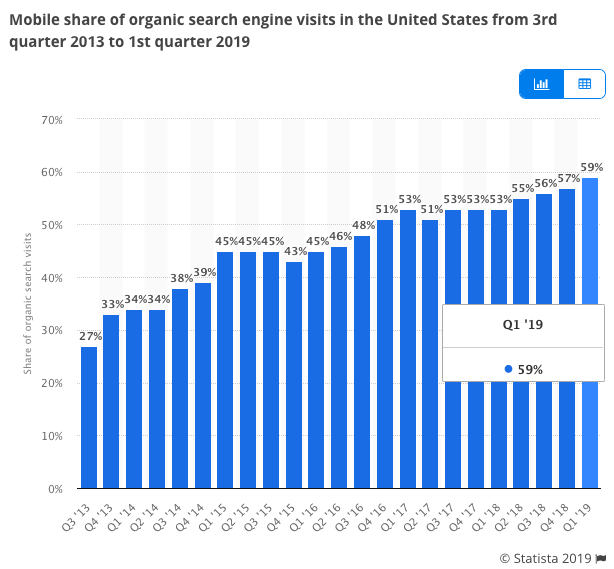
And speaking of increasing smartphone usage for local search, it turns out that as of the past few years, mobile search activity has finally overtaken desktop usage. In fact, as of 2019, mobile search officially takes up 59% of all paid clicks via search engines.
25. More Than Have Of Mobile Conversions Come From Top 3
To further emphasize the importance of keeping your ad in the top three results, the same above-the-fold logic that applied to desktop ppc ad campaigns goes even doubly strong for mobile ppc ads.
Where it’s still a whopping 41% for desktop PPC clicks that go to the top 3, it jumps to an even higher 64% for mobile PPC campaigns (most likely because people hate to thumb-scroll).
26. Over 70% Of Mobile Conversions Call Through Google Ads
According to PowerTraffik, and anyone who’s done some local shopping based on Yelp reviews or a Siri Google Search, over 70% of mobile converters call the local business directly through Google Ads.
If you haven’t considered employing phone extensions to your ad extensions list (or, worse, don’t have the expertise or resources to even know what call extensions are), these are the numbers that prove just how important they can be to your campaigns.
27. More Than Half Of Mobile Click Conversions Call Later Anyways
If the fact that 70% of mobile converters call the business directly through Google Ads doesn’t convince you… What if I told you that 58% of mobile users go on to call the business directly anyways after their mobile ad experience?
“With more than half of mobile users relying on the call feature of any business to convert on their buyer’s journey, missing out on the phone number is sure to hurt your local performance. But this shouldn’t come as any surprise...they are using their phones after all.”
28. As Of 2019 There Are 247,000 Apps On The Mobile Ad Market
According to Statista, as of 2019 there’s a whopping 247K mobile apps currently on the Google Play Market. Each of these represent a different PPC advertising opportunity for digital advertisers, further adding to the countless audiences we’ve examined thus far in the post.
Are you beginning to sense the theme yet? If not, I’ll give you a hint: The key to the most valuable Google Ads PPC stat is framing them in the context of which audiences you’re targeting, which users you’re reaching, and how many ROI driven conversions can you generate from that group.
29. Mobile Ad Blocker Has Increased In Usage 27%
The more we talk about mobile PPC advertising, the more important it becomes to mention the growing popularity of ad blockers. According to a study reported by eMarketer, one out of every four US consumers will adopt ad blockers in the coming year.
With approximately 27% of your audience using ad blockers, this will significantly affect the efficacy of your GDN campaigns. While the increases in growth may be decreasing YoY, the percentage of global internet users using ad blockers is still on the rise.
“This will make the efficacy of your Google Ads PPC campaigns via the GSN (Google Search Network) all the more effective as, when combined with RLSAs, the original SERP might very well once again become the battleground of digital advertising.”
30. A Page Load Speed Over 3 Seconds Loses You 54% Of Users
During a Think With Google discussion focusing on Mobile-First landing page design as opposed to mobile-responsive designs, the idea of page load speed was highly stressed. What was primarily discussed was that after a 3 second page load speed you lose up to 54% of users. Meaning that after the classic “3-2-1” countdown you’ve already lost half of your potential customers!
31. 92% Of Social Media Advertisers Use Facebook
Social media advertising, along with the powerful rise of the integrated Google Ads platform and the Google Merchant Center, has become a massive $8.4 Billion market. And with a market of that size, more than 92% of digital advertisers turn to Facebook as their preferred social media advertising platform.
Why – you ask? Well, because it pairs so well with Google Ads and Remarketing of course.
32. The Average Facebook CPC (as of 2019)
The average Cost-Per-Click across all industries for Facebook (as of 2019) is approximately $1.72. This is where the brilliance of Facebook Remarketing (when done right) begins to shine through the murky waters of complex integrations and high falutin PPC budgets.
And, if you’re specific to the eCommerce space, the powers of Facebook Dynamic Ads may also begin to rear their heads as you can optimize product campaigns for max engagement/sales without having to setup complex remarketing campaigns with all those potential remarketing mistakes.
33. The Average User Retention Rate Varies By Content
It turns out that it’s not just the ad and the offer that affect whether or not your content is remembered by users. How they interact with the content of your ad also plays a big role.
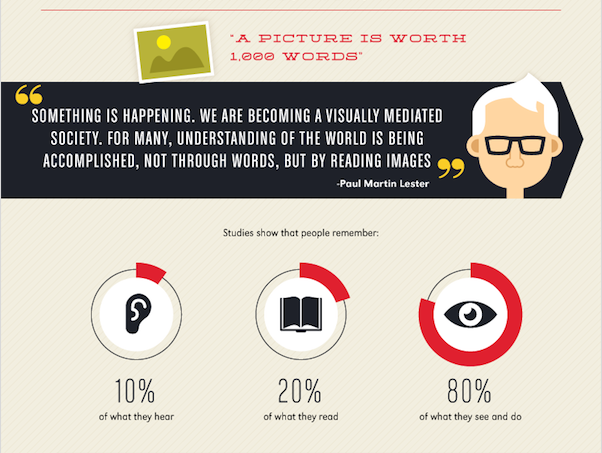
According to psychological and neurological studies, average content consumption and recall follows the following order.
People on average remember:
34. Facebook Users 18-24 Have 75% The Attention Span Of 65+
According to Facebook, consumption of video ads changes based on age.
For example, people aged between 18-24 spend 75% less time viewing an ad than people aged 65+.
This trend has led to the introduction of the 15 second time cap on in-feed video ads (as Facebook wants to cater towards a younger audience for the majority of their features).
35. On Average, RLSA Campaigns Have 2X CTRs And ½ CPCs
Based on some research performed by the experts over at Wordstream, the stats guys themselves, RLSAs (or remarketing lists for search ads) have been shown to have twice the CTRs of ordinary, first level searches. This means that you also see the benefits of a 50% lower Cost-Per-Click on which campaign your connect to your RLSA feed.
If you want to learn more about RLSAs, you can check out our post dedicated to Remarketing Lists for Search Ads. But for now, all you need to know is that on average they double your CTRs at half the cost. And that’s a win worth investing in.
36. The Average PPC Account Manager Salary is $50K/Year
Depending on what kind of payment structure you’re using, the average salary in the US for PPC marketers is about $50K/year. This is important if you’re trying to calculate the cost/benefit options of keeping your in-house team (possibly 3 to four members) and hiring an agency. The math can start to get pretty dicey at that point.
- In-House Team Cost: 3(50K) = $150,000/year
- Agency Cost: 12(3K) = $36,000/year
You may have more autonomy and control while keeping your advertising team in-house. But you’re also paying them a lot of money in salary that could possibly be refocused into your actual advertising budget to help grow revenue.
And the math doesn’t just favor an agency when it comes to a multi-man in-house team. The math still favors in agency even with just one PPC analyst.
37. Over 7 Million Advertisers Rely On Google Ads PPC
Our last google ads ppc stat speaks for itself – over 4 billion users make up the massive audience of the internet. You can frame all the other stats in this post in that context, meaning that Google’s 93% of the Search Engine Market Share feeds it with approximately 3.7B users (aka potential customers/clients).
“This is an obvious statistic to understand the value of: an audience of that size (billions) is worth speaking to about your product, so start screaming from the mountain tops.”
Google Ads PPC Stats Wrap Up...
There you have it. Thirty-seven Google Ads PPC stats that should paint the picture clearly for why you should consider hiring a PPC agency. Hopefully the above stats have helped convince any readers teetering on the edge that trusting an expert with your advertising budget isn’t a mistake, but a possible solution.
So long as you know what you’re looking for, the right metrics will always keep you on the right track, especially if you’re working with an agency. And, wouldn’t you know it, if you scroll your mouse down just a bit further, I think there’s a red button that just might help you get started with one today.
If you’re following the numbers correctly, that is.