


If you aren’t measuring your PPC in Google Analytics, you’re leaving money on the table. Combining your PPC powers with the additional measurement tools in Google Analytics leads to smarter goal tracking, sharper pictures of the people behind your conversions, and better insight into the full value of your campaigns. Let’s look into 21 ways you can use Google Analytics for PPC.
If you prefer to listen to a podcast with the same information in this blog post, click below:
- 1) Make sure your AdWords and Analytics accounts are linked
- 2) Import your Google Analytics metrics into AdWords.
- 3) Understand the difference in how Google Analytics & AdWords count conversions.
- 4) Create goals in Analytics to measure your PPC efforts.
- 5) Use UTM tags to attribute measure visits from sources other than AdWords.
- 6) Use events to measure actions within your website.
- 7) Use event tracking for monitoring actions on your website that don’t match URLs.
- 8) Create custom segments to better understand different audiences.
- 9) Apply custom segments to your demographics, too.
- 10) Use Google Analytics to create your remarketing audiences.
- 11) Use the Channels report to identify new PPC opportunities.
- 12) Understand how your visitors convert with the time lag and path length reports.
- 13) Use the Product Performance Report to connect top products to search queries.
- 14) Use the Assisted Conversions report to be sure about your negative keywords.
- 15) Use the Attribution Model comparison tool to learn ways to value your conversions.
- 16) Use the Top Conversion Paths Report to find high-converting multi-channel paths.
- 17) Use the funnel visualization report to find areas where your funnel leaks.
- 18) Use the Site Search Report to segment based on what users search for on your site.
- 19) Segment your branded and non-branded search terms for more precise reports.
- 20) Use custom alerts to monitor fluctuations in your accounts.
- 21) Useannotations to add context to your data.
- Wrap Up on Google Analytics for PPC
Get brand new analytics strategies straight to your inbox every week. 23,739 people already are!
1) Make sure your AdWords and Analytics accounts are linked
This is an easy one, but it can be easy to forget to go into your account’s settings and make sure this feature is turned on. Using auto-tagging in AdWords and linking the account with Google Analytics ensures you’ll get the best quality AdWords data in Google Analytics.
After you’ve linked, you’ll be able to see metrics like average visit duration, pages per visit, percentage of new visits, and bounce rate right within your AdWords interface.
Here are some steps you can follow:
- Make sure you have a Google Analytics account and that you have the tag on your website.
- Make sure you have admin rights (not “user” rights) within Google Analytics for the site you want to track.
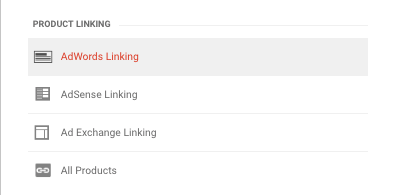
- Login into your Google Analytics account and select “Admin,” then “AdWords Linking” under the second column in the Admin menu.
Select the AdWords account you want to link and click “Done.”
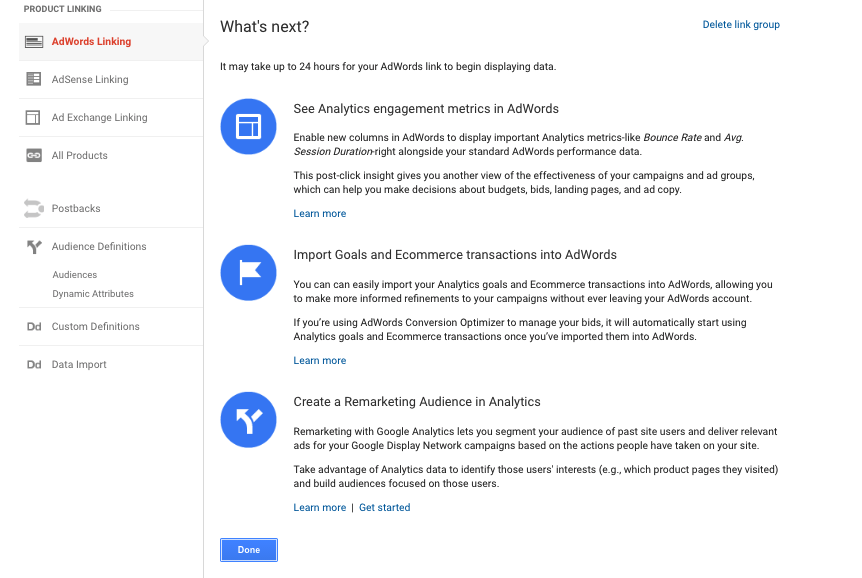
You’re all set. As you collect data, you’ll be able to see things like bounce rate and session duration at the keyword level in your AdWords account.
Please note: linking your accounts doesn’t automatically bring the columns for this data into your AdWords interface, but we will cover how to do that next.
2) Import your Google Analytics metrics into AdWords.
The AdWords dashboard is great for showing you which parts of your PPC campaigns are converting and which aren’t--but unless you have a ton of conversion data, you may be wondering how to move your AdWords campaigns in the right direction.

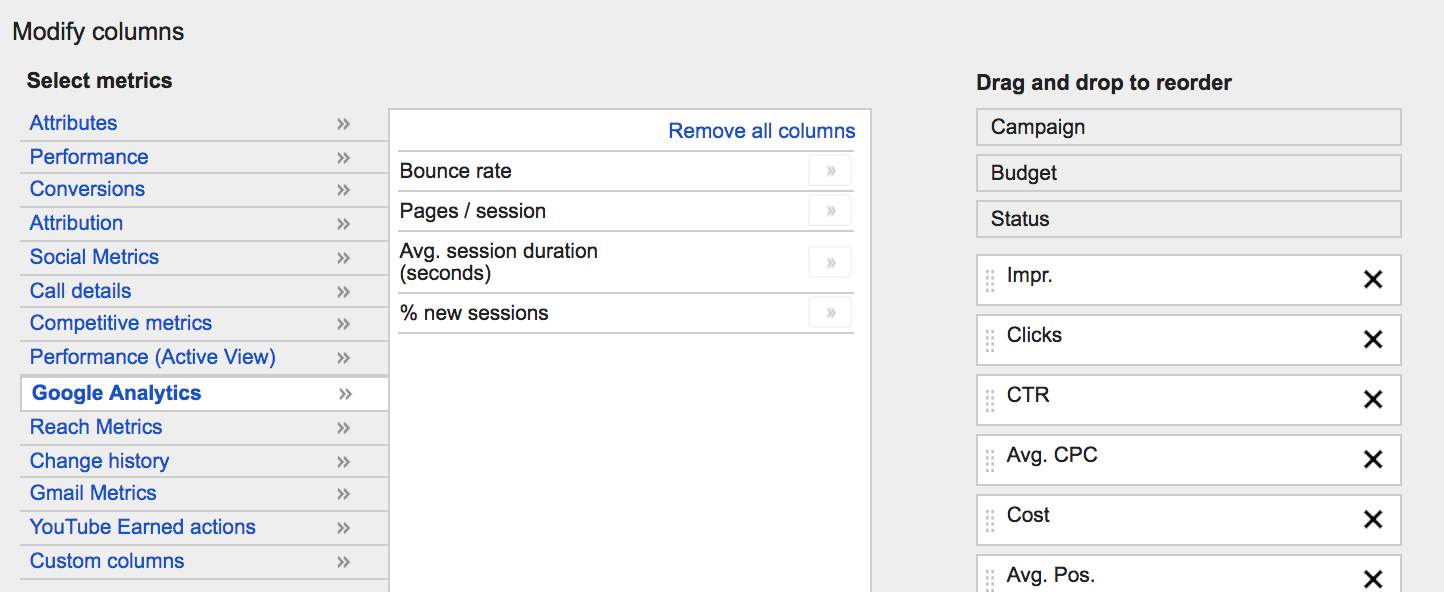
That’s where the benefit of linking your AdWords and Analytics accounts comes in, you can see metrics like bounce rate, pages per session, average session duration, and the percentage of people who are new visitors. To see these metrics in AdWords, go to columns on your dashboard, and then select Google Analytics.
Next, you can use these metrics to start evaluating your keywords on a micro-conversion basis.
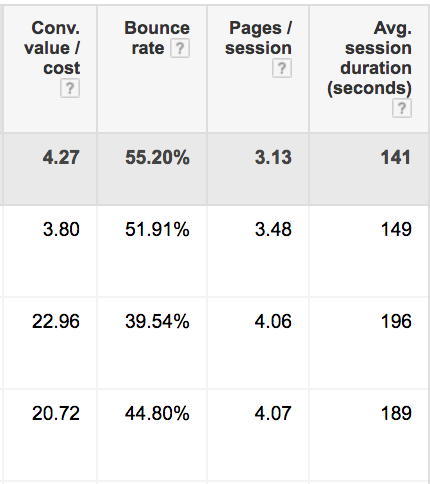
Among these keywords, you can see that as people visit more pages and stay on the site longer, return on ad spend (conv. Value / cost) tends to be higher.
So, how can you use these metrics to evaluate your keywords? If you see keywords with consistently high bounce rates, are you bidding on the right keywords? If your keywords are relevant, are you sending that traffic to the best possible landing page?
On the other hand, if you’re seeing long session durations but still no conversions, your traffic may be relevant, but could be having trouble completing the full conversion process. In this case, conversion rate optimization rather than changing your traffic will help improve your results.
3) Understand the difference in how Google Analytics & AdWords count conversions.
At one point, you’ve probably wondered why you’re seeing a difference in the conversions that AdWords reports versus the conversions that Google Analytics reports. You’re not going crazy - the difference lies in the two different attribution models these platforms use.

Google AdWords uses last AdWords click attribution. This means that 100% of the conversion value is attributed to the most recent AdWords ad that was clicked before someone converted. For example, if you clicked an ad, but later converted on an organic result or through some other channel, AdWords would attribute the conversion to the ad.
Google Analytics, on the other hand, uses the last non-direct click model. When you look at an AdWords or Acquisition report in Google Analytics, the conversion numbers you see attribute 100% of the conversion to the last ad or channel someone clicked through that wasn’t a direct visit to the website.
For example, if you clicked an ad, but later converted on a direct visit to the website, Analytics would credit AdWords with the conversion. But if you clicked on an ad, and then converted on an organic visit or other source, then Analytics would attribute the conversion to the latter.
If you’re noticing a large difference in conversions between AdWords and Analytics, one scenario may be that your conversion takes place over a longer series of touchpoints, which your ads are introducing people to, but other sources are closing.
We’ll discuss more on attribution models a little later in this post.
4) Create goals in Analytics to measure your PPC efforts.
You definitely want to be sure you have goals that are aligned with your macro-conversions, like sales if you’re selling products, or form submissions and phone calls if you’re focused on getting leads.
You can create these goals by going to the Admin tab in your Google Analytics account, selecting Goals under the View tab, and adding a new Goal:
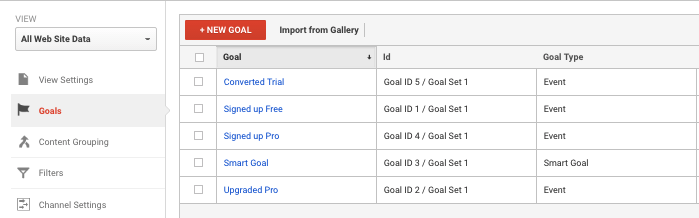
When you start setting up your goal, Google Analytics gives you a lot of preset options, but they’re really just preset names. I prefer to create custom goal. From there, you have a few types of goals you can choose from:
- Destination goal
- Event goal
- Duration
- Pages or screens / session
These can each serve their own purpose, but destination-based goals are especially versatile, so let’s walk through how to create one of those.
After you’ve selected “custom” and “destination” as your goal type, you’ll have a few options for how you define a goal completion, which include “equals to,” “begins with,” and “regular expression.”
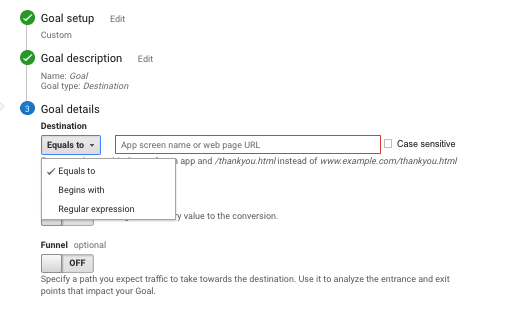
“Equals to” is pretty straightforward - a goal completion will be triggered anytime someone arrives on a page that is “equal to” whatever you define. For example, if you have pages with similar naming structure like “/checkout/confirmation” but only want to track people who complete the whole checkout process, this is a case in which you’d definitely want to use equals to “/checkout/confirmation” rather than begins with “/checkout.”
Regular expressions use formulas to give you even more control of the URLs you define in your goal. These could easily deserve their own blog post, but Google offers a handy guide to get started here.
When setting up your goals, measure your macro-conversions like sales or leads, but measure micro-conversions too. Do people tend to complete your macro-conversion more often when they visit a certain number of pages? Browse the site for a certain amount of time? Or view a key page? Add those as goals in Google Analytics. By doing this, you can create leading indicators for yourself to know whether your campaigns are heading in the right direction.
5) Use UTM tags to attribute measure visits from sources other than AdWords.
Are you seeing big differences in the number of clicks you’re getting in Facebook versus the number of sessions/users you’re seeing in Google Analytics? If you haven’t applied UTM tags to your URLs, these visits are being mis-attributed. That means Google Analytics may actually be interpreting these as direct visits and your hard-earned PPC clicks are going unnoticed.
Bing also has a cool auto-tagging feature like AdWords, but use UTM tags to make sure you’re properly measuring visits from any other channels aside from AdWords you may be using to send traffic to your site.
Don’t use UTM tags to measure visits within your website, because internal UTM tags can override the original source a visitor came from. So, if you’ve tagged a banner on your site, for example, someone who actually came from Facebook now looks like they came from utm_source=banner.
6) Use events to measure actions within your website.
Don’t use UTM tags to measure actions within your site. I can’t emphasize this enough. Using UTM tags within your website obscures the actual channels where your visitors came from, like social, email, or paid search.
Use events instead. Events can measure internal actions, like who clicked a certain link within your site, who engaged with a chat function, or who clicked a phone -- and that’s just scratching the surface.
The best part? Events don’t change where your visitors really came from :)
If you’ve never created an event before, let’s cover that in the next section.
7) Use event tracking for monitoring actions on your website that don’t match URLs.
Setting goals based off destination URLs in Google Analytics is usually straightforward. If you have an exact URL or part of one that you want to track, Google Analytics has options for that.
But what if you want to track something that doesn’t have a URL, like a phone call or a button click? That’s where events come in.
Events in Google Analytics tend to have four main values:
- Category: This is the name you assign to a group of events you want to track.
- Action: This is the name you assign to the type of action you want to track on a particular web page element.
- Label: This is the name you assign to an element on a web page where you want to track interactions.
- Value: This is a numerical value assigned to the event you want to track. This could record anything from monetary values to length of video watched
When setting up these events, you can either code these values onto the element you want to track, or you can use Google Tag Manager for event tracking. Because Google Tag Manager is much more flexible with event tracking, we’ll be using that as our example.
To set up an event in Google Tag Manager, you’ll need to do two main things:
- Set up an event tag
- Set up an event trigger so that your tag fires when the event is completed
The full scoop on tags and triggers in GTM is a bit outside the scope of this post, but we’ll cover the basics with an example on how to track clicks on outbound links.
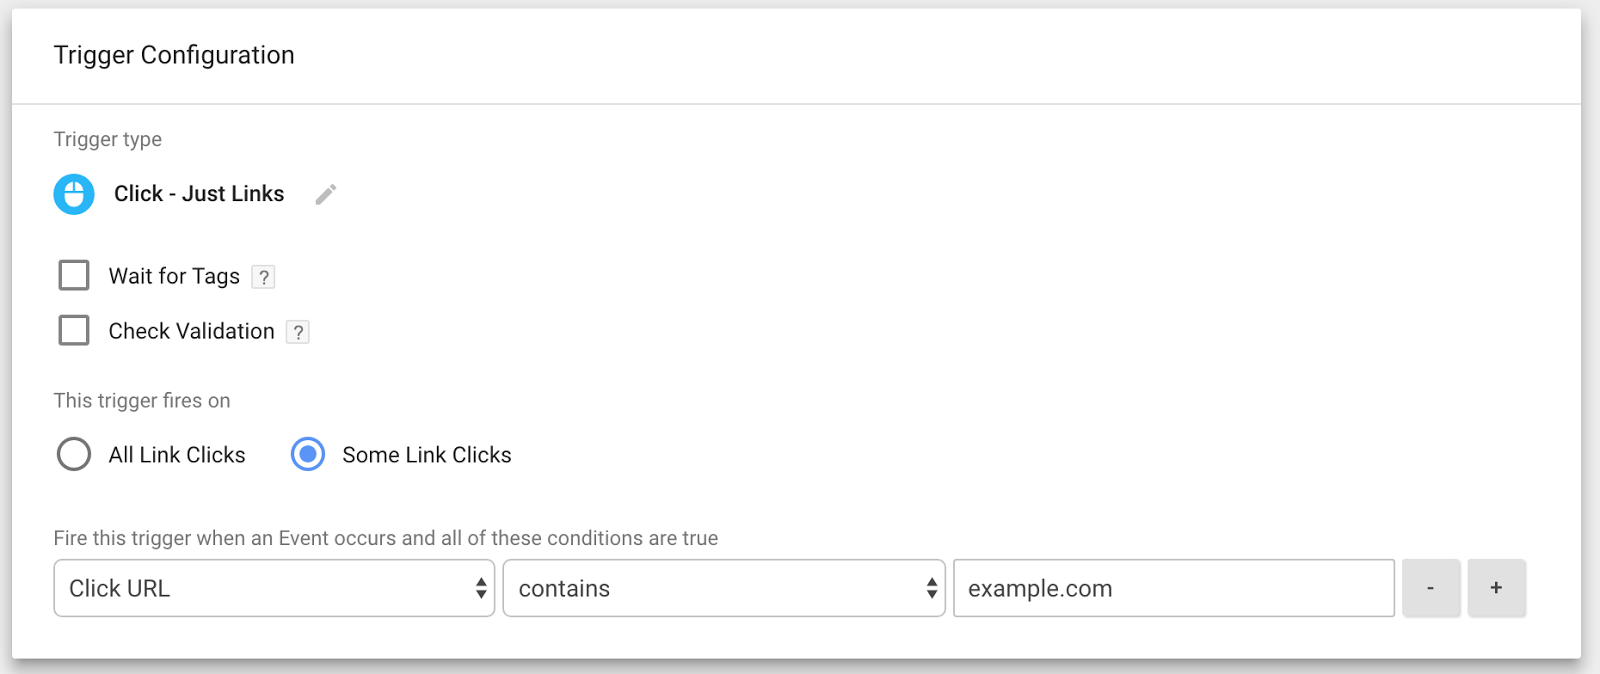
First, once you’re in your Google Tag Manager account, you’ll want to go to Triggers, then select new trigger. This will bring up a menu where you can choose from different types of triggers. Under Click, go ahead and select “Just Links,” so that you’re only tracking people who click on a certain link.
If you want to track clicks to a specific URL, set the trigger to fire on a click URL that matches the one you want to track.
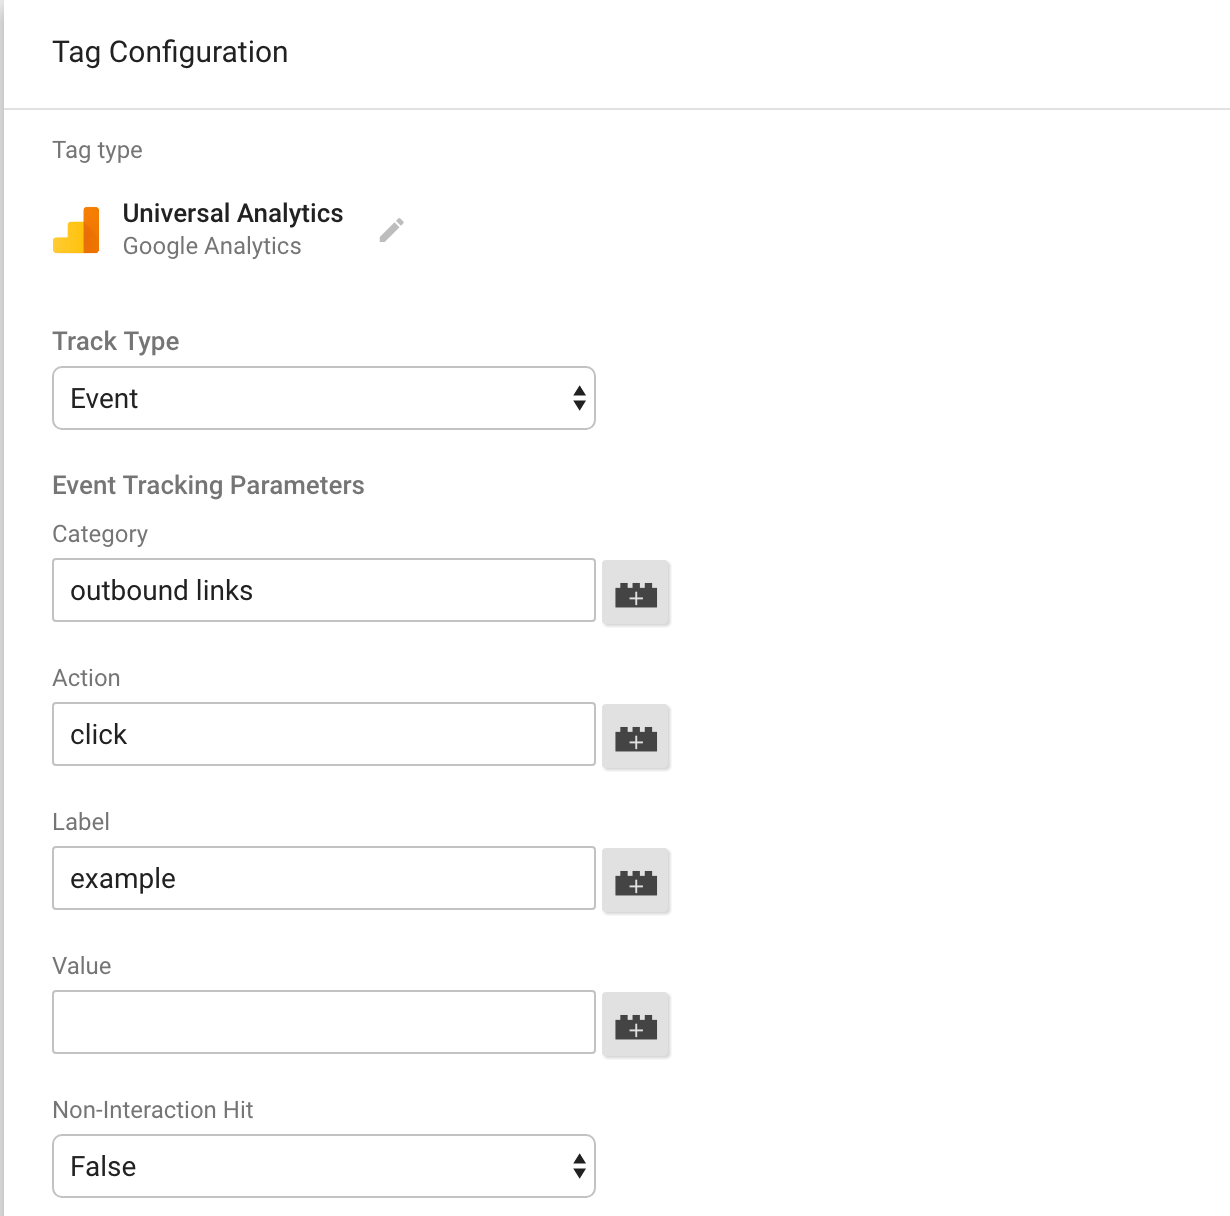
Next, you’ll set up a tag. To do this, go to the Tags menu on the left pane of the GTM interface, and select “New”. For your tag, choose Universal Analytics, and for your track type, select “Event”. Here, you’ll enter the category, action, and label values for your event. Be sure to name these something that’ll makes sense to you when you spot them in your Analytics reports. Since we’re tracking outbound link clicks, here’s how I’ll name mine (you can change the label to match the site you want to track clicks to).
Once you’re done there, you’ll pair this tag with a trigger that determines when this tag fires. Go ahead and select the trigger you created, use Google Tag Manager’s preview and debug mode to test that your event is firing, and BAM. You’re done. Pat yourself on the back.

8) Create custom segments to better understand different audiences.
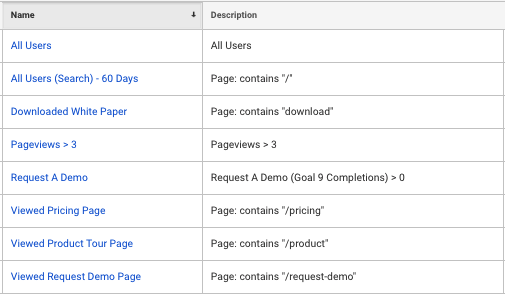
Do you know the audience you’re trying to reach? Is your PPC traffic even in line with that audience? Create custom segments in Google Analytics to view different slices of your traffic.
For example, you may want to look at the different behaviors of all visitors versus those who convert. If you see that people who typically convert view an average of 5 pages and spent 3-4 minutes on your site, then you should ensure that your paid traffic is able to consume the appropriate amount and type of content that’ll help them convert.
To gauge how your PPC traffic is performing against those who typically convert, you could create a custom segment for a medium that matches “cpc” for all paid traffic or “google/ cpc,” if you’re just focusing on AdWords. Knowing the engagement patterns of your best customers can inform the best conversion paths for your PPC traffic.
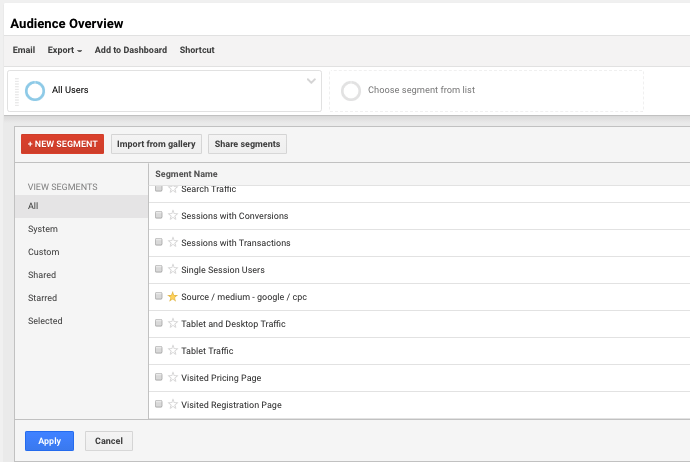
Here’s an example of how you can create a custom segment for your AdWords traffic. In any Google Analytics report, click the “Add Segment” button just above the chart area.
Next, go to conditions, and set your first condition to Source / Medium exactly matches: google / cpc:
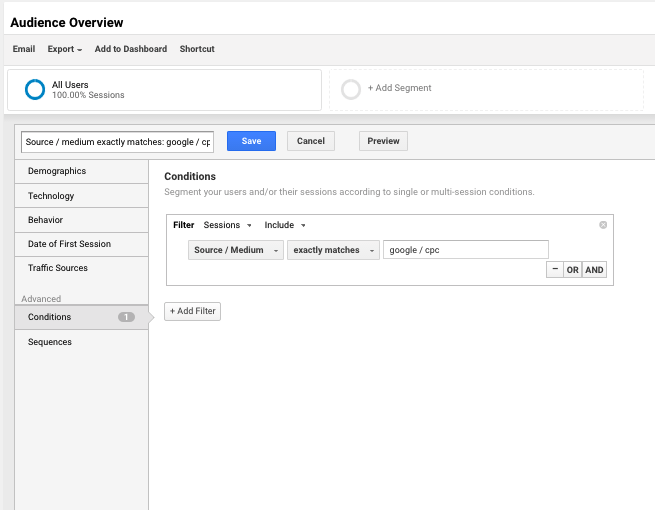
And bam! You have a custom segment that shows you behaviors just for your AdWords traffic. If you want to define more specific segments, you can add additional filters or use different kinds of conditions.
9) Apply custom segments to your demographics, too.
You can apply custom segments like all visitors, converters, and PPC visitors to your demographics reports in Analytics also. The overview gives you a great snapshot of the people coming to your website, with Age in a column chart on the left and a pie chart showing gender on the right.
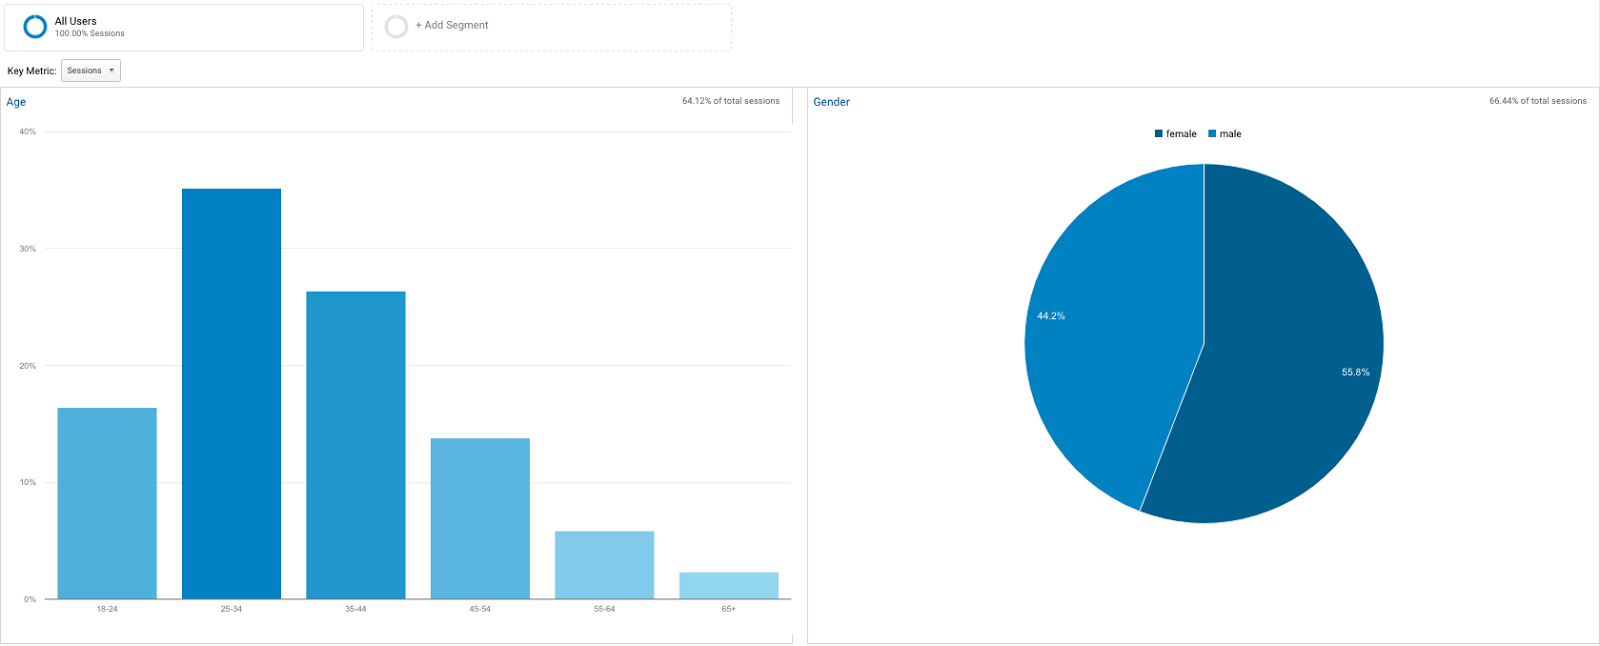
These can help you determine whether your campaigns are bringing visitors who fit the persona you’re targeting. In addition to painting a clearer picture of your Search traffic, you can also use this demographic data to help refine initial Facebook audiences if you don’t have prior data.
10) Use Google Analytics to create your remarketing audiences.
When it comes to creating remarketing audiences in Google Analytics, the options are almost limitless. In addition to having standard audiences like All Visitors, Shopping Cart Abandoners, and Current Customers, you can build remarketing audiences based off of:
- People who have visited certain pages
- People who have visited a sequence of certain pages
- People who fit a certain demographic profile
- People who visited via a particular source and/or medium and/or campaign
- People who visited a certain number of pages
- People who stayed on the site for a certain amount of time
- People who completed a certain goal or event
- People who have completed a certain number of purchases
And any custom combination of these audiences. If you need help coming up with audience ideas that have significant volume (you’ll need at least 1,000 people in a given audience before Google will allow you to show ads), experiment with some custom segments to see which combinations lead to successively higher-converting audiences.
If you’re asking yourself, “Is it really worth the trouble to create all of these audience,” determine the 4.2x difference in ROAS that can be achieved with remarketing audiences.
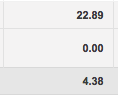
The total ROAS for all Search campaigns is on the bottom, the total from just remarketing audiences is on the top.
Not ever remarketing audience is necessarily going to net a 4.2x higher return, but definitely create multiple audiences and use RLSA to figure out which ones work best for you.
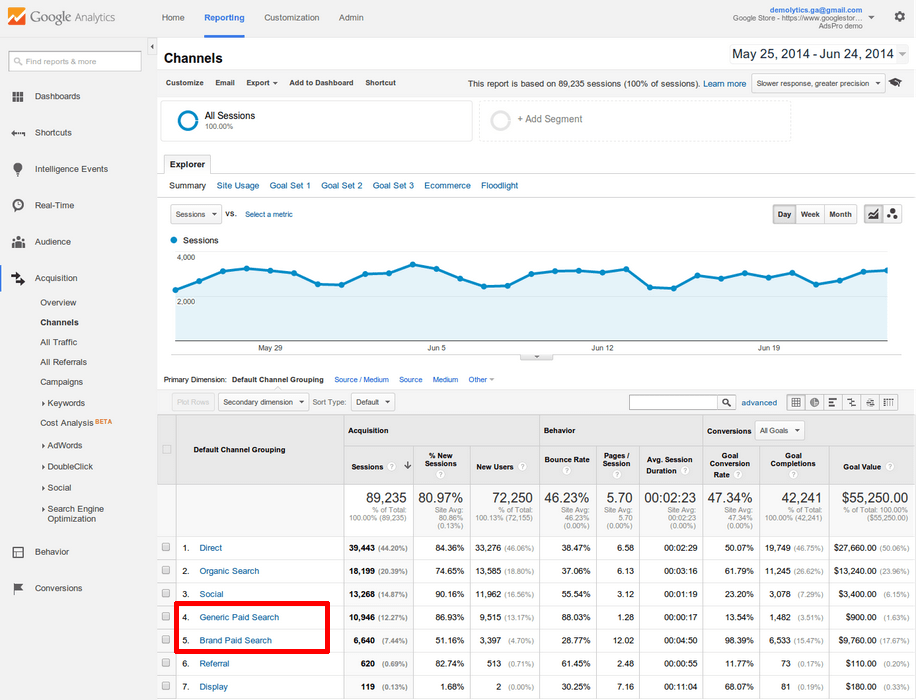
11) Use the Channels report to identify new PPC opportunities.
Audiences aren’t the only hidden gold in your Google Analytics account. The Channels report under the Acquisition tab has a ton of information about how people are getting to your website, which you can use to learn about PPC expansion opportunities. For example, if you’re only doing PPC on AdWords, you can go to the Channels report, set a filter for medium containing “organic,” and see how Google stacks up against other search engines organically.
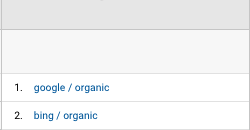
In this case, volume on Bing is much lower (which makes sense given the difference in search market share between Google and Bing), but Bing converts twice as often. This is a strong leading indicator that expanding to Bing Ads could be worthwhile, if you’re looking for additional conversion volume.
12) Understand how your visitors convert with the time lag and path length reports.
When you know where your visitors are coming from, the next step is to understand how they convert. The Time Lag report tells you about the length of time in days until your visitors convert. The Path Length report shows the number of different touchpoints a visitor interacts with before they can convert.
The data in these reports can help you out with two major things:
- Knowing if your conversion window is set correctly in AdWords
- Knowing which attribution model you should use
In this example, nearly 30% of the site’s conversion value comes 12-30 days after the first interaction. A campaign running with a conversion window of just one day, for example, would be missing out on nearly half of what’s going on.
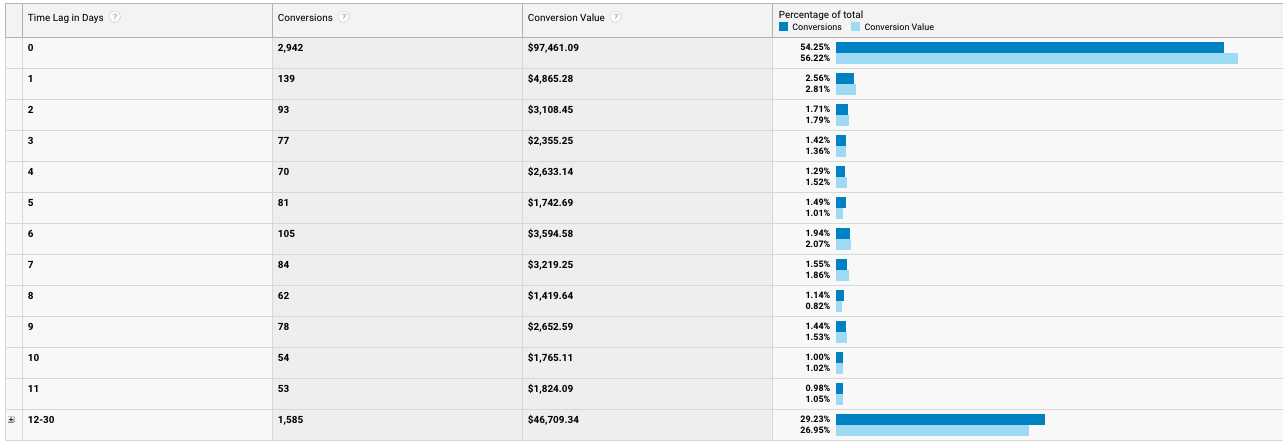
From a path length perspective, more than 50% of conversions happen after 2+ interactions. Because it’s clear that several purchases can take over 2 weeks, and over half take place over 2 or more interactions, using a position-based attribution model rather than the default last click model can provide a better depiction of overall PPC campaign value. This is because you’re able to assign more credit to the interactions that bring users into the funnel and the ones that happen right before the purchase.

13) Use the Product Performance Report to connect top products to search queries.
If you’re an ecommerce advertiser, knowing which of your products sell best is going to be the first key to success, especially when managing Google Shopping campaigns. To find these products in your Google Analytics reports, go to Conversions > Ecommerce > Product Performance.
Note: This’ll only work if you have ecommerce reporting turned on and are tracking revenue.
Here, you’ll be able to see revenue, quantity sold, and unique purchases for all of your products. If you want to get more advanced, you can set a custom segment to look only at PPC traffic, then add a secondary dimension to see which search queries are leading to sales.
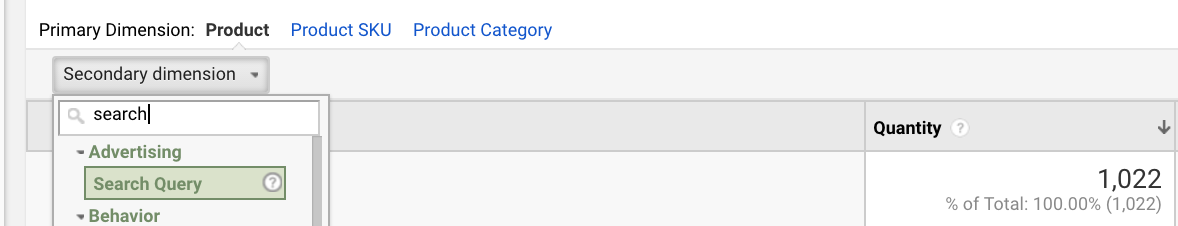
If all of your product groups are bundled into one ad group, it’s hard to determine which search queries sold which products. But this report helps you see which products and queries go together. You can use this search query data to:
- Expand your keyword targeting and direct traffic to the most relevant product
- Refine your product titles so that they’re matched with the searches that generate the most sales
- Compare this against your AdWords search terms and exclude search queries that are totally misaligned with searches that lead to sales
When you combine your product performance data with search query data, you’re getting a much fuller of how to generate sales from your shopping campaigns.
14) Use the Assisted Conversions report to be sure about your negative keywords.
Have you ever come across a term in your search query report that was inefficient enough to become a negative keyword - but, intuitively - you felt reluctant to exclude it? Of course you have.
The search query report is great for a lot of things, but reporting assisted conversion value is not one of them. Thankfully, that’s where the Assisted Conversions report in Google Analytics comes in.
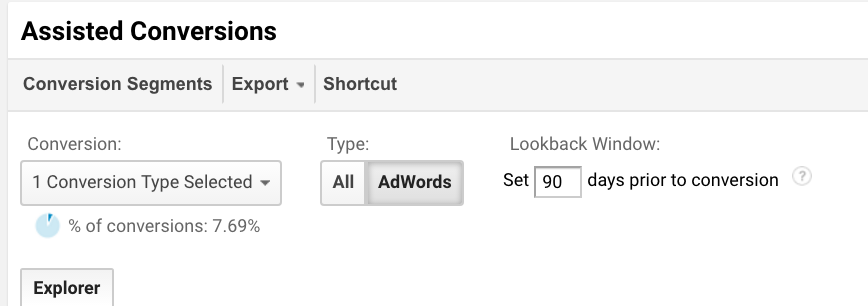
To find this report, go to Conversions > Multi-Channel Funnels > Assisted Conversions. To get the most accurate conversion data, you’ll want to set your conversion to the main goal you’re focused on. Then, set your type to AdWords, and set your lookback window to 90 days, since this will give you the most data to look at.
Then, set your primary dimension to search query so that becomes the main focus of this report. At this point, you can create filters for search terms (or parts of search terms) you’re on the fence about excluding.
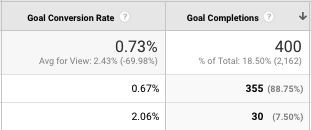
For example, I’m curious about whether searches that contain the word “reviews” actually lead to conversions, so I’ll type the word “reviews” into the filter box for this report:
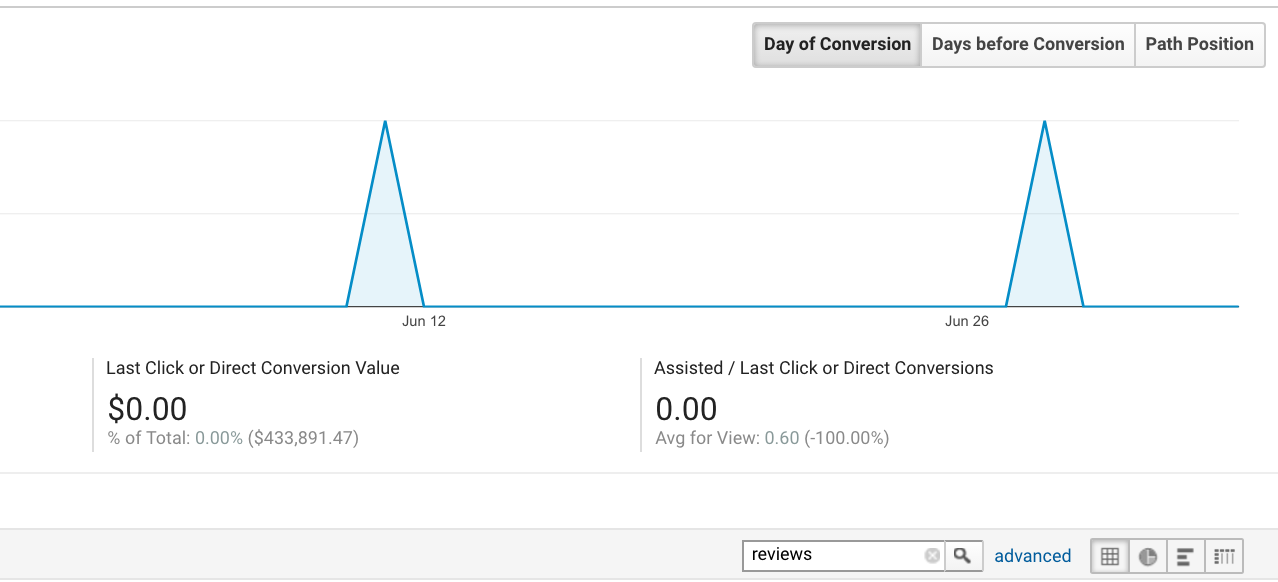
Turns out searches that contain “reviews” actually do convert. Glad those reviews are coming in handy.
If you want to take this a step further, note the search queries that come up in this report, analyze their cost in AdWords, and compare the cost against the assisted conversion value to measure the profitability of these terms. If you’re gaining conversions but the cost is high, you can break these terms out into a SKAG (single-keyword ad group) and lower your bids so that you don’t over-spend.
15) Use the Attribution Model comparison tool to learn ways to value your conversions.
Speaking of assisted conversions, are you selling your PPC short? The Google Analytics Model Comparison Tool lets you compare different attribution models across channels. For AdWords, you can even compare attribution models for individual campaigns.
For example, if your buying cycle tends to be longer, you can use the Model Comparison Tool to measure how much value your campaigns are contributing from the AdWords default of “last click attribution” to a first click or time decay model.
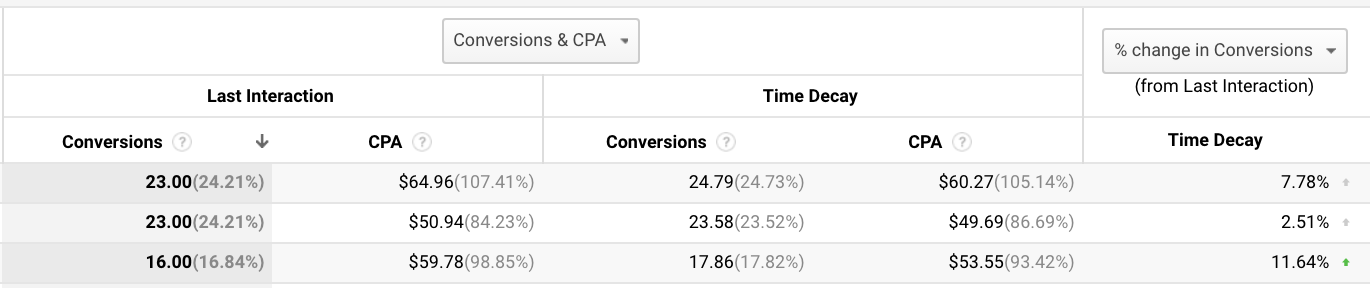
So, why would you do this? Attribution models outside of last click are basically telling the story of how PPC and your other marketing channels are interacting with each other. Last click only measures the direct value provided from a given channel, but other models are much better at conveying the indirect value.
If you miss out on the indirect value, you may have an incomplete business case. PPC could be leading to conversions that happen further down the funnel via email, or SEO, and last click won’t convey this story. If an incomplete story about PPC’s full value results in reduced PPC spend and it affects performance for channels PPC interacts with, then an incomplete understanding of your PPC efforts could result in a net loss.

When deciding on which attribution model to use, understand the business you’re working with, how your channels interact together, and agree on which model you should use with your stakeholder.
16) Use the Top Conversion Paths Report to find high-converting multi-channel paths.
You now know that your visitors’ conversion paths can span multiple days and touchpoints. If you want to see what those paths actually look like, you can use the Top Conversion Paths Report to see each series of interactions that happen before someone converts.
Best part? You can apply this to anything you’re tracking as a goal in Google Analytics, including micro-conversions.
Here’s an example of what the Top Conversion Paths Report looks like.
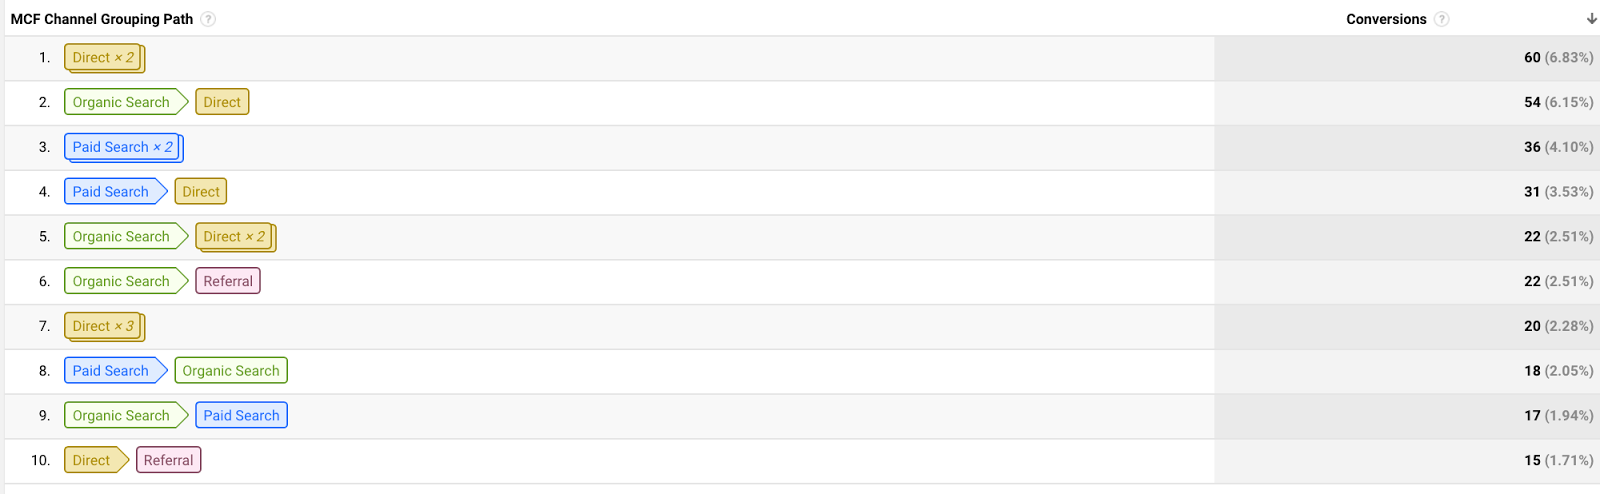
Remember when we talked about understanding which channels interact with your PPC efforts? This is where you find that. If you want to get even more granular more about which paths you’re viewing, you can create a Conversion Segment to view just interactions that include paid channels.
To do this, you could go to the “Conversion Segments” button at the top left of the Top Conversion Paths Report, and click Create New Conversion Segment:
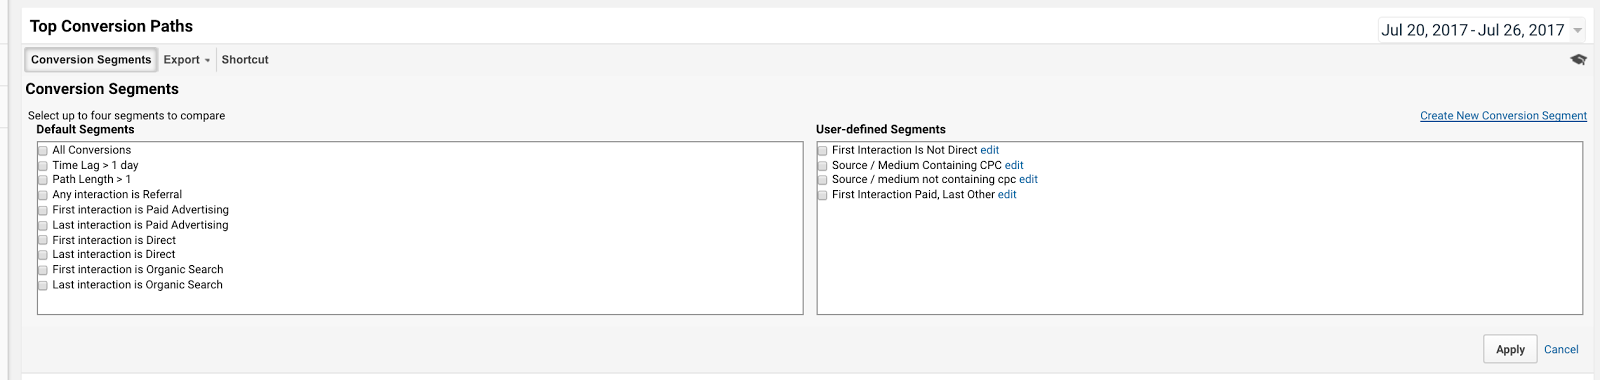
Once you’re there, you can define whatever kind of conversion paths you’d like to view. If you wanted to view any paths that contain an interaction involving paid search, you could create a segment that includes any interaction from “cpc” like this one:
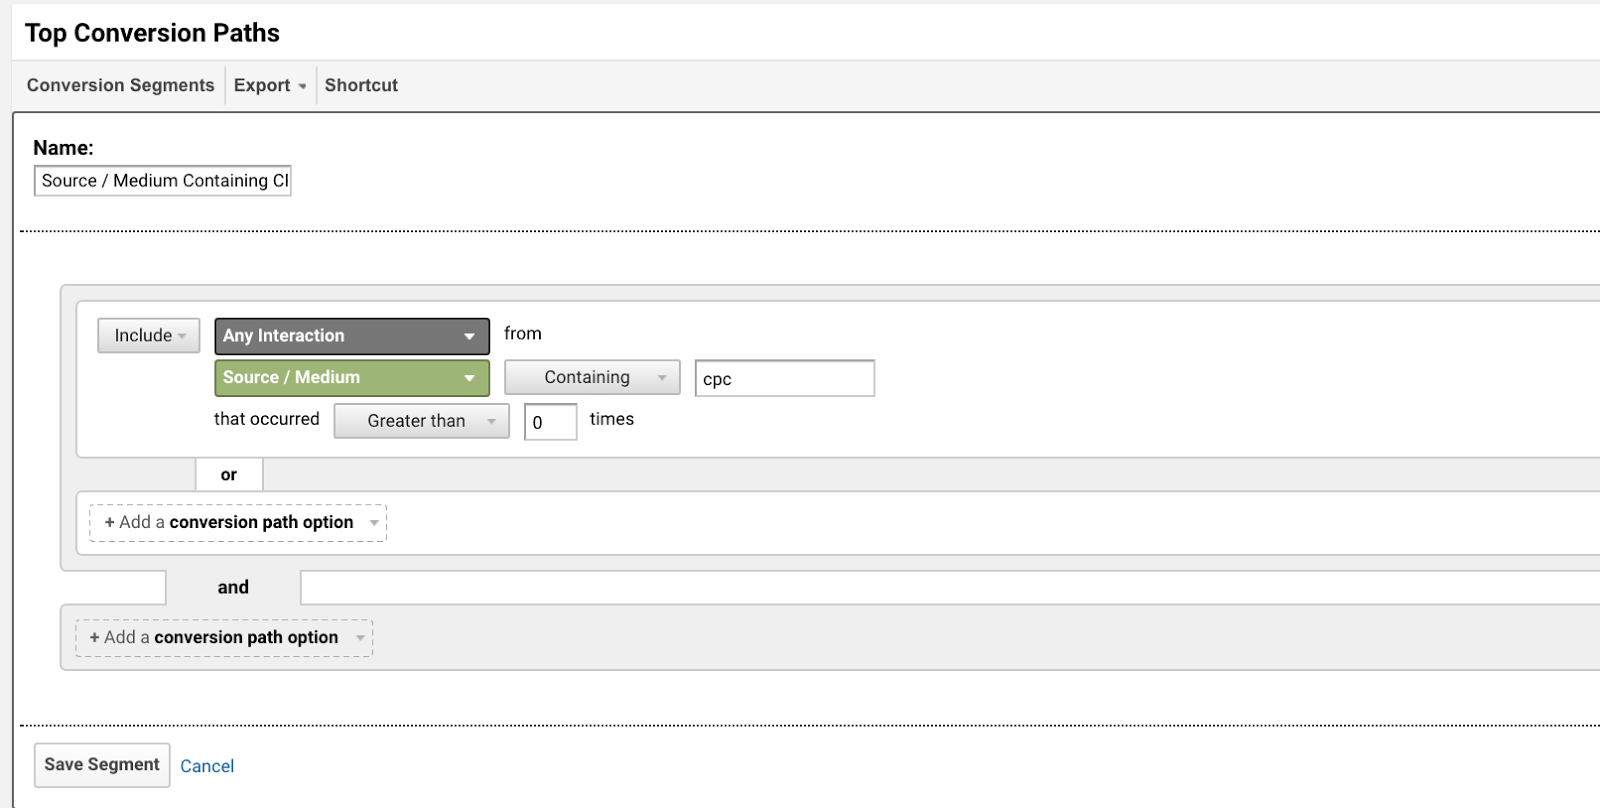
Spend some time experimenting with this tool, and you’ll start to get some very accurate ideas of what your visitors’ conversion journeys look like.
17) Use the funnel visualization report to find areas where your funnel leaks.
If your visitors complete multiple steps before becoming a lead, or if you want to measure each step of your checkout process, this report helps you visualize where your visitors are dropping off.
This type of funnel is created off of different URL paths. For example, you could set up your funnel to measure something like /checkout/step-1, /checkout/step-2, /checkout/step-3, and so on.
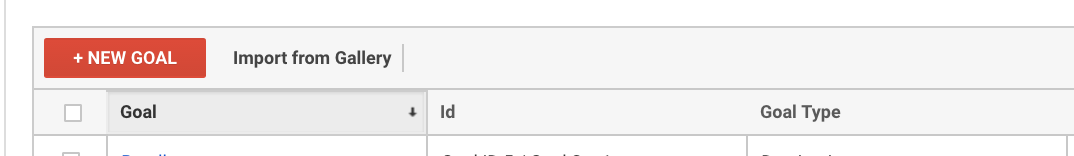
To get that set up, the first thing you’ll do is go to the Admin > Goals section in your interface, then click +New Goal.
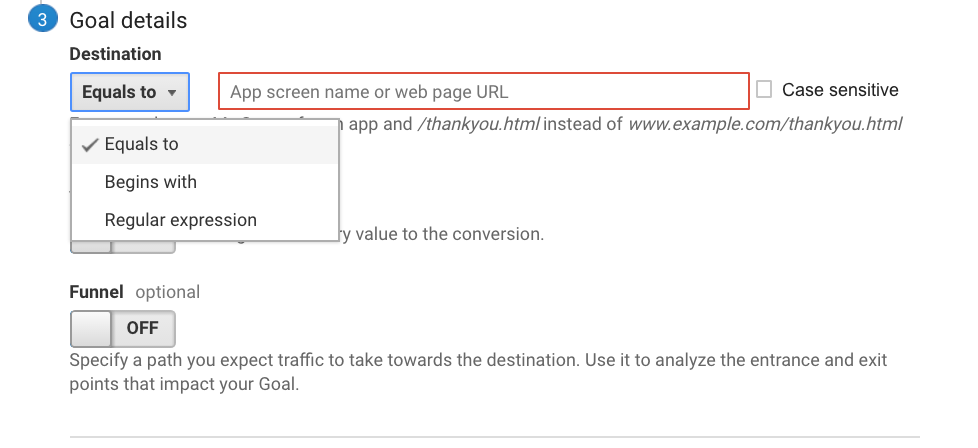
For your goal setup, you’ll want to select “Custom,” and your goal type will be “Destination.” Once you get to the goal details section, you can use “Begins with” or “Regular Expression” (depending on the complexity of your site’s URL structure). In this case, I used regular expression, because I find it to be more precise.
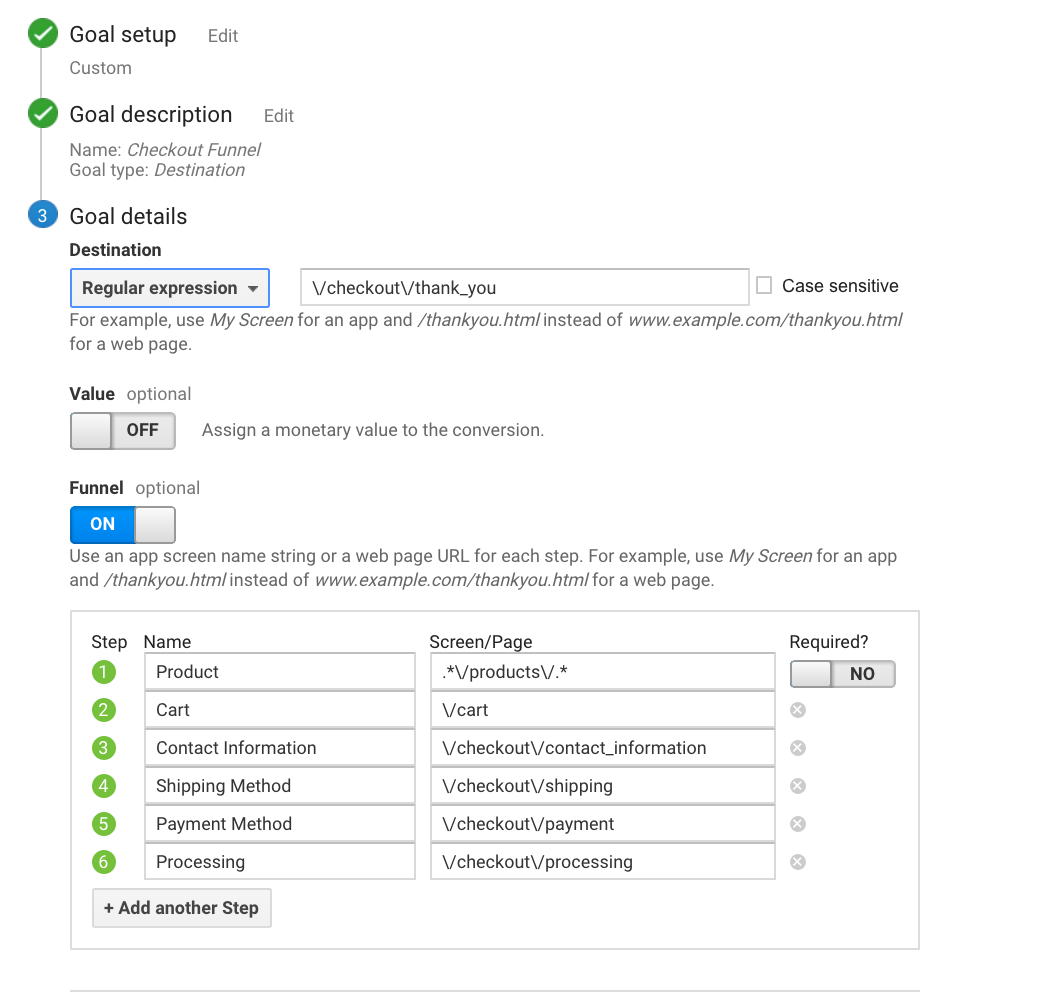
Next, you’ll want to make sure that the “Funnel” option is turned on, otherwise you’ll only be measuring your last step. Once you switch it on, you’ll see the option to add multiple steps that occur before your final goal completion. In this case, because I’m measuring activity on an ecommerce site, I’ve added steps for people who arrive on product pages, add that product to their cart, and steps for each part of the checkout process. In your case, just repeat for whichever steps your checkout or signup process has.
Once you’ve set everything up, verify the goal so you know that everything’s working correctly.

When you verify your goal, note whether the conversion rate seems abnormally high or low - this may be an indication that one of your steps was done incorrectly.
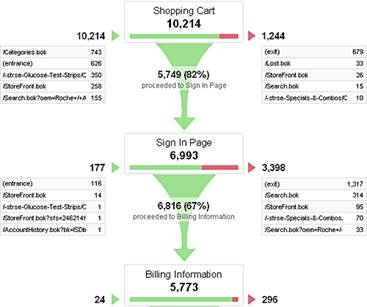
Once your goal’s saved and you’ve had time to collect some data, you should be able to go to the Conversions menu > Goal > Funnel Visualization, and see something like this:
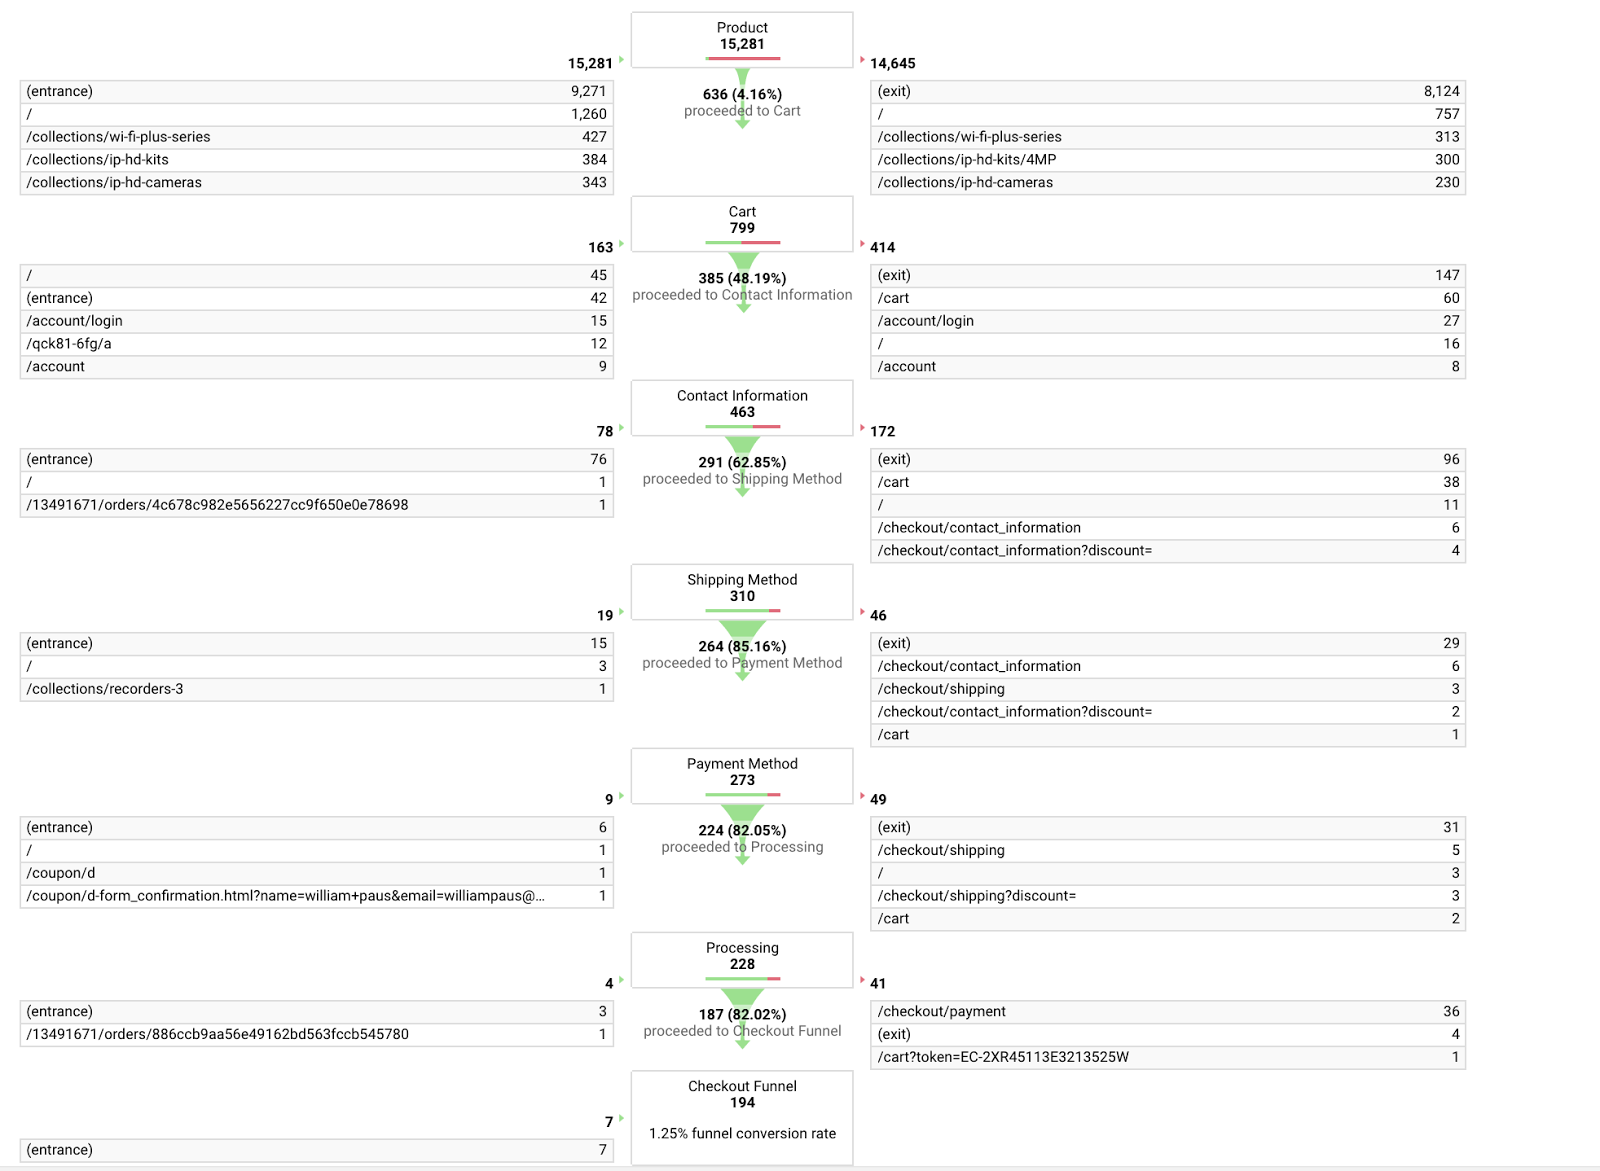
Now that you can visualize every drop-off point in your funnel, you can start making decisions about which parts need the most work. Depending on the areas that the need the most work, you’ll need different approaches.
For example, if the checkout process is smooth, but not many products are being added to the cart, you may need to consider, “Do visitors have enough information to make a purchase?” “Do visitors need to talk to a real person before making a purchase?”
On the other hand, if you’re seeing that if your Shipping step is resulting in the most drop-offs, you may need to ask, “Are the fields on my Shipping page labeled clearly?” “Are fields labeled clearly and easy to use across all devices?”
The Funnel Visualization tool is a great way to visually prioritize where to concentrate your conversion rate optimization efforts next.
18) Use the Site Search Report to segment based on what users search for on your site.
Are you looking for a targeted way to expand your keyword targeting? Of course you are. The Site Search Report in Google Analytics helps you see what people are trying to find once they’re on your site.This can help you unearth new keyword targets you may not have thought of otherwise.

To set up site search, you’ll first go the Admin tab in your Google Analytics account. From there, go to your view settings, and then scroll down until you see the “site search settings” section.
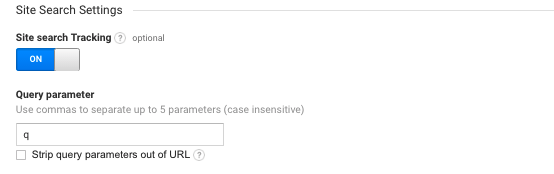
Make sure that site search tracking is turned on, and then enter a value for your query parameter.
What’s a query parameter?

“Query parameter” sounds complicated--but for our purposes, it’s just a symbol your browser uses in the address bar to help Google Analytics understand what’s part of a site search.
Here’s an example:

In this case, “q” shows up in the address bar before my search, telling Google Analytics that my site search - “q” - equals “cool beans.” Most of the time, your query parameter will be “q,” but you can be extra sure by just doing a search on your site and seeing what shows up in the address bar.
To finish your site search setup, just enter the value you see in the query parameter menu, and you’re all set.
Now let’s look at some reports.
Under behavior > site search > search terms, you can check out all the things people are typing into your website’s search bar. They’re omitted here, but just to the left of “total unique searches,” you’ll see all the search terms in your Site Search Report:
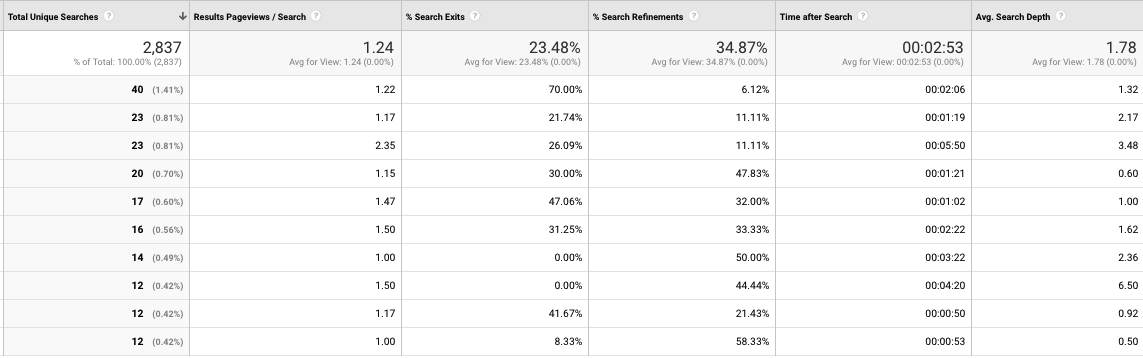
You may see some irrelevant terms, but you’ll also find a lot of relevant terms that you may not already have in your campaigns.
19) Segment your branded and non-branded search terms for more precise reports.
When setting up PPC campaigns, it makes sense to separate branded and non-branded keywords, especially for attribution purposes, because branded and non-branded traffic tend to perform differently. People who search using your brand or products are looking to buy specifically from you, whereas people using non-branded searches may still be researching. Did you know you can also segment branded and non-branded traffic in Google Analytics?
Here’s an example of how it looks in your Channels report:
To set this up, go to your Admin panel, then go to Channel Setting and click Manage Brand Terms.
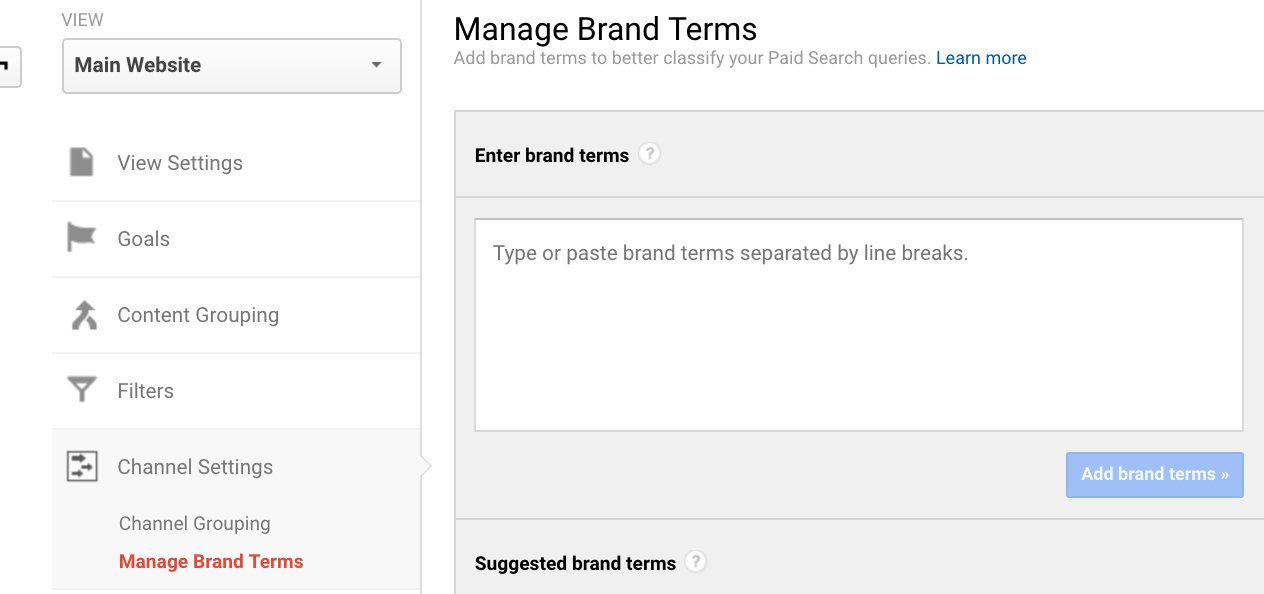
Here, you can add keywords that you’re targeting in your branded search campaigns. You can also review terms that Google identifies as brand and accept or decline each of them as well as add other brand terms that aren’t already included, such as misspellings.
It can take up to 48 hours for the changes to take effect in your reports.
The two channels are available within Multi-Channel Funnels and the main Channel section under the Acquisition menu.
Keep in mind, these channels apply to all paid search, so Bing Ads and any other traffic source tagged as “cpc” will be included.
20) Use custom alerts to monitor fluctuations in your accounts.
If you manage multiple PPC accounts, you know that having enough time to eat, sleep, bathe and boost all your clients’ profits can be - well, challenging.

That’s where Google Analytics Custom Alerts come in. Custom Alerts act kind of like push notifications for account activity and can keep you up-to-date on major shifts for any channel you’re responsible for.
Some quick examples you might set alerts for:
- Shifts in clicks
- Shifts in impressions
- Shifts in revenue (or conversions)
These alerts aren’t in real-time, but you can set your custom alerts to measure performance compared to the same day in the previous week. This is especially helpful if you do any kind of ad scheduling where day-over-day performance may have natural differences based on your settings. Whenever your custom alert meets the conditions you set, you’ll get a cool email like this one (which is one of my personal favorites):

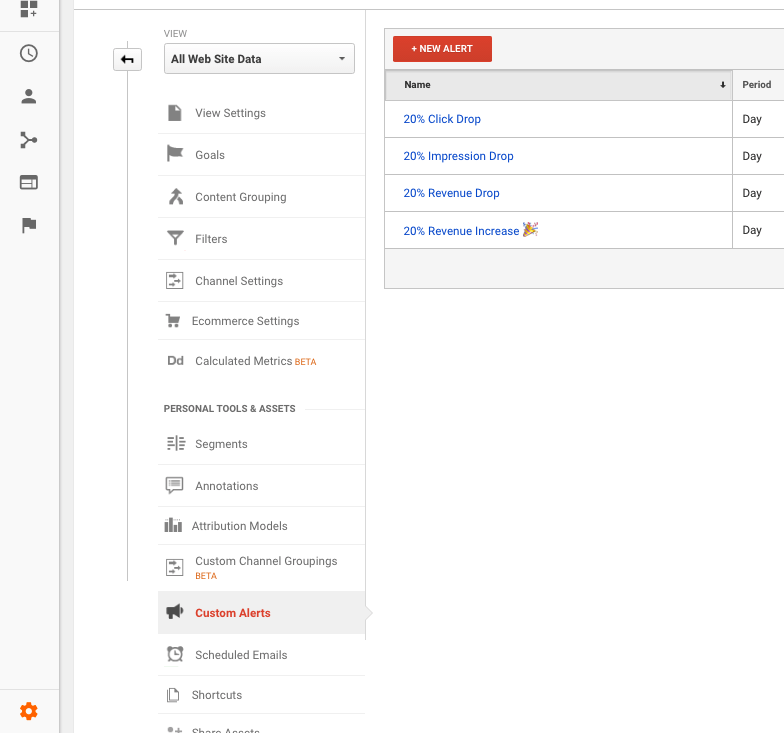
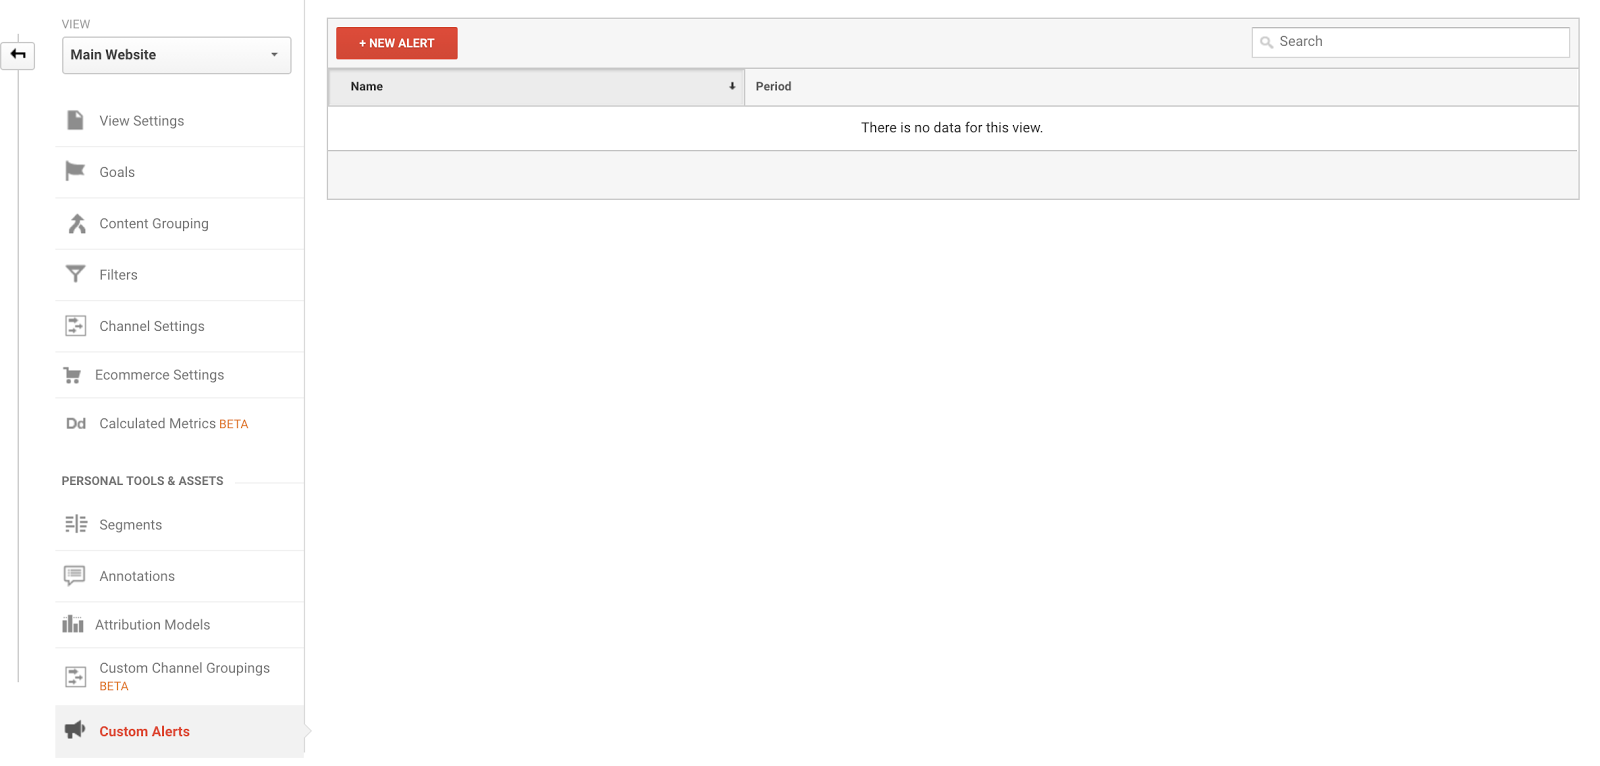
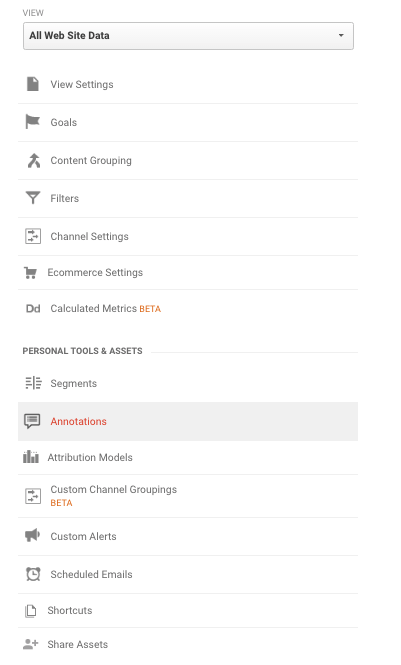
To start creating your own custom alerts, go to the Admin panel in your Google Analytics account, go to Custom Alerts under the View panel, and add a new custom alert.
Here’s an example of how you’d set up an alert to monitor a 20% drop in impressions from your PPC traffic:
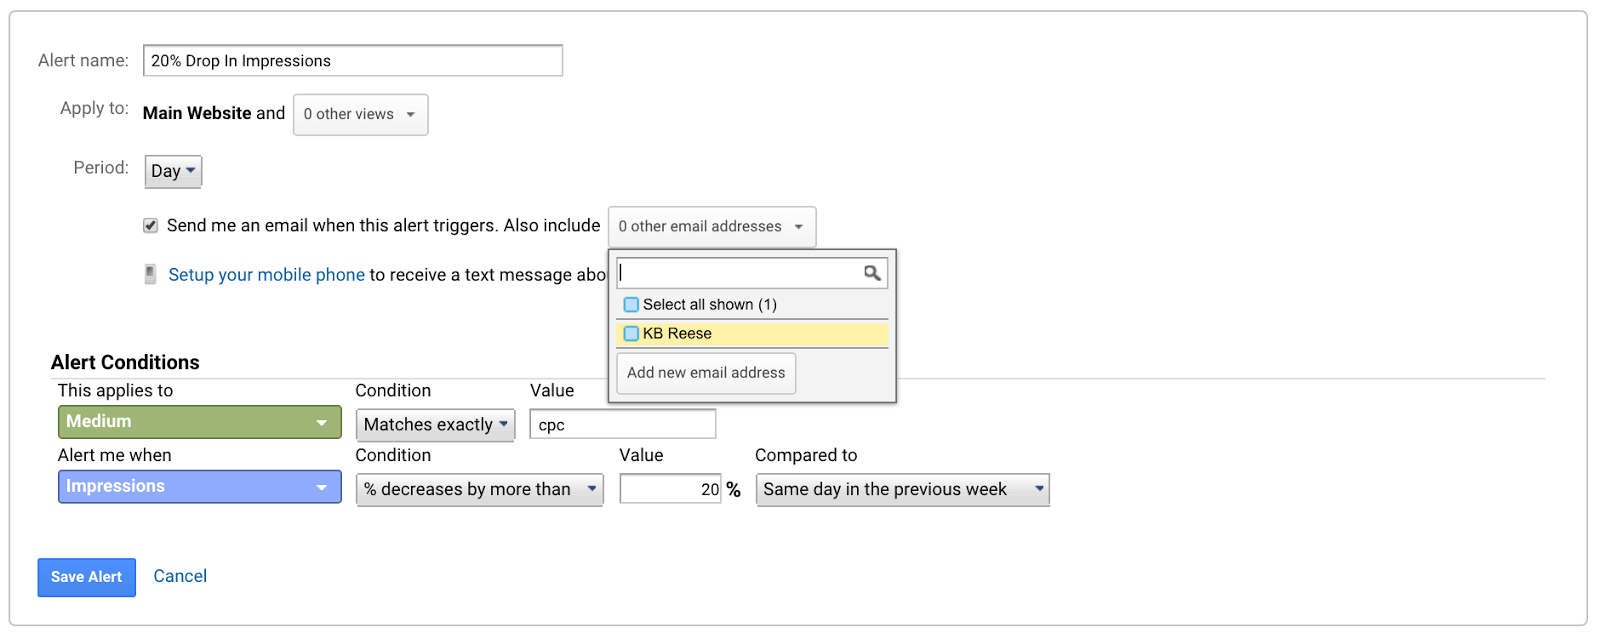
I prefer to set custom alerts to base their comparisons off the same day in the previous week--because in many accounts, not all days of the week behave consistently, so this helps to control your comparisons.
In addition to having alerts emailed to you, you can also have them texted to you. With Analytics always on the lookout for shifts in your accounts, you’ll get guidance on what to look for in your accounts, and finally have some time to unwind.

21) Useannotations to add context to your data.
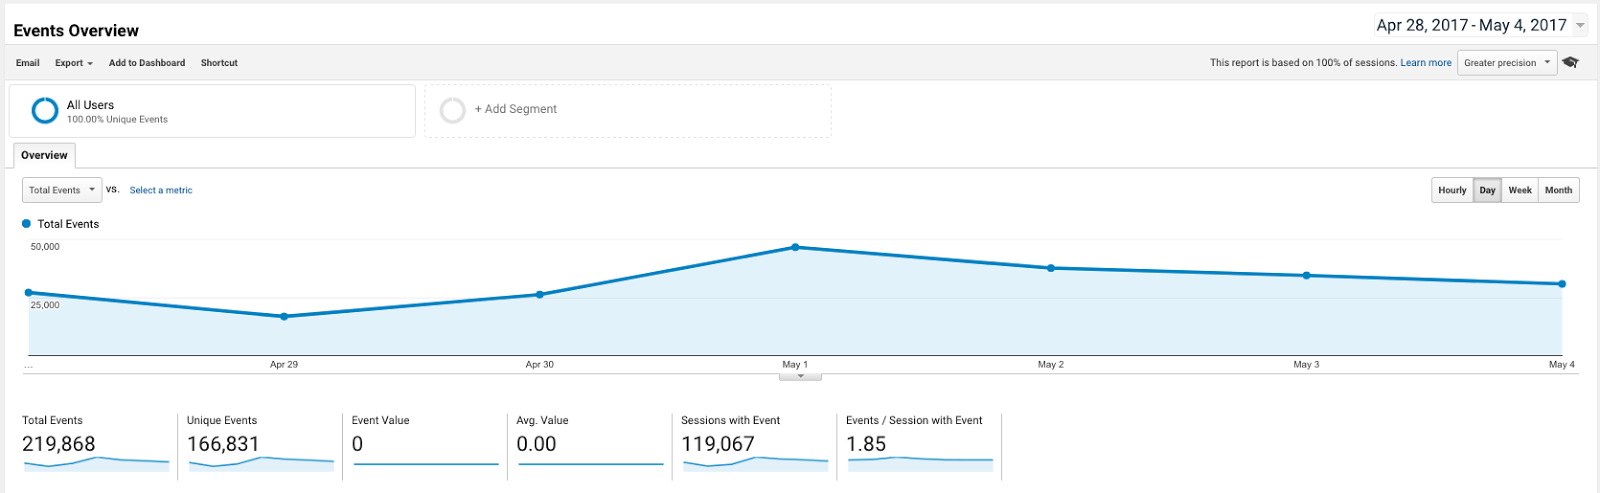
Have you ever encountered a Google Analytics report that looks like this?
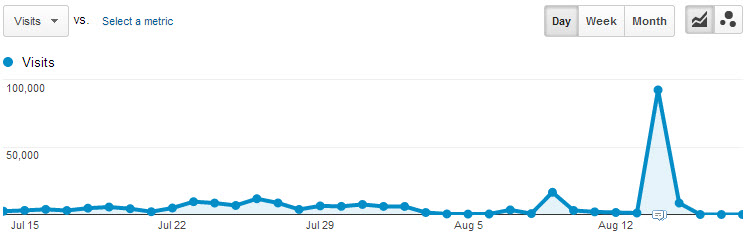
If you’re really close to the data, you may recognize why a spike like this may happen. But what if you forget? What if someone else who works with the data is trying to understand what happened?
That’s where annotations come in. Annotations allow you to add a little speech bubble on a given date, and these are useful to name any situations that could significantly affect how your data appears.
For example, I love to use these whenever a client is transitioning their site from Google Analytics to Google Tag Manager, or if any major design changes are applied to their site. If there are any significant changes in a site’s data, it can be useful to trace these back to a specific event.
Other examples of when you might use annotations include:
- New marketing campaigns
- Website design and content changes
- Website outages
- Industry changes
- Competitor activity
- News or weather updates that could affect your site
- Any other time-specific things that could affect how people behave on your site
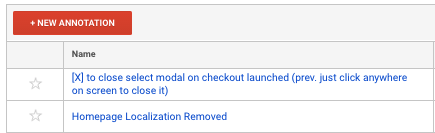
Whenever you create an annotation, you’ll see a small annotation bubble show up on the bottom of your report’s chart, like this one:
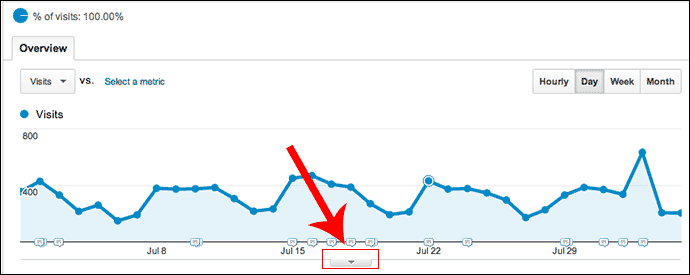
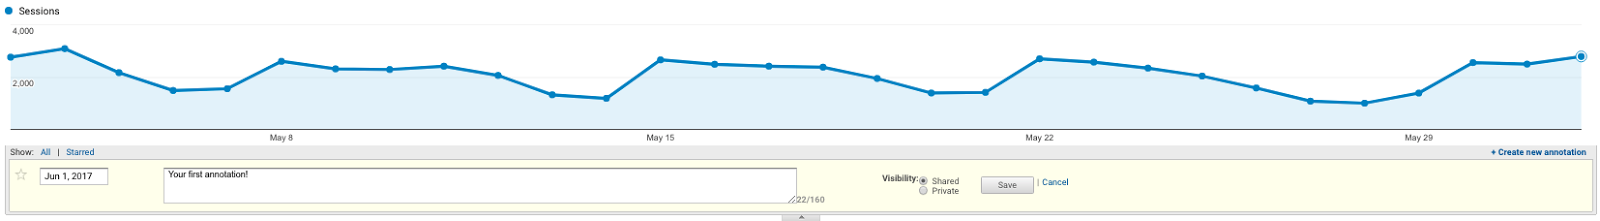
This will bring a dropdown menu that allows you to enter an annotation of up to 160 characters. By default, annotations are set to the most recent day in the date range you’re viewing, but you can (and should) adjust this to reflect the day of the event you’re writing or annotating. And that’s it. Pretty straightforward, right?
Here, you can see all annotations associated with a given view, the date they were added, and who added them.
Wrap Up on Google Analytics for PPC
If you’ve made it to the end of this blog post, and have already started trying out some of the techniques here, you’re well on your way to becoming a pro at integrating Google Analytics with your PPC efforts.
Google Analytics offers a lot of data that AdWords doesn’t, and using the reports mentioned here can sharpen your idea of kinds of users coming to your site, the goals and conversion journeys they’re completing, and areas where they may be having difficulty converting.
Google Analytics offers a lot of data, and it can be easy to get lost in the dozens of dashboards, but this should be a good stepping stone to focus your analysis and charge up your PPC reports.
What other reports do you use to better measure your PPC and drive more conversions? Add in the comments below. Also, I would love to know if you found it valuable to have the podcast along with this blog post as we’re considering adding more.

