


Your conversions aren’t where you want them to be, and you’re wondering if visitors are
- clicking on your call-to-action (CTA)
- interested in your benefits section or
- scrolling down to see that rave review.
Wouldn't it be great if you knew what they were doing? Then you could plan your next move, right?
Well, you can.
How?
Enter heatmaps.
Heatmaps are a strong data visualization tool to discover what your users are doing when they’re visiting your landing page.
We’re going to dissect heatmaps and explore their benefits that ultimately lead to better landing pages and higher conversions. We’ll even talk about a few use cases so you can truly see the value of heatmaps for real-life applications.
By the end, we promise you’ll add this to your list of landing page best practices.
Get brand new conversion strategies straight to your inbox every week. 23,739 people already are!
What is a heatmap?
Heatmaps show data that demonstrates the users’ actions throughout a website, homepage, landing page, etc.
To further understand how heatmaps describe data, let’s first look at the different types of data.
What are the main types of data?
There are two main types of data: quantitative data and qualitative data.

Quantitative data is numerical data, created with analytics tools like Google Analytics, compiled of metrics like page views, bounce rate, and other web analytics. For example, if a landing page has 2,000 new visitors, that’s considered quantitative data. Check out some of the most underrated Google Analytics features here.
Qualitative data is descriptive data, based on observations and experiences. If a user submits an exit survey saying they couldn’t find information on pricing, that is considered qualitative data.
So, which type of data do heatmaps give you?
Heatmaps are a graphical representation of data to show user experiences, which would make it qualitative data.
What are heatmaps used for?
Heatmaps are a great way to test visitor behavior optimization.
Conversion rate optimization (CRO) designers and strategists, as well as marketers, use heatmaps to see if users are interacting with important content or other page elements on a particular page.
This visual summary offers information needed to identify insights and help with landing page optimization and A/B testing.
How did heatmaps originate?
The earliest heatmaps were on paper.
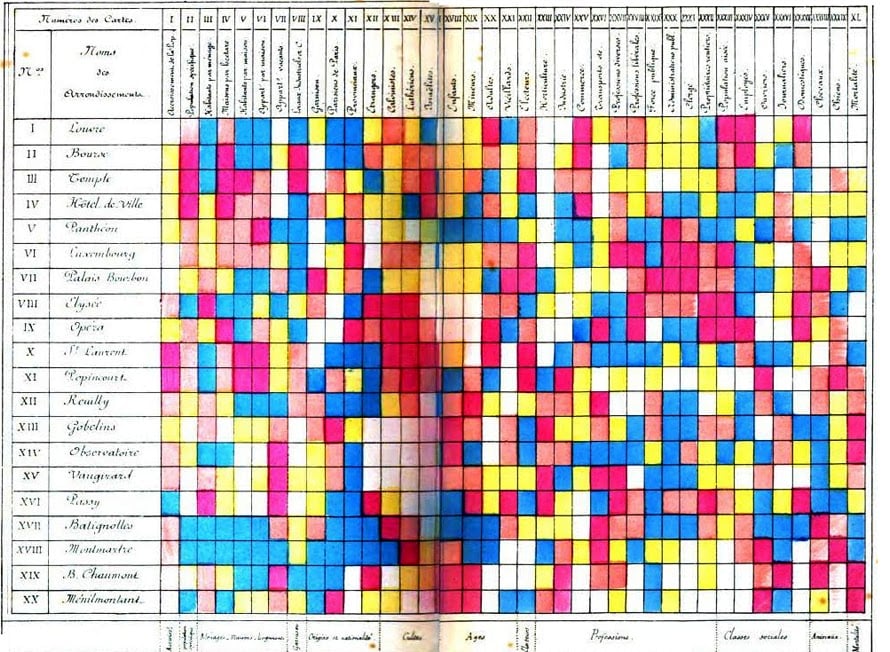
Small dark gray or black squares were used for high values and lighter values represented low values.
In 1873, Loua was the first to use a color scale — white, yellow, blue, red — with white for low values and red for the high value.
Leland Wilkinson developed the first modern-day heatmap with high-resolution colored graphics, and software designer Cormac Kinney trademarked “heatmap” in 1991.
Even though the concept is the same, heatmaps have changed a lot since their ideation. So how do we read them today?
How do you read heatmaps?
Heatmaps show how website visitors interact (or don’t interact) with parts of the page using a variety of colors to demonstrate different levels of user interaction.
Warm colors (red, orange, and yellow) indicate high user engagement, while cool colors (green, blue, and purple) indicate low user engagement.
Let’s take a look at the example below:
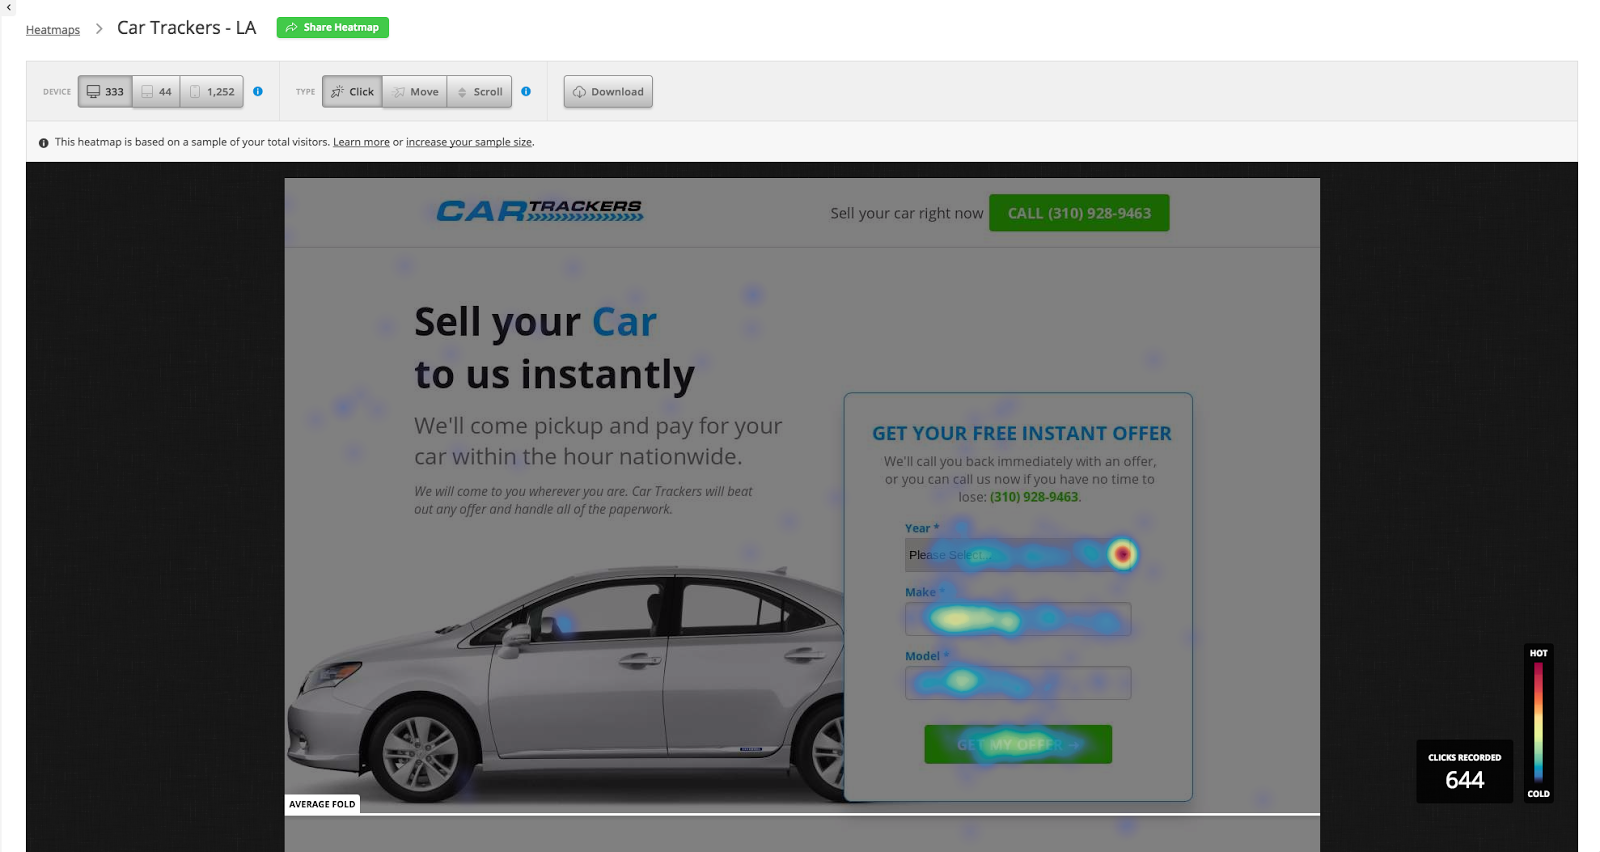
In this example, a high number of users are clicking on the dropdown arrow, as indicated by the red area, and a moderate number of users are clicking on the form fields and CTA, as indicated by the yellow/green areas.
Now you know what heatmaps are used for and how to read them, you may still be wondering what tangible results you can get from them. Let’s talk about that next.
Why use heatmaps?
There are great benefits to using a website heatmap, including
- finding the right website layout
- picking a single goal and
- removing distracting elements.
Finding the right website layout
Designing a landing page can be difficult because you may never be sure if the design you decided on was “the one.”
Heatmaps take the guesswork out of designing landing pages.
They can show you where visitors click, hover, and scroll to let you know if you need to alter your website to make sure your most important content is getting the attention you want.
Picking a single goal
If you happen to be using more than one CTA to address additional information you feel the user may need to know, heatmaps can narrow down your CTA options based on the users’ behaviors.
Heatmaps can tell you which CTA users are paying attention to the most, so you know which of your goals to prioritize.
When it comes to CTAs, we suggest sticking to one to maximize your conversions. Read more of our winning landing page ideas here.
Removing distracting elements
Sometimes usability isn’t clear.
By using heatmaps, you can determine if users are clicking on things they shouldn't be.
Once you know that, you can rework the layout to remove unnecessary or confusing elements and guide website visitors where you want them to go.
Now that you know why heatmaps are essential, let’s get into the main types of website heatmaps you can try.
What are the main types of website heatmaps?
There are three common types of heatmapping tools:
- Click maps
- Scroll maps
- Mouse tracking maps
Click maps
Clicking is a powerful indicator of interest.
Because of this reason, click heatmaps are the most common type of heatmap.
They show you an overall aggregate of where visitors click (or touch for mobile devices) on your landing page. The more website visitors click on an area, the warmer the color will be; the fewer website visitors click on an area, the cooler the color will be.
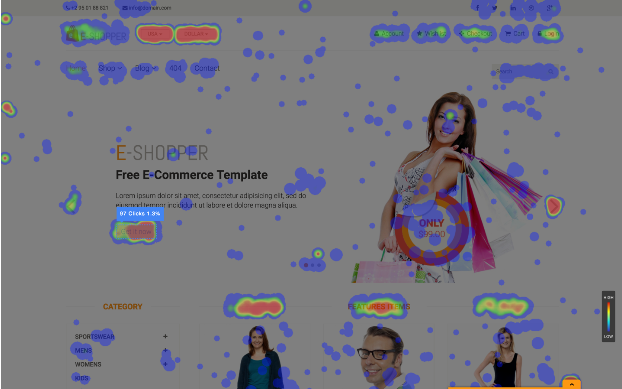
Hover maps
Hover maps, also known as move maps or confetti maps, track mouse movement and indicate what areas visitors hover their cursor over.
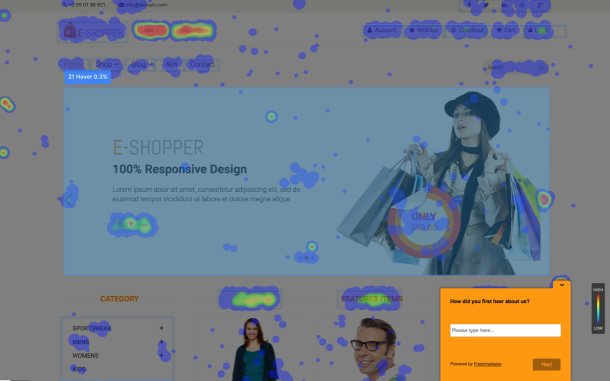
With these maps, you might be able to identify important sections and movement patterns, which can let you know if visitors are hovering around important actions or informative sections.
The downside about hover maps is that the users’ cursors are not always aligned with what they’re looking at, per a 2010 experiment by Google’s Senior User Experience Researcher, Dr. Anne Aula.
Scroll maps
Scroll maps show visual presentations of users’ scroll depths — how far down they scrolled down on a webpage.
Because users are most likely to drop off the further down they are on a webpage, the most pertinent content must be at the top.
This heatmap is also one of the best ways to track user engagement.
If you're using the time on a page metric to measure engagement, you can actually improve engagement by checking the scroll depth of your users with scroll maps.
What are some heatmap use cases?
Let’s look at some real-life heatmap applications.
For these examples, let’s say you’re working with an eCommerce landing page.
Click map use case
You feel you have a great landing page design, but you’re not sure your users understand what they should be doing.
If users are clicking on non-clickable elements, like an image caption, or not clicking on clickable elements, like the CTA button (i.e. Add the Card), this great info for usability testing on this page design.
This click map might encourage you to conduct a redesign to better illustrate what parts of the page users should be interacting with.
Hover map use case
You listed all of the great benefits of your products on your landing page, but your conversions are still stagnant.
If users are hovering around your benefits section but are not taking action, it could be a sign that they’re not interested enough in your offer or it’s not clear enough to understand.
This hover map data may show you where you can push the needle and convince your users by tweaking the copy, adding an image to further demonstrate your offer, etc.
Scroll map use case
There’s an amazing review of your products on your landing page, but users still aren’t buying.
Scroll maps can indicate if users are dropping off before they see that section of your landing page.
If users are dropping off, this data can hint to you to position that content higher on your page so they actually see it.
Before we wrap up, let’s look at some popular heatmapping tools you can try.
What are some popular heatmap tools I can use?
There is a variety of heatmapping software you can try.
Some of the most popular ones are:
They all have different strengths, features, and prices, so choosing the best one for you will depend on what you’re looking for.
Turn up the heat on your landing pages
So there you go. It’s that easy.
Getting into the users’ minds to understand what you’re doing well and what you can work on has huge payoffs.
You’ve learned there’s more to driving conversions than incorporating just landing page basics, and why and how you can use heatmap data to improve your landing page designs.
Thirsty for more CRO tools to get your landing page at it’s best? Check out our favorites here.
Happy heatmapping.

