


A couple of years back I had the opportunity to work with an eCommerce business that moved from one eCommerce platform to another.
The business sells a high-value product which is traditionally difficult for customers to buy online because most people prefer to see it and touch it.
They were doing pretty well and coming into their busiest time of the year.
I was worried that this big platform change might have a negative impact on the conversion rate, but I was also very interested to see what would happen.
Changing from one platform to another is a big jump and it means practically everything will change, from headers and footers to navigation, category pages, product pages and checkout.
I’ve had experience in the past where businesses have changed platforms and seen a dramatic drop in conversion rate.
They usually seek my services after the fact, at which point it’s very difficult to pinpoint exactly which of the changes has caused the problem.
So, what happened to the conversion rate when we moved the platform?
Well fortunately it remained largely stable.
This led me to look more closely at the data and to consider what other factors might affect conversion rate.
I quickly came to realize just how important the products are.
That seems pretty obvious, but while many businesses focus on optimizing user journeys, checkout abandonment etc, there’s not so much discussion on product optimization.
And while there are lots of blog posts about how to reduce your shopping cart abandonment, there are relatively few on how to optimize your individual product lines.
By analyzing which products are performing poorly and addressing those issues, you can potentially boost conversion rates by 20%.
It can also lead you to reconsider whether stocking specific products lines is a good idea at all, freeing up warehouse space and the cost of holding unnecessary stock.
This all helps you focus your energy on the products that drive your profits and it’s what buyers in the most successful offline businesses spend a lot of time doing.
Some of the tools that have been introduced by Google Analytics such as Google Analytics Enhanced eCommerce has made the tracking and reporting on merchandise a little bit easier.
However, I started tracking pre-Enhanced eCommerce and much of the following relates to tracking I implemented myself.
Get brand new conversion strategies straight to your inbox every week. 23,739 people already are!
The principles however remain largely the same.
The Code
To help us analyze the data we need to add some extra tracking to Google Analytics.
The following code isn’t implemented out of the box with Google Analytics so you need to work with your developers to get this implemented.
It can be added quite easily to any eCommerce platform.
I used Google Analytics Events to track visits to the product page and the shopping cart page.
Google Analytics Events lets us track things that happen on a very granular level.
By tracking the product name as an event, I was able to match the product name with the Google Analytics eCommerce sales data to do a comparison on:
1) how many people visited the product page,
2) how many reached the shopping cart and,
3) how many went on to complete their orders.
In the following examples you only need to add either the Google Analytics Classic (the old way) OR the Google Analytics Universal (the new way).
You don’t need to add both.
Product Page – tracks each time a product is viewed
- Google Analytics Classic: <script>_gaq.push(['_trackEvent', 'L2B - Product', 'Product Name', 'Category', Price, true]);</script>
- Google Analytics Universal: <script> ga('send', 'event', 'L2B - Product', 'Product Name', 'Category', Price);</script>
Shopping Cart – tracks each time a product is added to cart
- Google Analytics Classic: <script> _gaq.push(['_trackEvent', 'L2B – Checkout', 'Product Name', 'Category', Price, true]);</script>
- Google Analytics Universal: <script> ga('send', 'event', 'L2B - Checkout', 'Product Name', 'Category', Price);</script>
What I didn’t do, but I wish I had, was added tracking to the Category page.
This would have given me even more scope to track and analyze the data.
What you should do is fire this piece of JavaScript whenever a product is displayed on the screen.
So if there were 16 products on the page and only 8 were visible, this code would fire for the 8 products, because these are the only ones the User had a chance to see.
- Google Analytics Classic: <script>_gaq.push(['_trackEvent', 'L2B - Category', 'Product Name', Category', Price, true]);</script>
- Google Analytics Universal: <script> ga('send', 'event', 'L2B - Category', 'Product Name', 'Category', Price);</script>
Note: the term L2B above stands for "Look to Book" or "Look to Buy" which is another way to describe this type of analysis.
Once you add these and let the data run for a while, here’s what you should see in Google Analytics:
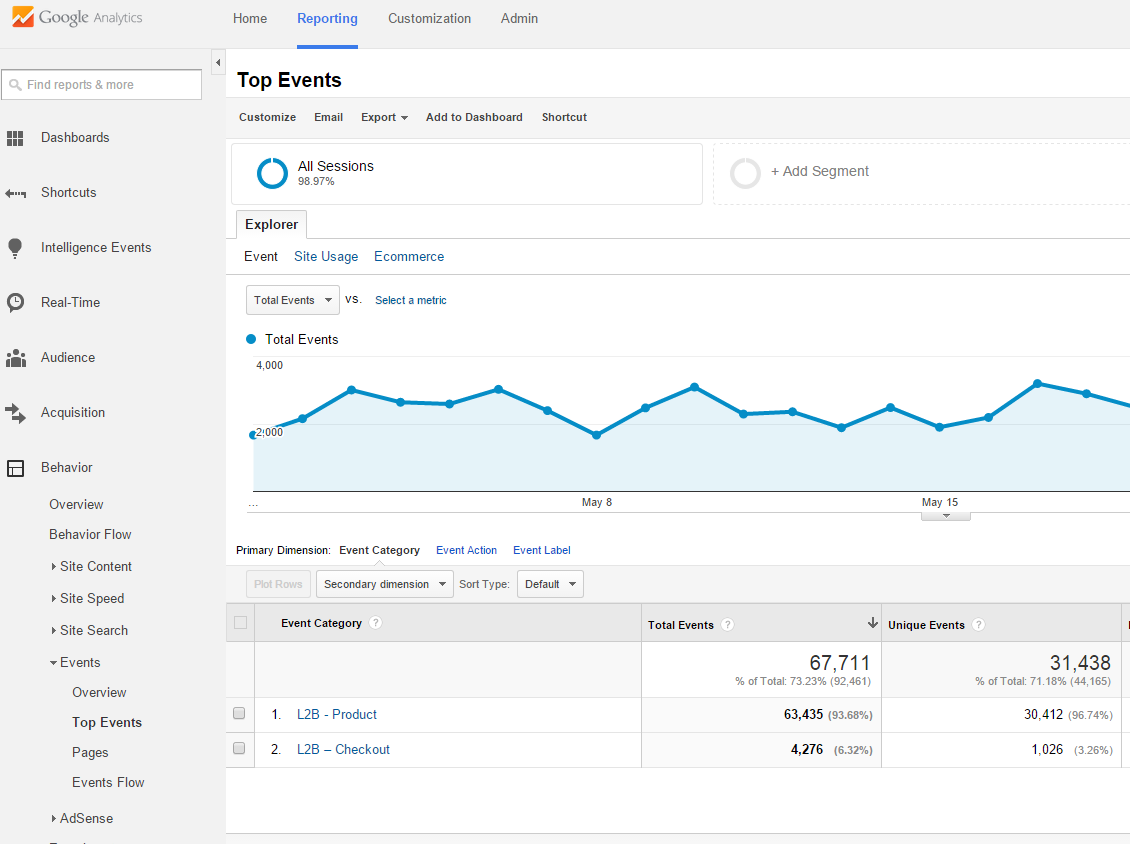
Into Excel and Start the Analysis
To complete this analysis you need to go into the Events report in Google Analytics and export each into an Excel spreadsheet.
Then export the sales data from Google Analytics eCommerce and add it to the excel spreadsheet (or export the data out of your eCommerce system which may be a bit more accurate than Google Analytics).
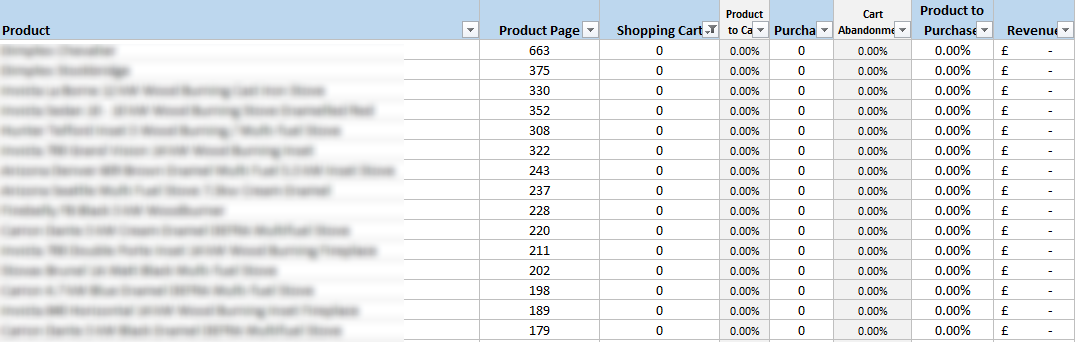
Once that's completed, you need to match everything up so you can see the products perform across the funnel.
It should look something like this:

Once everything is in a spreadsheet, the following three areas are worth taking a look at:
- Abandonment Rate By Brand & Category
- Products that Never Added to a Shopping Cart
- Products Added to Shopping Cart But Not Purchased
This data will be extremely interesting to any business owner or buyers in the organization and they’ll be the key people you’ll need to show this data to, to get some decisions made and actions taken.
Abandonment Rate By Brand & Category
For my customer, they had an overall checkout abandonment rate of 60%, but I wanted to see what was behind this average.
I did some analysis on the abandonment rate of products to try and find any patterns.
What I discovered is that brand/category combinations seem to have a reasonably stable abandonment rate.
A brand and category combination might be something like Nike Running Shoes another might be Adidas Running Shoes another might be a less well-known brand of running shoe, let’s call them Value Brand Running Shoe.
A lower-priced brand/category combination might be Nike Baseball Caps.
So I discovered some brand category combinations that had an abandonment rate of just 30% which led me to consider that the shopping cart and checkout isn’t too bad.
It suggests that there are no real problems with checkout functionality/usability and the problems might lie with specific products.
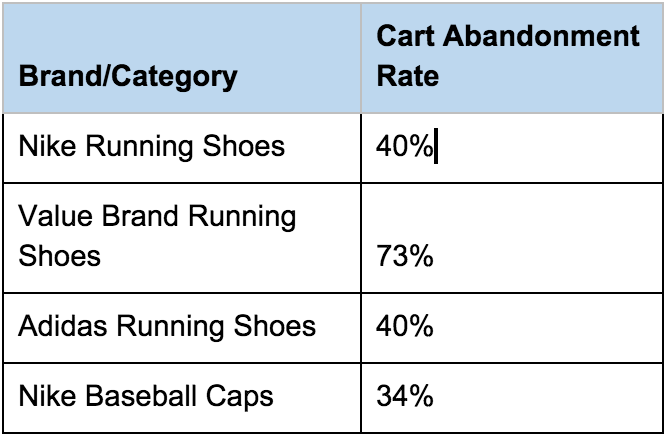
The following table shows a fictional example for demonstration purposes for each brand/category and how many visitors add those products to the shopping cart but then abandon it.
Making the Data Actionable
When you compare a single category like Running shoes you might see that each brand in that category has its own abandonment rate.
So, for the example above Nike Running Shoes 40%, Value Brand Running Shoes 73% Adidas Running Shoes 40%.
This suggests that the abandonment rate for this category is typically in the range 40-70%.
At the higher end you might have a less well-known brand, where although it’s well priced, people may consider it before going for the better-known brand.
At the higher end is Nike and Adidas which are strong brand names, so they have lower abandonment rate.
To make this data even more actionable we try and see what’s behind the averages.
It’s very useful to look at the abandonment rate of individual products within the brand/category and see which are above average.
If you then take those products and look at the product pages you might start to see issues like poor quality imagery, missing product images, poor reviews that are causing these products to perform poorly compared to similar products.
If you can address these issues, then you have an opportunity to reduce shopping cart abandonment for these particular products.
This will in turn reduce your overall shopping cart abandonment rate and generate more revenue and profit for your business.
Products that Are Never Added to a Shopping Cart
This is pretty self-explanatory.
We’re looking for products that have been viewed many times, but have not been added to the shopping cart.
So for my customer, I filtered the products by “Visits to Shopping Cart = 0” in Excel.
I went through the products and looked at the product pages.
You can see from the list below some small issues in the product page, can have enough of an impact to prevent products being added to cart.
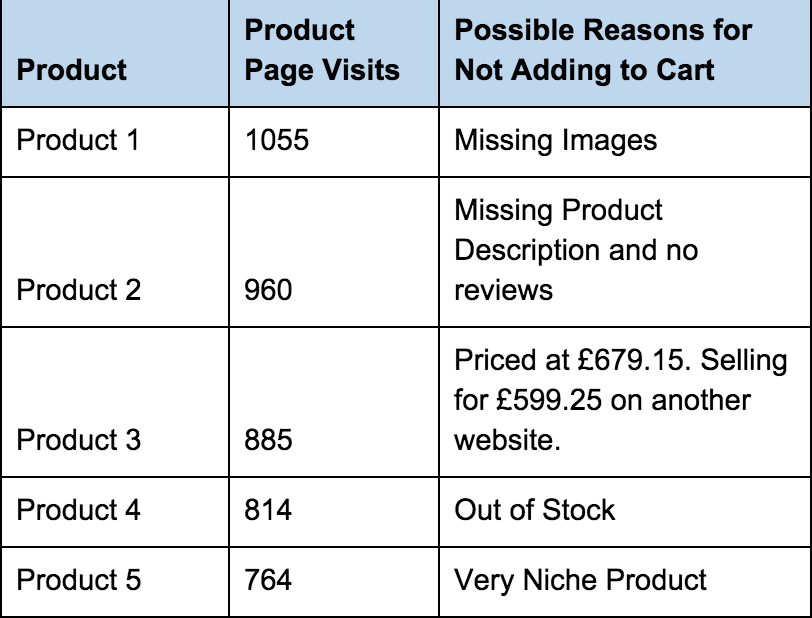
For products, where everything seemed to be OK on the product page I searched on Google to see how the competitors looked.
You’ll see above, that I quite quickly found better priced products in a few cases within the first couple of results in Google.
So if I can do this price comparison quickly it’s likely that people are interested in these products will do the same price comparisons.
Presenting these findings to the business owner may lead them to rethink their pricing strategy.
It’s always best to work closely with someone on the business side, because they will have the insights required to identify any issues you may not be aware of.
Once again, fixing issues with individual products, will get more people adding to cart and generate more sales.
Leading to an increase in your conversion rate.
Products Added to Shopping Cart But Not Purchased
This is pretty similar to above. In this case we’re filtering in Excel by “Shopping Cart Visits > 0 AND Purchases = 0”.
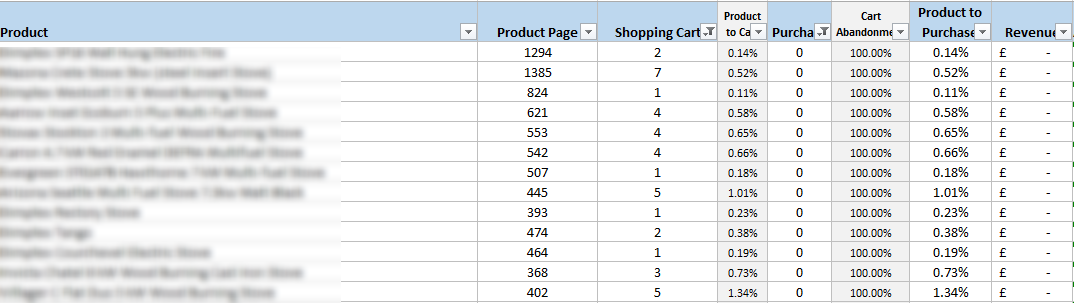
In this case it’s even more pronounced that product pricing is the issue, at least for my customer.
We can assume that once people add to cart, they move from the research stage of the buying cycle to the point where a decision to buy a particular product has been made.
Once that decision is made, the user moves on to price comparison.
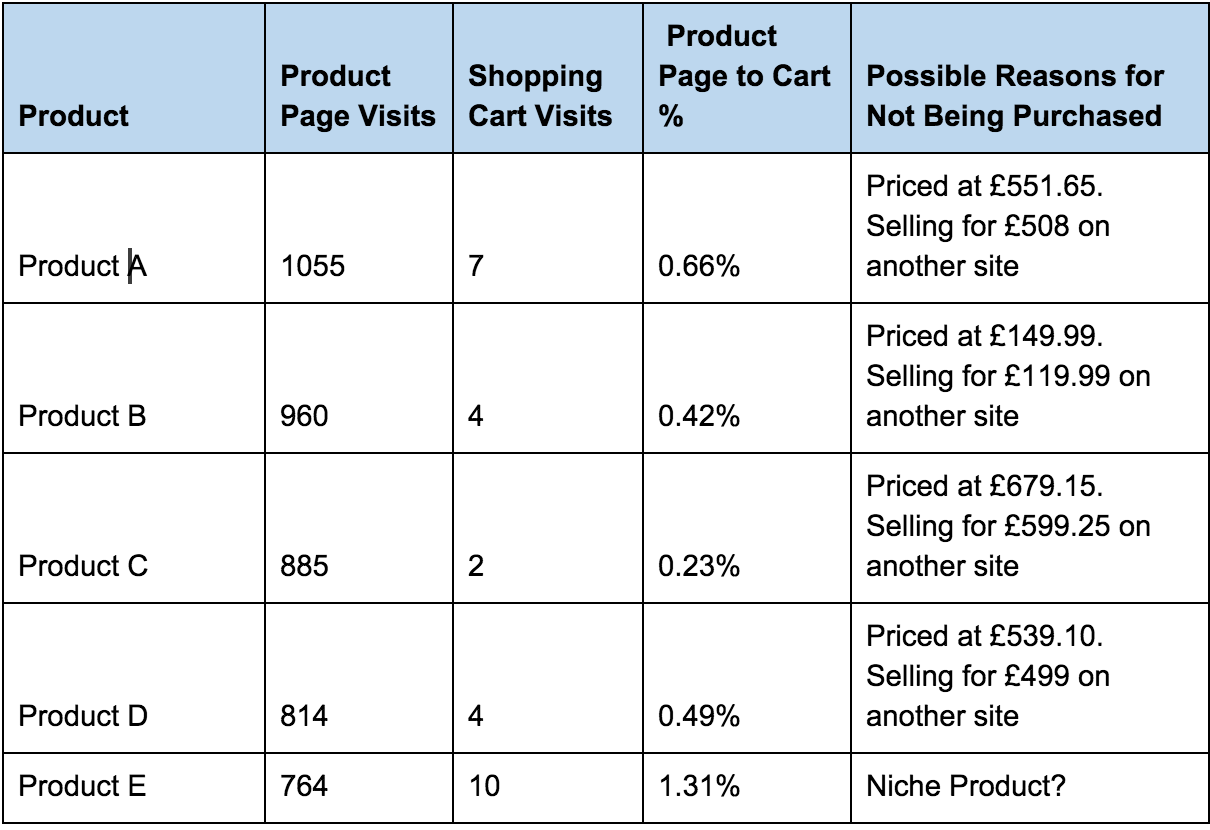
Another insight from my analysis above was that Product E is an especially niche product with a very high ticket price.
Although the product has many views and quite a few Add to Carts, it has never been purchased.
Maybe the only reason it’s not selling is that it’s a very high value product and people would prefer to buy it in an offline store where they can go and actually see the product and get some specific advice.
So, when implementing a conversion rate optimization strategy for an eCommerce website, I recommend looking past user journey and onsite experience and try and dig a little deeper to discover any product issues.
This is the core work for offline retail stores who only wish they had this type of data to work with.
You might discover interesting insights related to the power of brands, or identify problems with specific products that can be easily rectified.
Implementing the analysis above is one of the reasons we’ve been able to increase the conversion rate for this customer by 68%.
P.S. Learned something new? Be sure to share so you can make your competitors look silly.


