You spend time, money, and effort managing Google Ads campaigns to get traffic to your landing page, so it behooves you to carry that momentum through to a conversion on your page.
But when your landing page optimizations tank and all that focus in the front end goes up in flames, your page becomes a demonstration of wasted time, blown budget, and that ugh feeling that comes from missing the effing mark.
It sure doesn’t feel special; none of that wins applause or return on ad spend (ROAS).
So how do you lift your end game and clinch more wins?
With better website testing.
Website testing points out what elements on your landing pages convert out the wazoo, and which ones sit there with shit-eating grins on their lackluster faces 💩😬
Stop wasting your time testing stupid stuff. And don’t make decisions on dumb metrics.
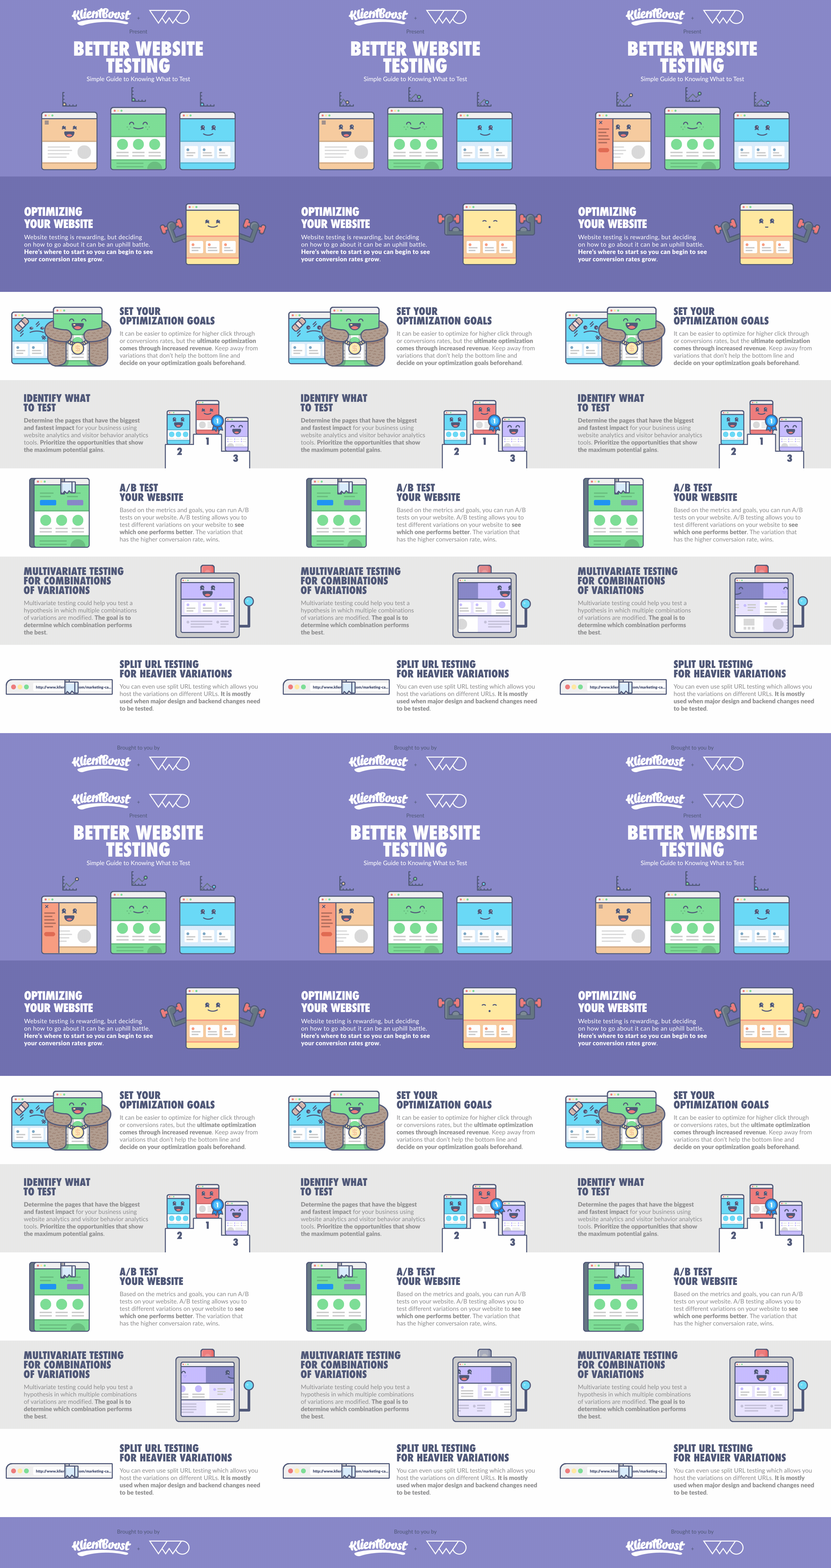
Fun factor: We partnered with VWO to show you how to properly optimize your landing pages from start to finish. With these five website testing steps, you’ll turn your landing pages into well-designed, made-to-win converting machines:
- Set optimization goals
- Identify what to test
- A/B test like the best
- Multivariate test for clever combos
- Split URL test (the heavy hitters)
Entrer.
Get brand new conversion strategies straight to your inbox every week. 23,739 people already are!
Set optimization goals
Wondering where to start?
Step one is to figure out your optimization goals to test each conversion component the right way.
There’s a handful of prioritization frameworks out there to choose from. We like four of them—and the fourth is our favorite:
1. Potential, Importance, Ease (PIE)
The PIE system is pretty popular. It measures
- how much improvement can be made (potential)
- how valuable traffic is (importance)
- how complex the testing will be (ease)
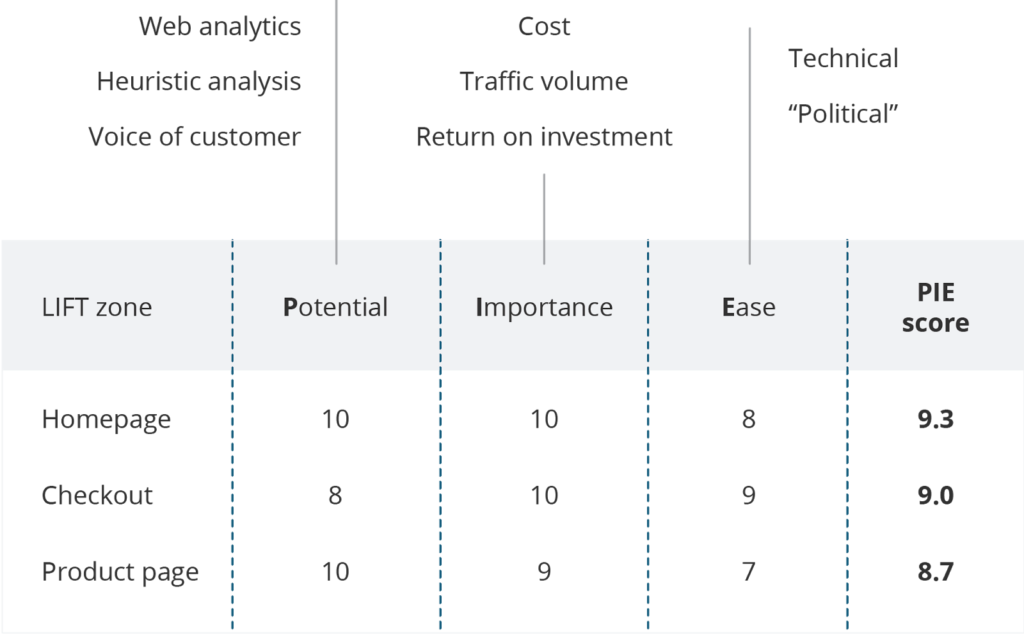
Adding scores to each of the three dimensions—potential, importance, ease—is subjective, so give it a bit of thought when you apply weight. Then A/B test the highest scores first.
2. Impact, Confidence, Ease (ICE)
This ICE framework helps you prioritize what to test first by measuring the
- impact of the test (if it works, how will that be a good thing?)
- confidence level you have in the test working
- how easy it will be to launch the test (test your hypothesis)

This scoring system is also subjective. Don’t get bogged down in the fine-tuning; keep your scores relative, and don’t worry about picking the perfect score. ICE helps you prioritize ideas. Think of it as ranking your minimum viable products.
3. Impact, Cost, Effort (ICE... Again)
There are actually two optimization systems with the acronym “ICE.” This ICE prioritization sorts tasks that compete for the same resources or a limited pool of funds.
- How will this task impact the company’s growth (benefit the company)?
- What will implementing this task cost?
- What amount of resources are required to test it (effort)

Classify each factor as high or low, then assign scores:
- High impact scores 2, low impact scores 0
- High cost scores 0, low cost scores 1
- High effort scores 0, low effort scores 1
Impact gets more weight than cost and effort because impact typically drives business decisions and might be approved even if the cost and effort are high.
Total ICE scores:
4: Extraordinary opportunity you should act on immediately
3: Strong opportunity you should work on quickly
2: Good opportunity you should pursue when resources allow
1: Small opportunity you should label as a future priority
0: No opportunity (don’t pursue)
4. ConversionXL’s framework (PXL)
Our friends at CXL came up with their own prioritization framework that makes a potential, impact, and ease more objective 👈 hooray.
Why is this our favorite system? Because an objective chart breaks subjectivity down into columns. That makes it easier on the ranker and provides a better bird’s eye view of optimization.

By prioritizing your optimization tests, you have a better idea of which optimization goals you want to test for and reach first.
Remember to match your optimization goals with your overall business and revenue goals. Improved click-through rates and conversion rates are only beneficial if they build revenue; if optimizing something won’t make you more money in the end, don’t bother.
You now have your goals outlined and ranked in order of importance.
What should you test?
VWO recommends testing almost anything on your website that affects visitor behavior.
Here are 11 things that affect behavior:
- Headlines: is your headline explicit and clear?
- Subheaders: Does your subheadline support your unique value proposition?
- Body copy: How’s the paragraph text readability (for conversions)?
- Testimonials: Are your testimonials accurate and realistic?
- Call-to-action (CTA): Does the CTA threat level match your audience’s intent?
- Links: Are you shooting for a 1:1 attention ratio?
- Images: Does your hero shot scream the benefit of your offer?
- Content near the fold: What’s the best landing page length for your specific offer?
- Social proof: Are your social proof numbers high enough to publish?
- Media mentions: Do press call-outs build or hurt your credibility?
- Awards and badges: Include awards and badges to build trust
These top 11 items will improve your conversion rates if you optimize them. For more ideas on usability testing, check out this 48-point guide that gets to the absolute bottom of which pieces of your landing page anatomy to test.
What to A/B test on your website
With A/B split testing, you isolate one factor at a time to see which of the two versions win more conversions.
Here’s an example of an A/B split test run by Novica to see which email capture format is optimal:
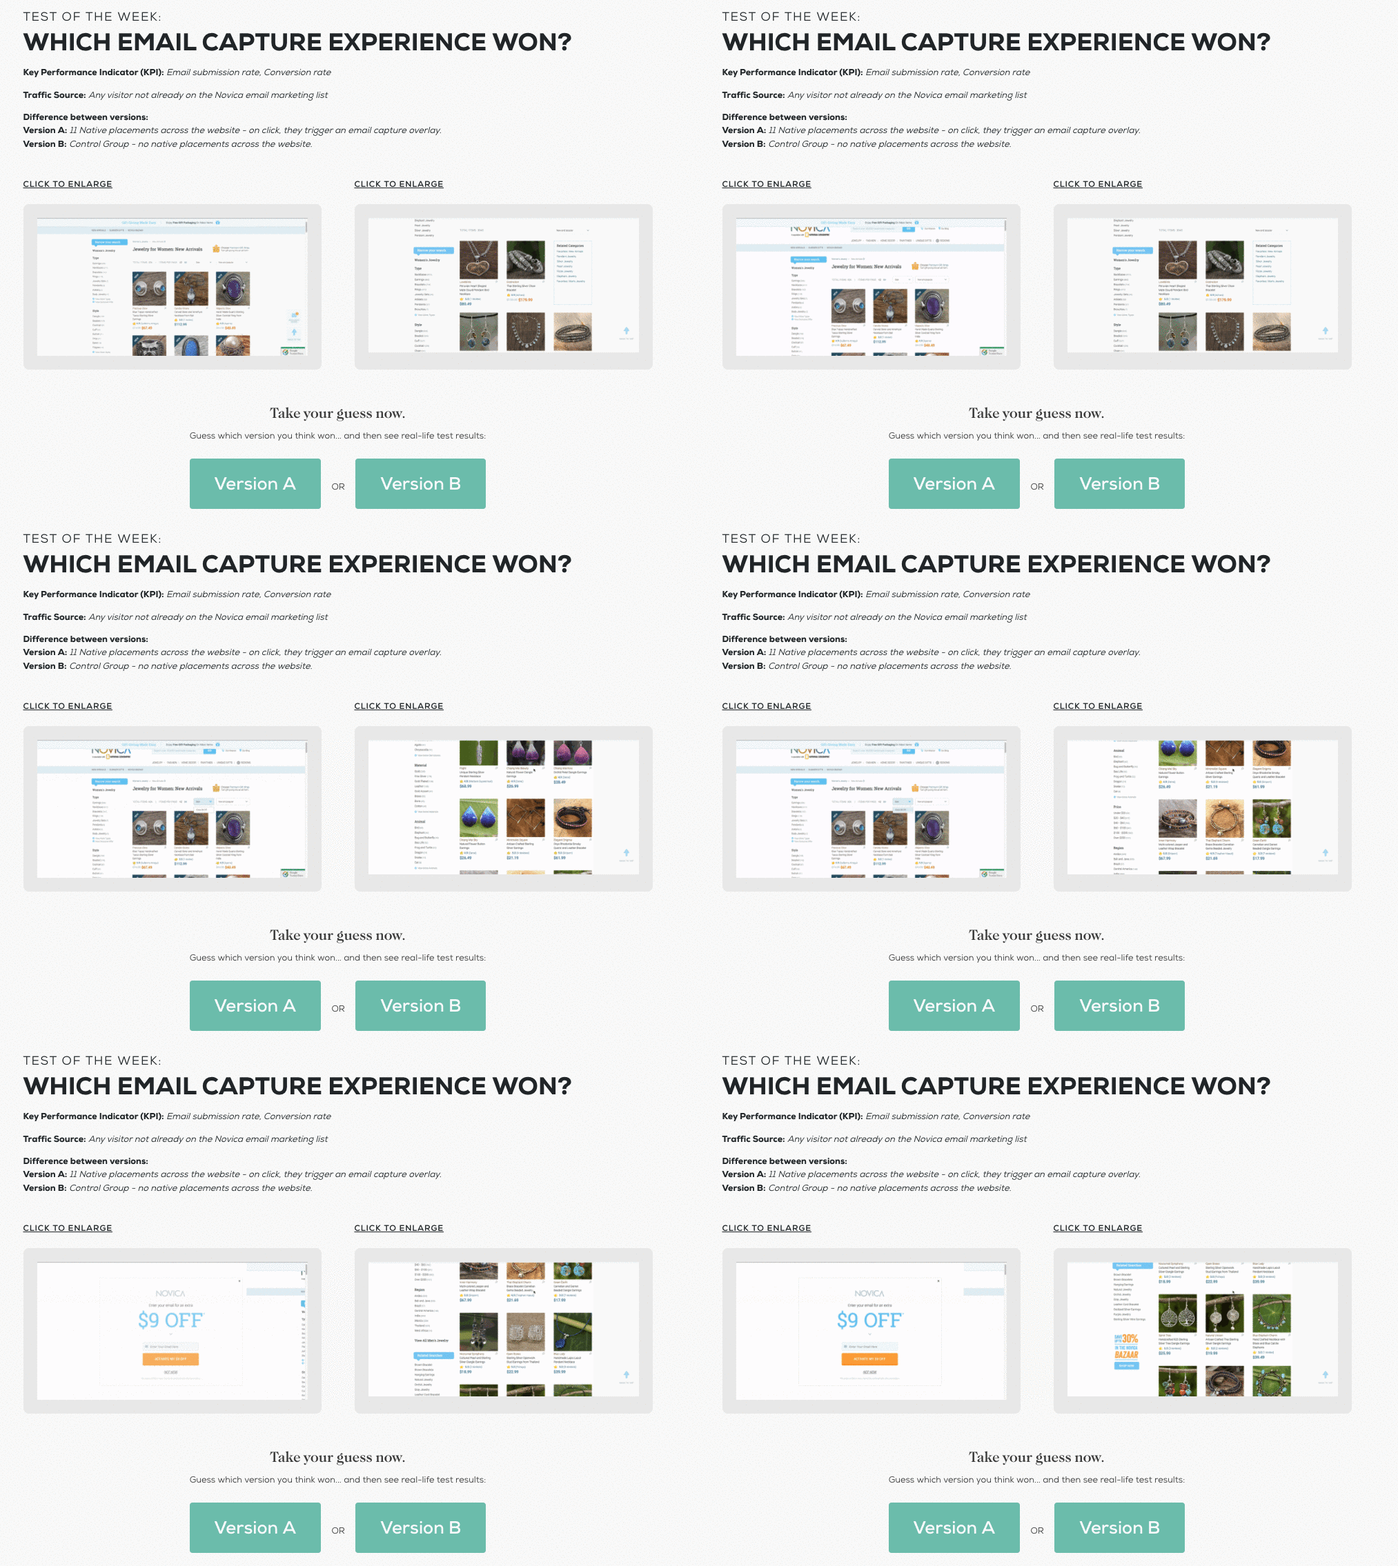
Email capture in Version A had an overall 67% lift in email submissions over Version B. Version A it is 🤩
VWO suggests following these six steps when A/B testing:
1. Study your website data
Google Analytics reports reveal insights that point you in the right decision-making direction. For example, an attribution report debunks what you think about visitors coming in from your PPC display ads:

Although the display ads didn’t bring in direct conversions, they played a hefty role in assisting conversions. Now you can dig deeper into your reports and find more specific trends.
Use these stats to figure out which parts of your site are high-performing and which parts aren’t converting as well. Then test those problem areas.
2. Observe user behavior
Usability testing tells you how people interact with your pages so you can identify stand-out bottlenecks. Observe behavior with three usability testing methods:
- Moderated in-person (physically sit next to someone and observe how they use your page: clicks, scrolls, body language)
- Moderated remotely (live virtual observation)
- Unmoderated remotely (screen record or hot map that’s analyzed later)
3. Construct a hypothesis
What stood out after checking your Google Analytics stats and observing your users? What does it look like the data is saying? Hypothesize on glaring stats first, then jot down what other problems deserve testing.
4. Test your hypothesis
It’s time to test specific ideas.
Here’s where you’ll implement A/B testing and create variants to find out if your hypotheses are true or not.
Don’t know how to do that? Get your learn on 👇
What variables should you test first?
15 Best Low-Effort High-Win A/B Testing Ideas to Boost Conversions
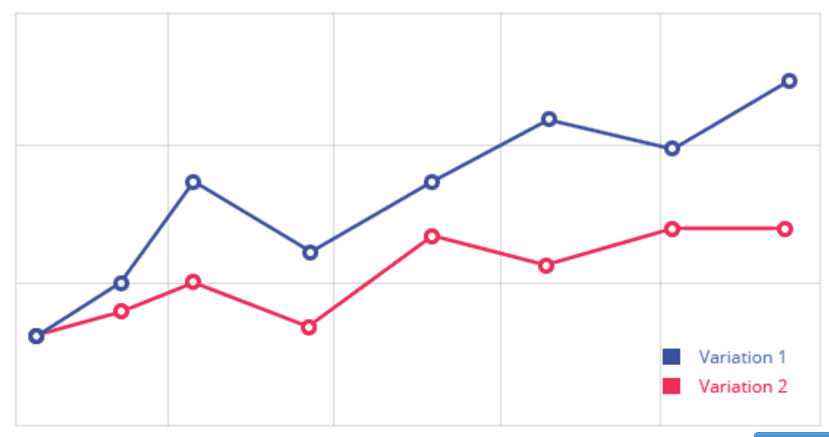
5. Analyze test data and draw conclusions
Collect the results from your A/B testing. What does all that data show? You should have a much clearer picture of which variant will optimize your landing pages and website.
6. Report results
Sharing is caring, especially when it comes to your team. Share your reports and keep your team members in marketing, IT, SEO, and CRO in the loop. When you’re all on the same page, move forward as a collective group.
Multivariate testing for variation combinations
But what if you have many items and combinations of each that you want to test? That might take some time with A/B split testing. No worries, multivariate testing is the way to go.

With multivariate testing, you spend the least time figuring out what headline, image, and CTA combo works best.
In the above example, you might see mixed results like
- Headline 1, Image 1, CTA 1: 3% conversion
- Headline 4, Image 1, CTA 2: 3.5% conversion
- Headline 2, Image 4, CTA 2: 1.5% conversion
- Headline 2, Image 3, CTA 1: 7% conversion
- Headline 3, Image 2, CTA 3: 2% conversion
Now you know what combination of headline, image, and CTA converts best, and you saved oodles of time by knocking out test items in one swoop. Just be sure your website testing process is calculated, intentional, and fits into your optimization goal.
Split URL testing for heavier variations
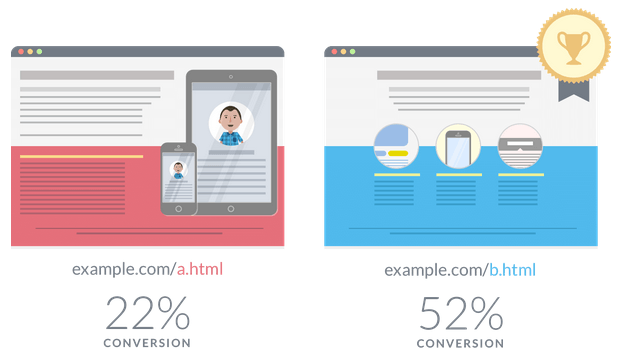
There’s A/B testing and multivariate testing, but then there’s split URL testing. With a split URL campaign, you can test multiple website versions hosted at different URLs.
VWO’s split URL testing tool splits traffic between two landing pages to determine which one converts better.
Take it a step further and set conversion goals for elements you want to track on your page.
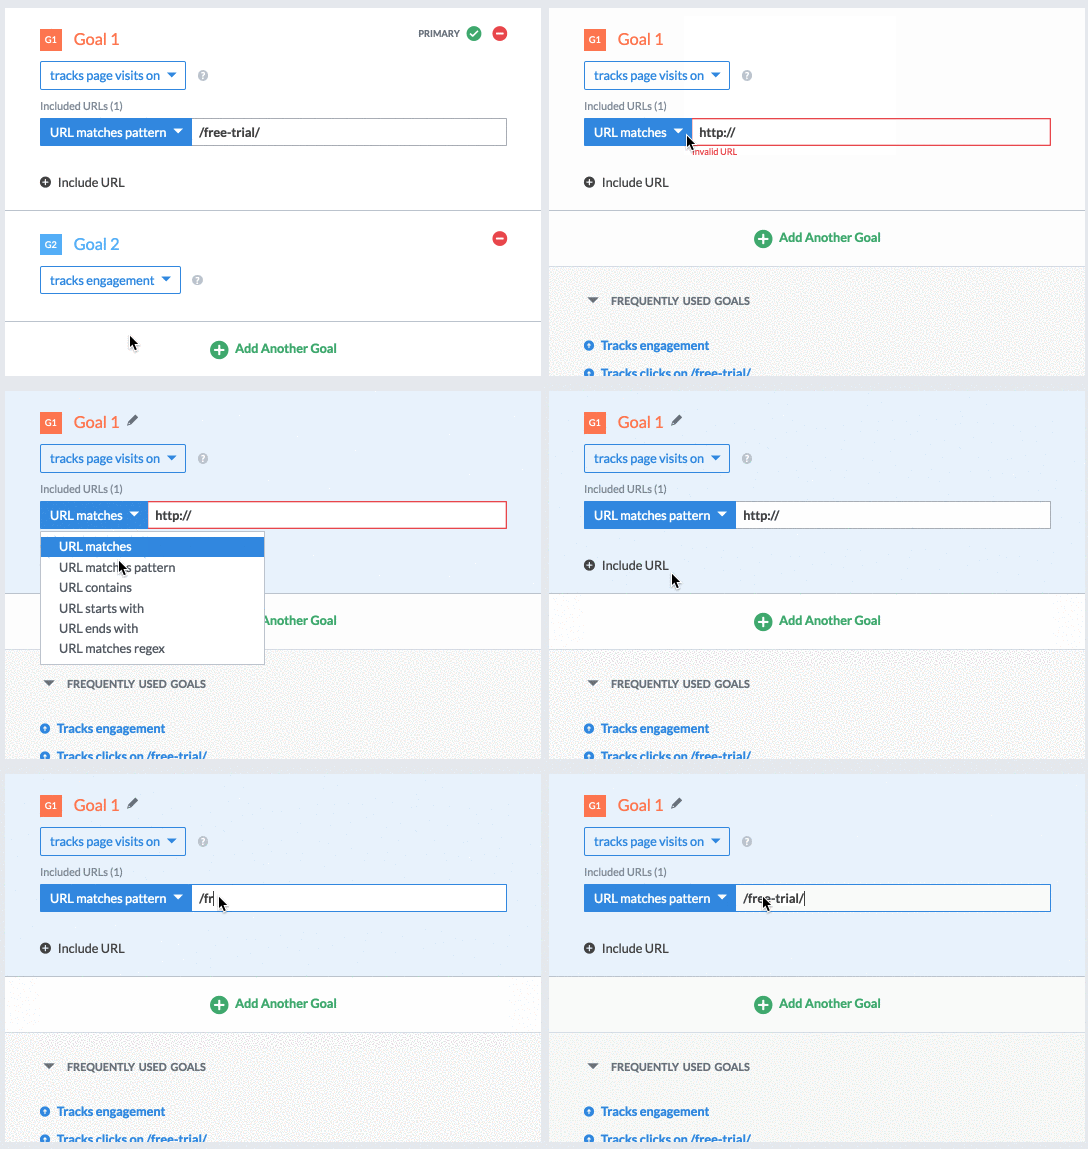
Tracking things like page visits, engagements on a page, form submissions, links, revenue generation, and even custom conversions helps you optimize your specific URLs even more.
Closing thoughts
Website testing Xrays your landing page to find the conversion problems so you can remove them and increase conversion efficiency.
It’s as simple as knowing what elements to toss and what to keep (the ones that convert well).
Set your optimization goals with PIE, ICE2, or PXL, then test 11 key elements that influence user behavior in 6 straightforward ways. Apply A/B testing, multivariate, and split URL testing to make informed decisions with on-the-mark metrics that identify where to rake in more conversions from your landing pages.
Lastly, enjoy the bump in ROI 🤑
